Elevate your team's synergy with a meticulously structured Microsoft Teams organization chart. This visual representation delineates roles and relationships, fostering a collaborative environment. In this guide, we'll walk you through the process, step-by-step, ensuring a seamless integration into your workflow. From defining positions to establishing reporting hierarchies, we cover it all.
Tailor your chart to your organization's unique structure and watch productivity soar. Streamline communication, clarify responsibilities, and empower your team with the essential Teams org chart.
In this article
Part 1. What is a Microsoft Teams Organization Chart
A Microsoft Teams org chart is a visual representation of a team's structure within the platform. It displays the members and their respective roles, illustrating the hierarchical relationships within the team. This chart helps to clarify reporting lines and facilitates a better understanding of team dynamics. By utilizing this feature, teams can enhance communication, streamline workflows, and improve collaboration within the Microsoft Teams environment.
Furthermore, an organization chart promotes the achievement of business objectives by inspiring employees to perform at their highest potential and minimizing monopolies.
Part 2. How Organization Charts Are Used
Microsoft Teams Organization Charts serve as invaluable tools for teams to enhance collaboration and productivity. Here's how team structure charts are used:
1. Visualizing Hierarchy: Organization charts provide a clear snapshot of team structure, showcasing reporting relationships and roles.
2. Clarity in Responsibilities: They define who is responsible for what, reducing confusion and promoting accountability.
3. Efficient Communication: With designated points of contact, team members know whom to approach for specific matters.
4. Onboarding and Training: New members quickly grasp the team's structure and their position within it.
5. Project Planning: It aids in assigning tasks, ensuring they align with each member's role and expertise.
6. Decision-Making: Understanding the hierarchy facilitates smoother decision-making processes.
Part 3. Best Practices to Use Org Charts in Microsoft Teams
Microsoft Teams enhances your business management experience, offering convenience in creating the organizational structure. To optimize performance, consider the following:
- Provide detailed job-related information to clarify responsibilities. This could include a job description or the worker’s role within the organization.
- Encourage team members to upload clear profile pictures for a more expressive and recognizable presence.
- Conduct regular training sessions, whether weekly or event-based, to educate members about the newly created Teams structure chart.
- Foster equal participation from all employees in project strategizing sessions to unlock the full potential of your team and elevate overall company performance.
Part4. Creating Org Charts in Microsoft Teams
To set up user accounts in Microsoft Azure Portal, follow these steps:
Step 1: Access the Microsoft Azure Portal and log in using your administrator credentials.
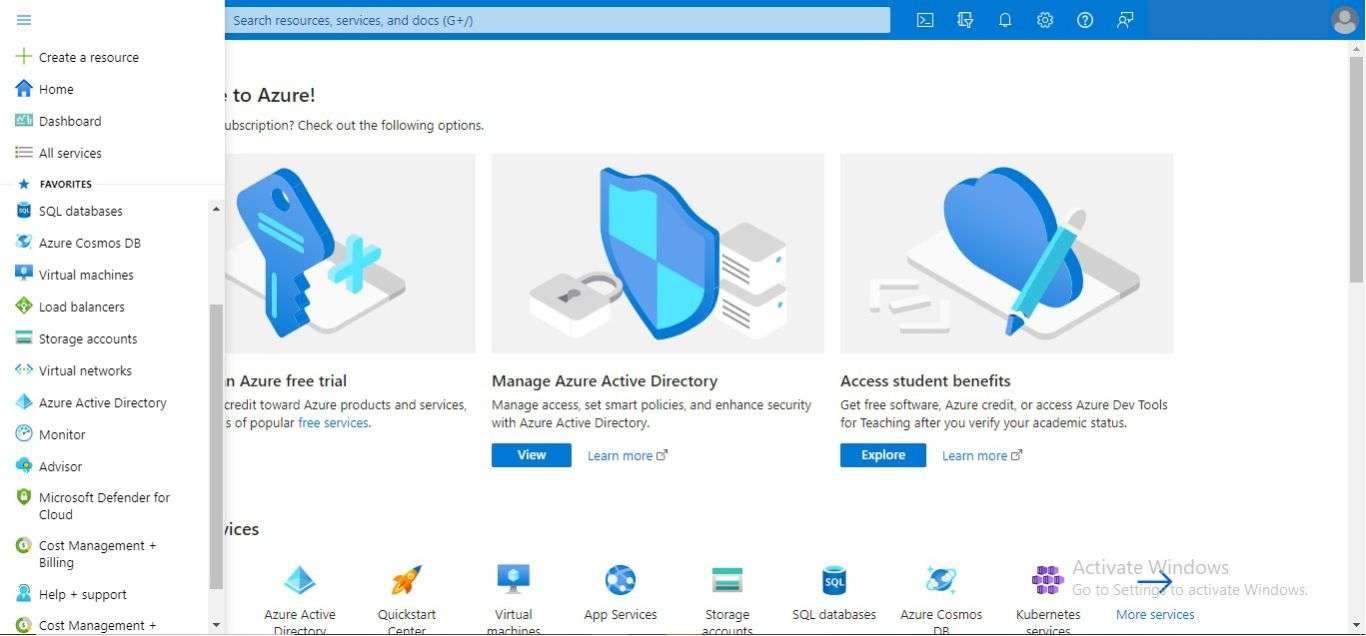
Step 2: Navigate to the "Azure Active Directory" by clicking on the "Menu" icon located at the top left and selecting it from the dropdown menu.
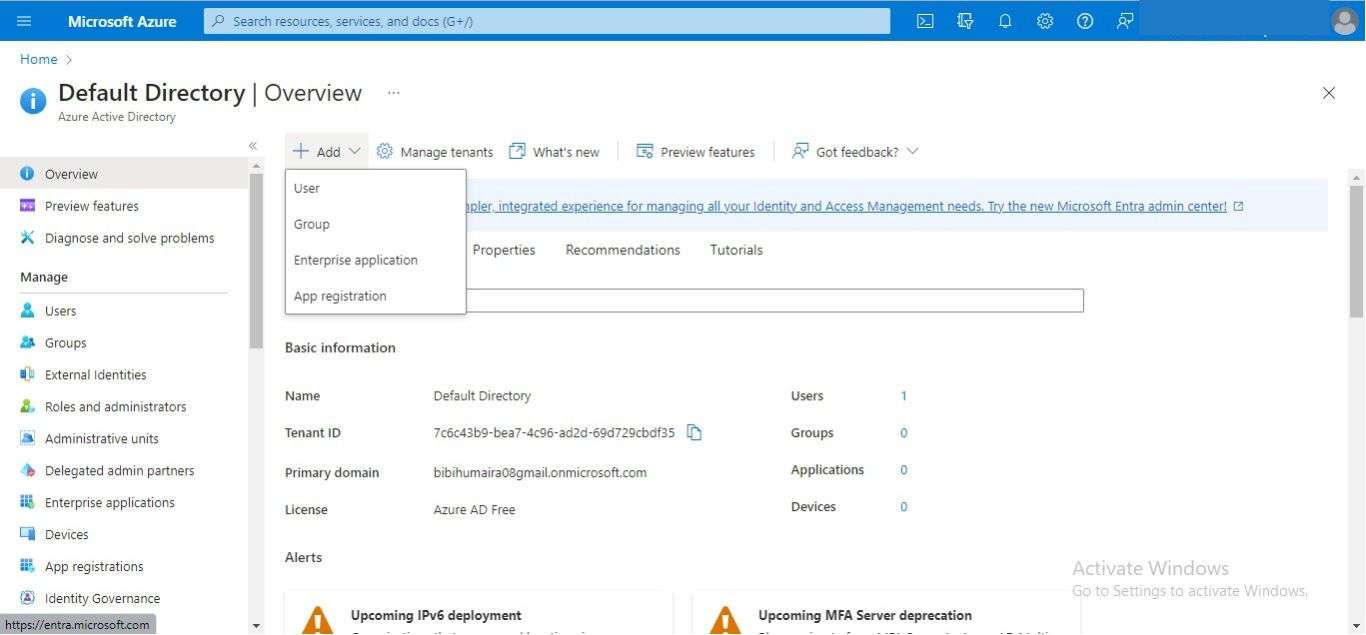
Step 3: Initiate the creation of a new user in the Active Directory by clicking on the "+Add" option and then selecting "User" from the available choices.
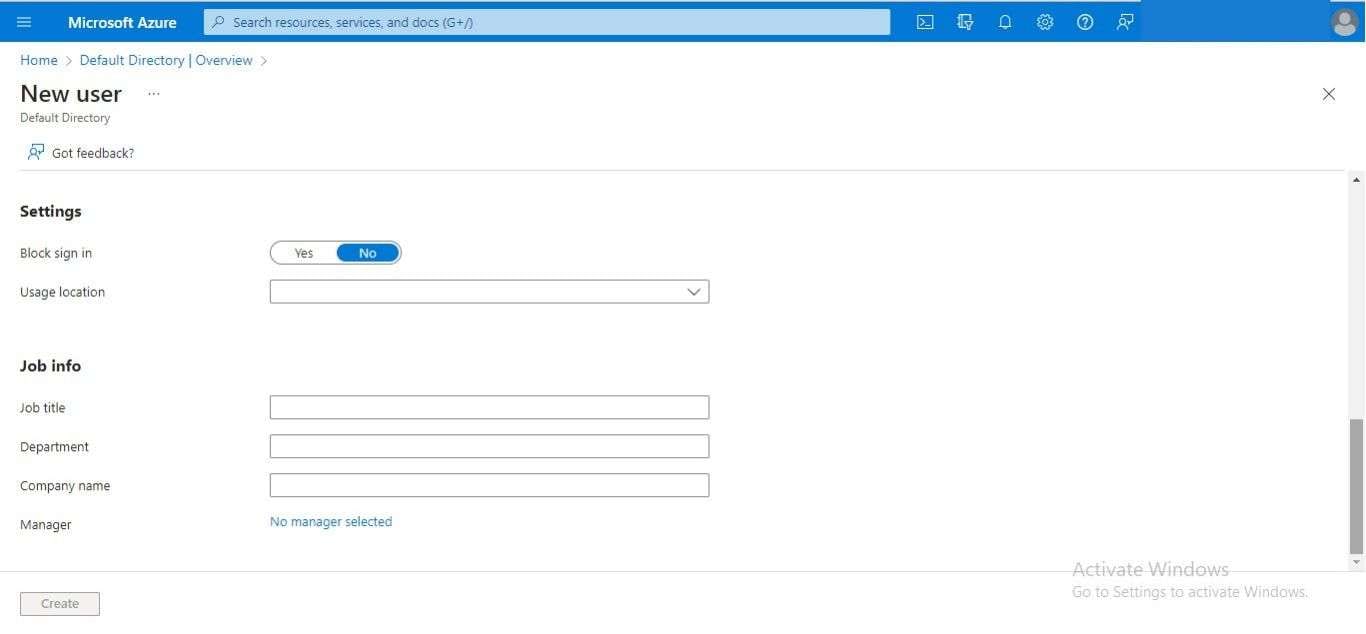
Step 4: Input the user's personal and job details, and conclude the process by clicking the "Create" button located at the bottom of the page.
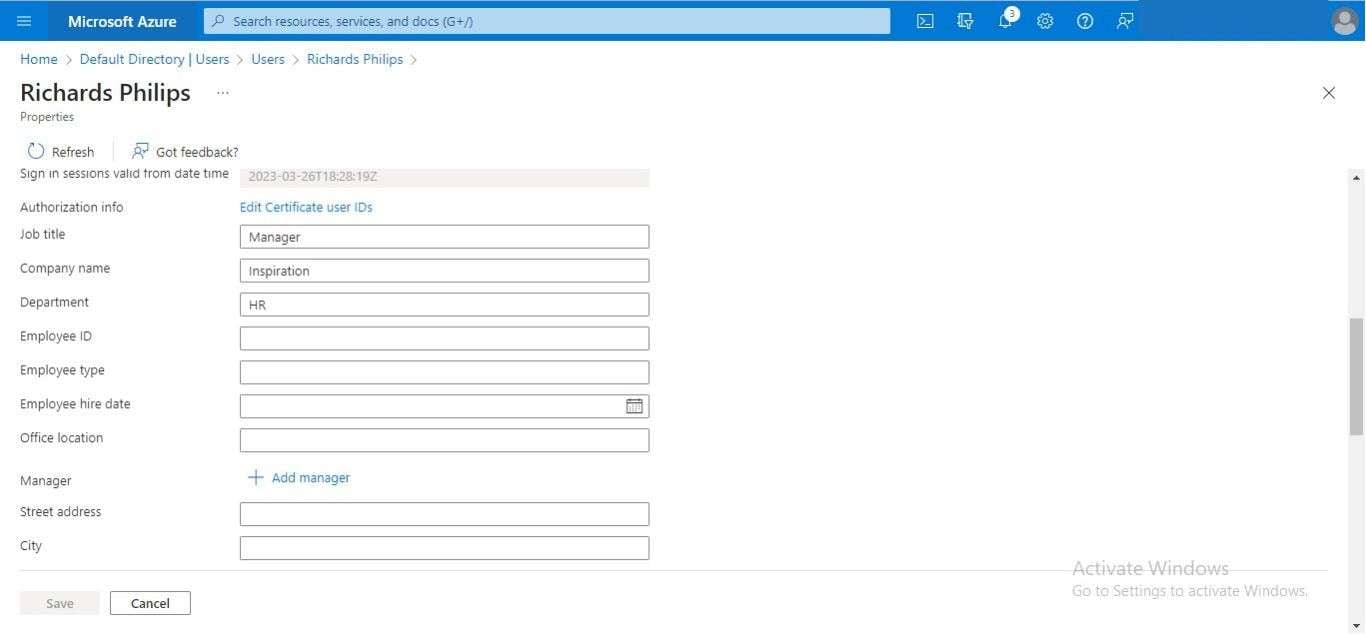
Step 5: If you wish to designate this user as a subordinate to another team member, select the "Add Manager" option.
Step 6: Replicate this procedure to establish Active Directory profiles for all your company personnel.
How to View Organization Chart on Microsoft Teams:
Step 1: Open the Microsoft Teams application and go to the "Chats" section in the left sidebar.
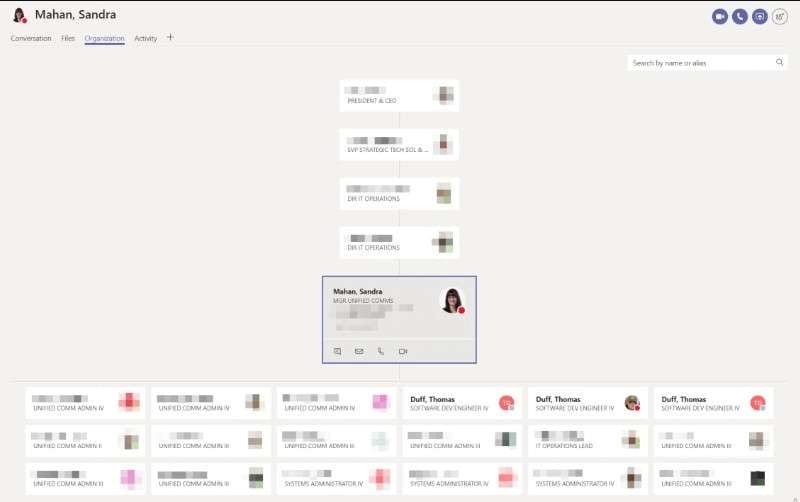
Step 2: Select a chat box of any member, then click the "Organization" tab from the options above.
Step 3: The reporting hierarchy for that member will be shown in the main window.
Part 5. Creating Org Charts Easily using EdrawMax
Creating organizational charts with ease through Wondershare EdrawMax offers a host of invaluable benefits for businesses of all sizes. Firstly, EdrawMax's user-friendly interface and extensive template library streamline the chart creation process, saving time and effort. This accessibility means that even individuals without specialized design skills can generate visually appealing and informative org charts.
EdrawMax makes team collaboration easy, allowing everyone to contribute to the org chart. This ensures the chart accurately represents the organization. This clarity in communication helps team members grasp their roles and responsibilities better.
Here are the steps to create organizational charts using EdrawMax:
Step 1: Open the EdrawMax application on your computer. In the EdrawMax interface, click on the "New" button, then choose the "Organizational Chart" category. Select a template that best suits your organization's structure.
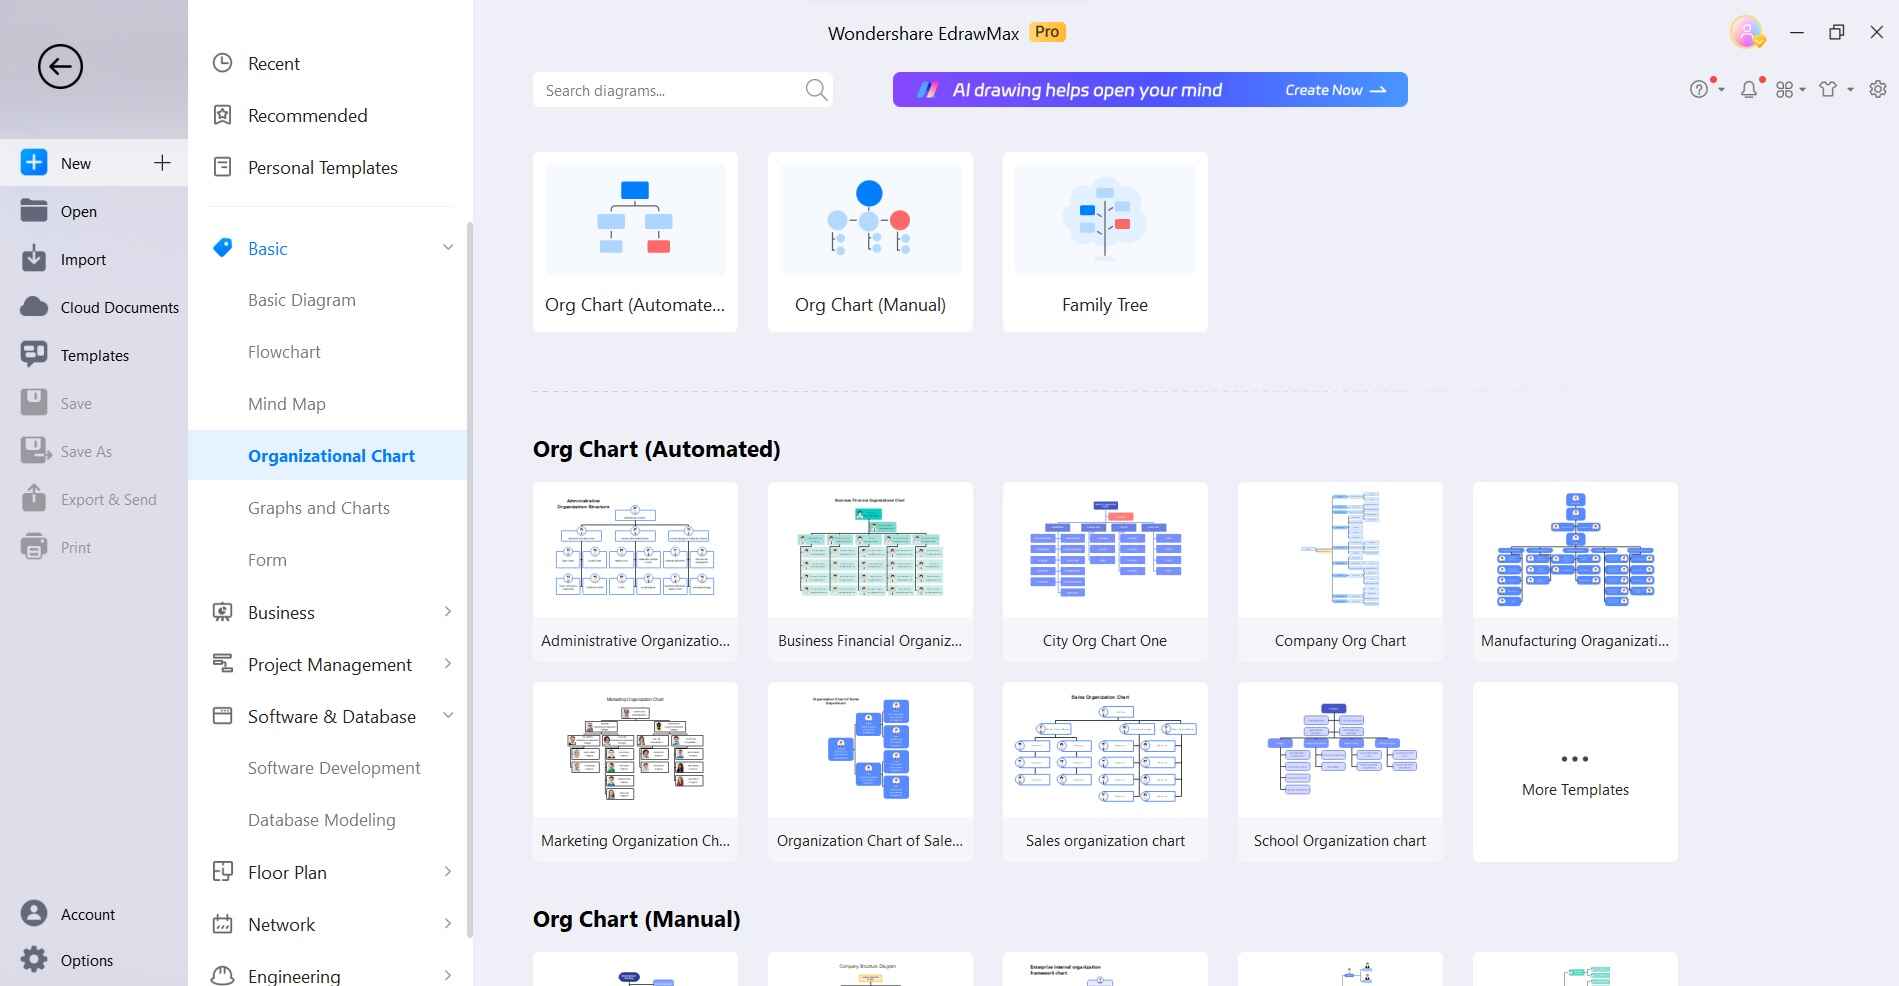
Step 2: Drag and drop shapes from the template onto the canvas to represent positions or roles within your organization. Connect these shapes to reflect reporting relationships. Double-click on a shape to edit text. Customize each shape by adding names, titles, and other relevant information.
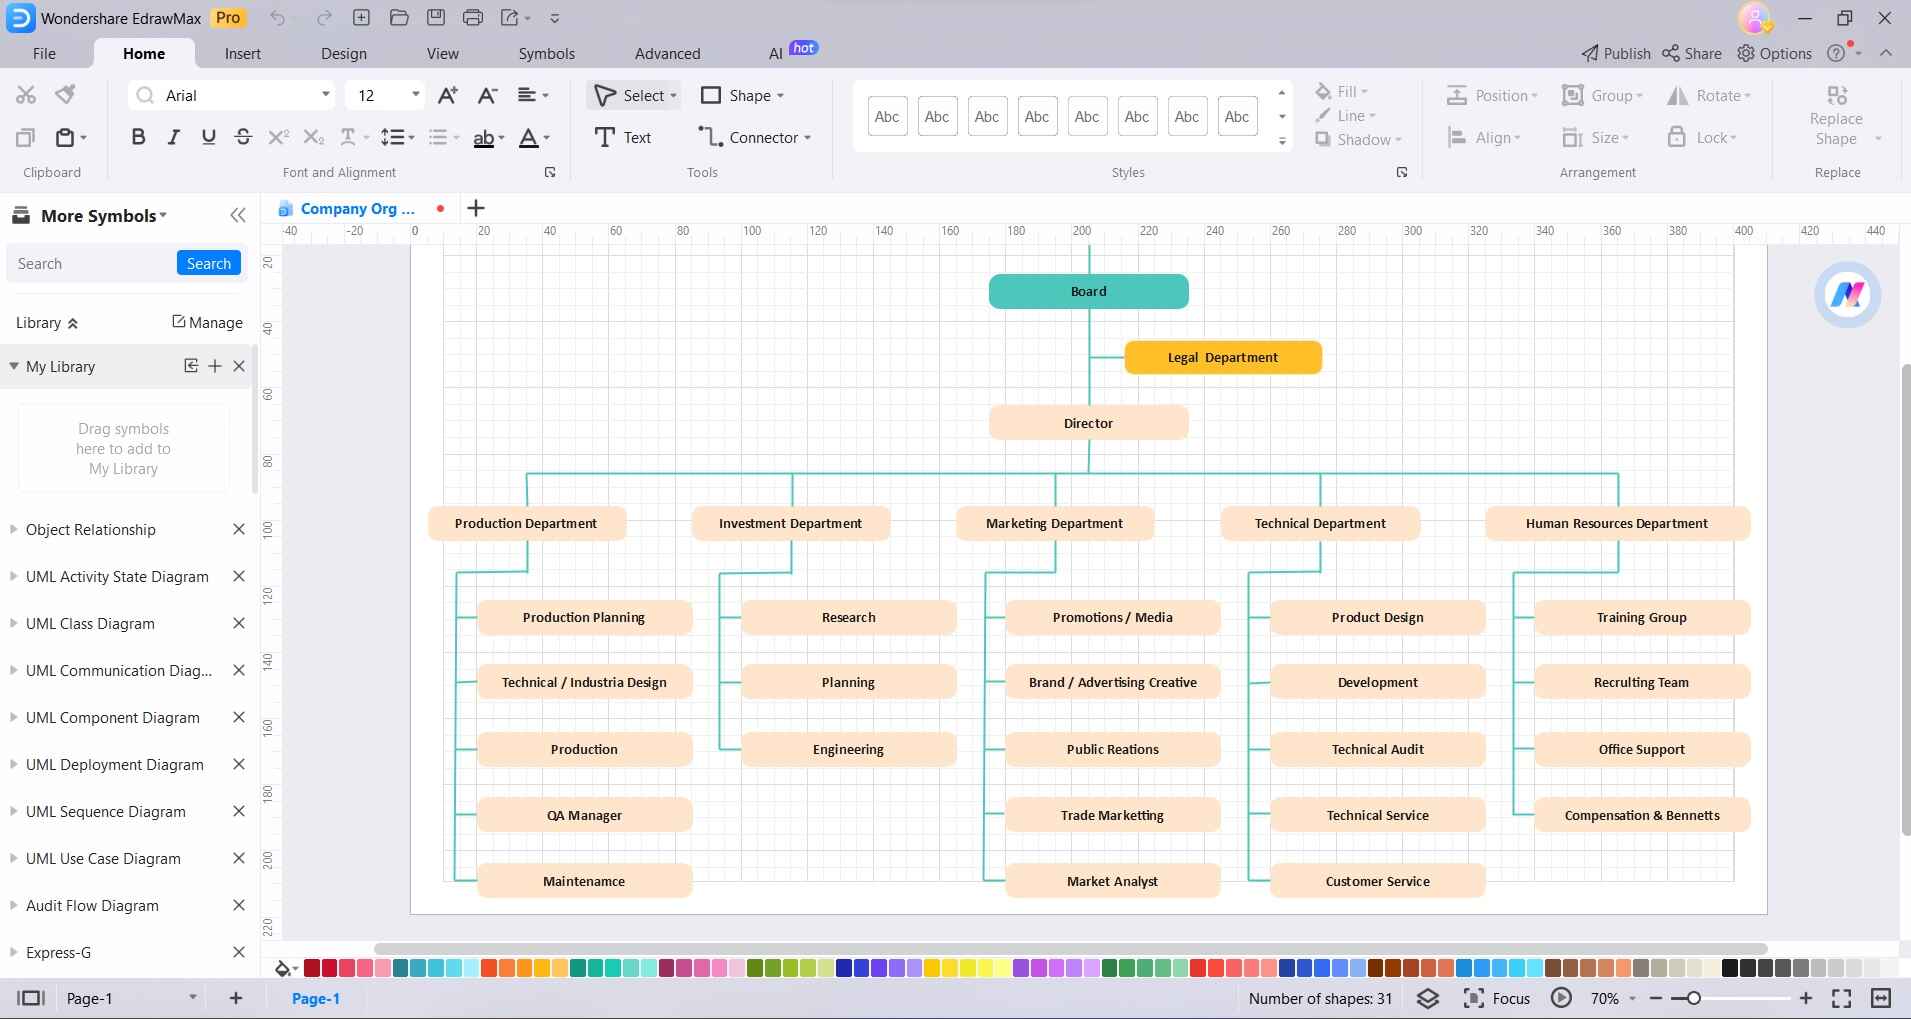
Step 3: Include additional details like department names, contact information, or responsibilities by adding text boxes or labels to the shapes. If desired, insert profile pictures or images of team members to personalize the chart further.
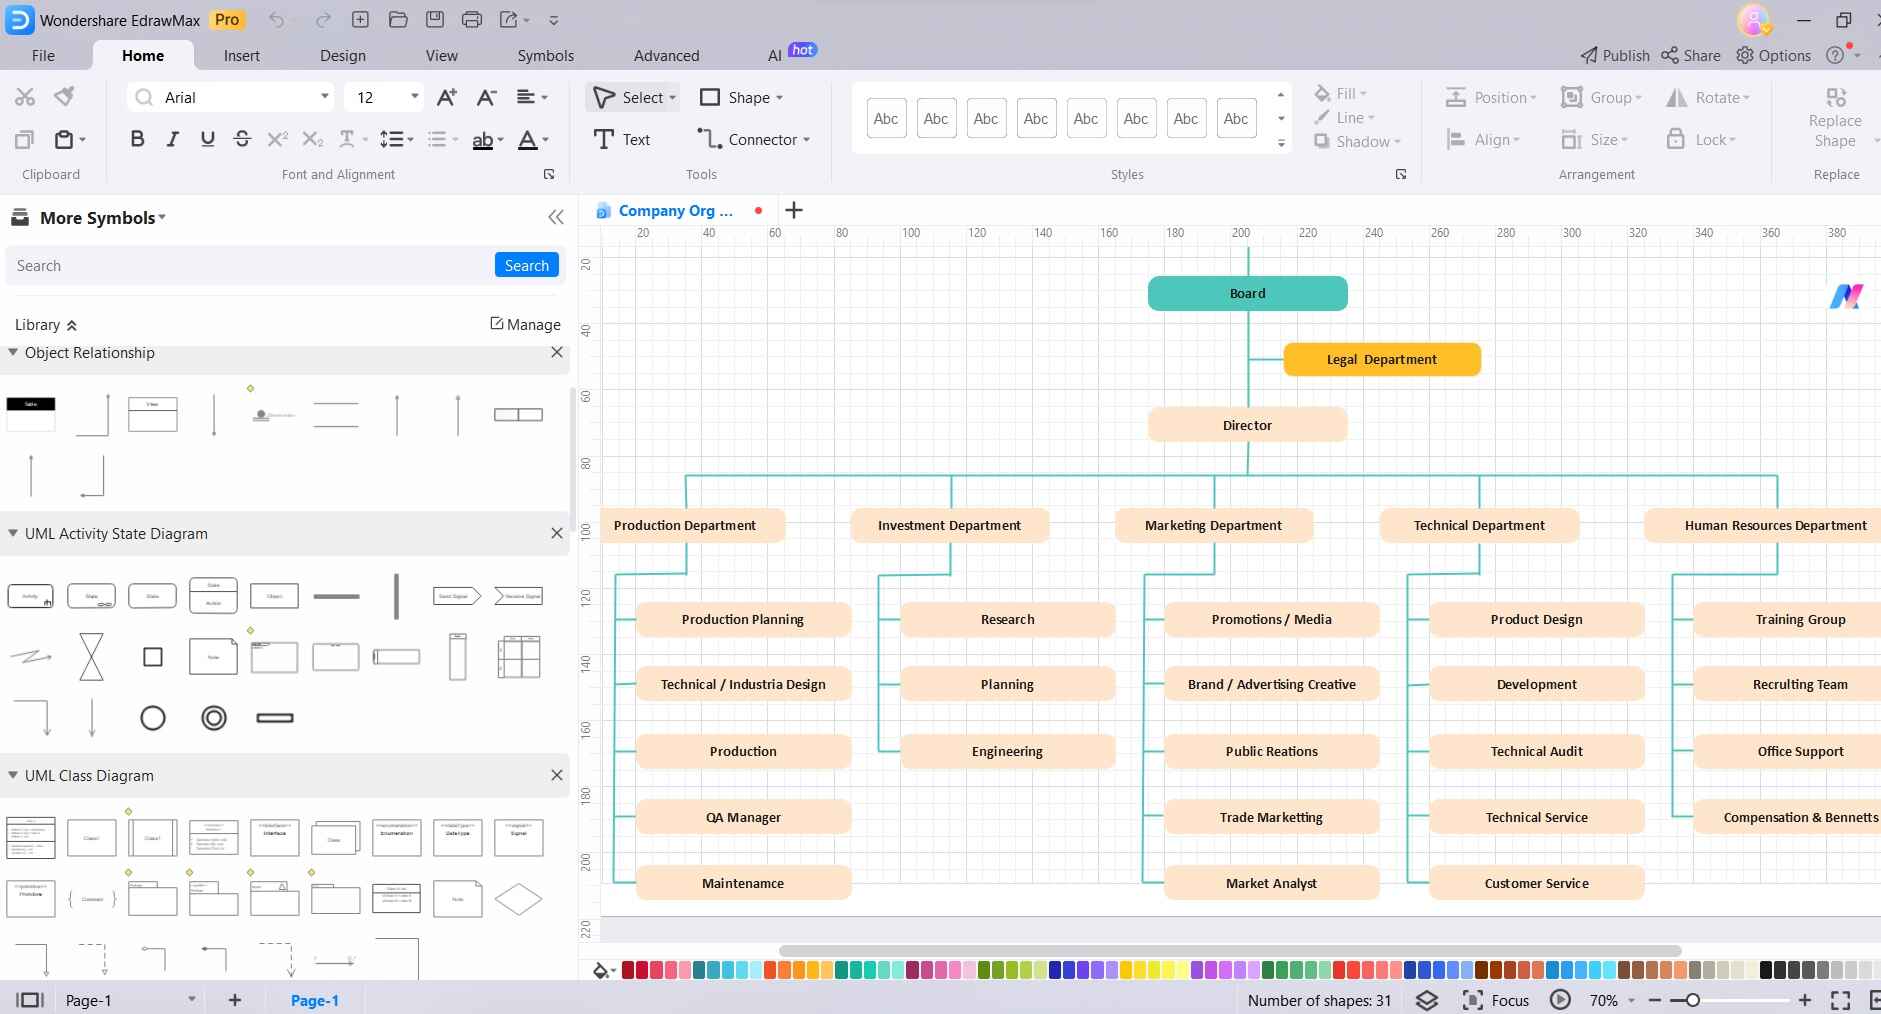
Step 4: Customize the appearance of the chart by adjusting colors, fonts, and styles to match your organization's branding.
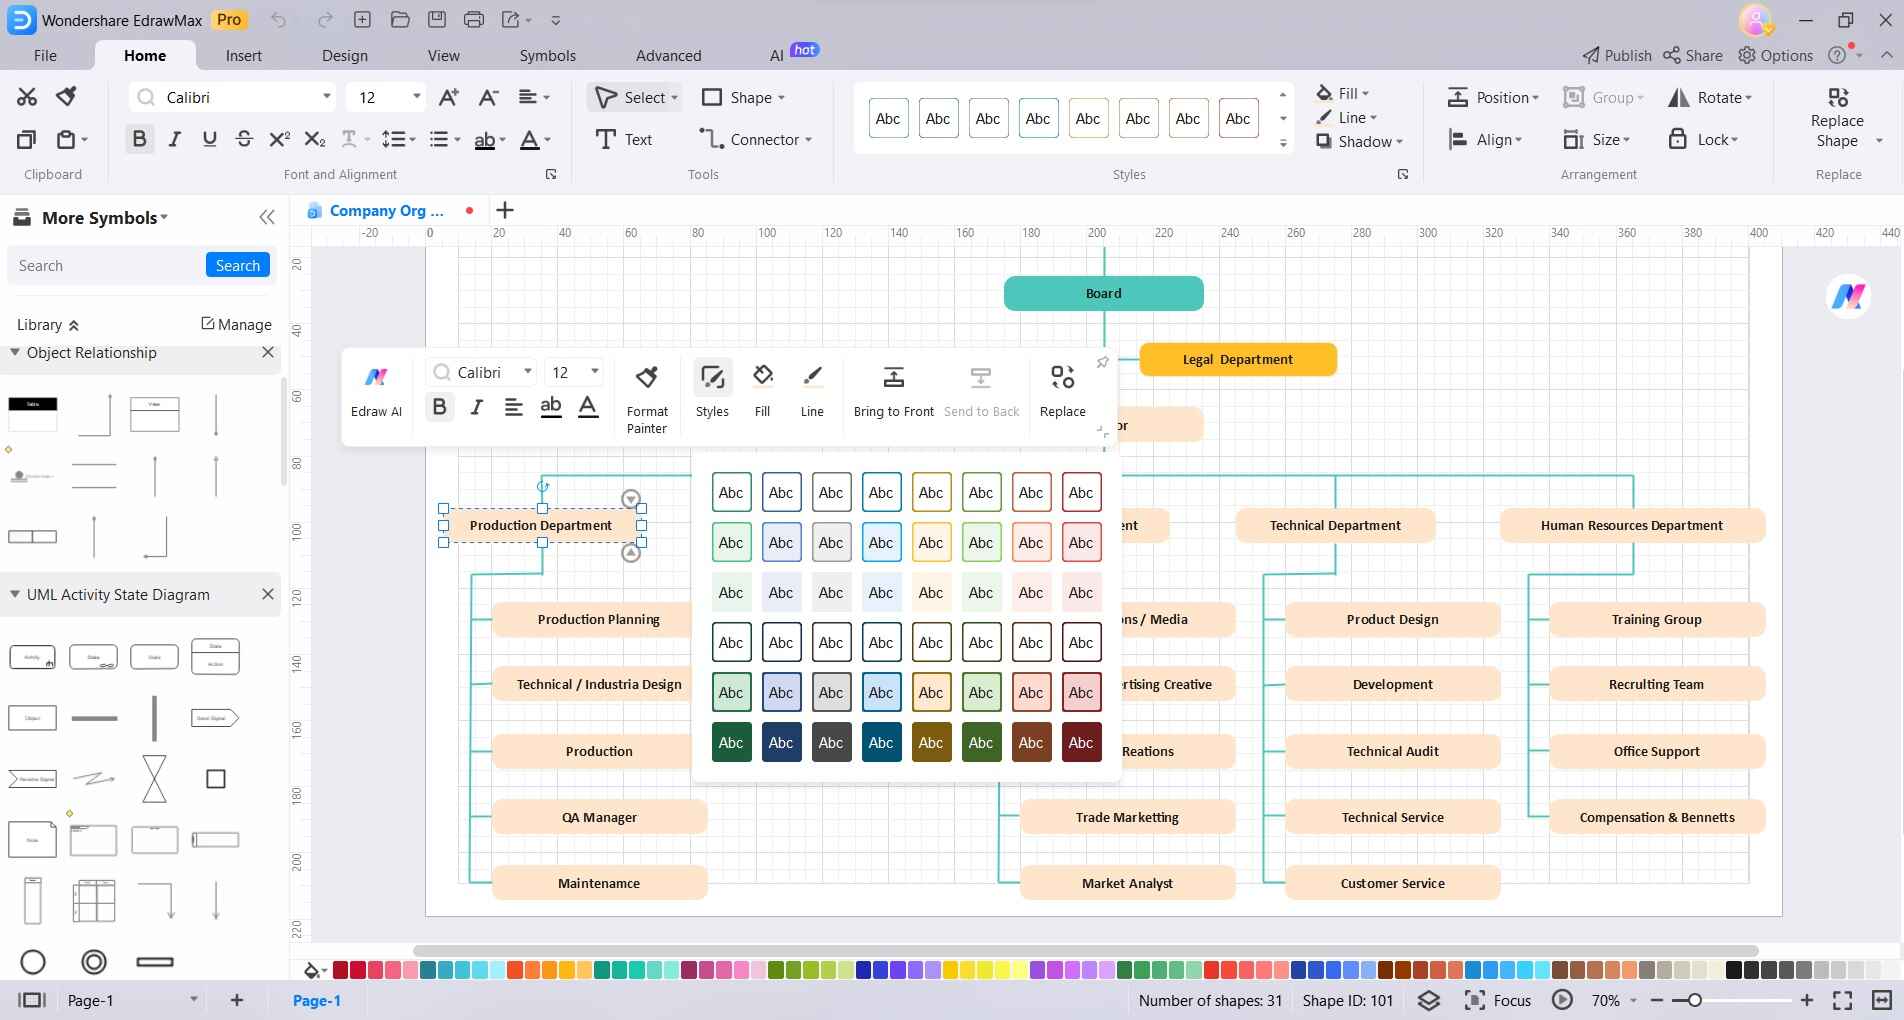
Step 5: Click on the "File" menu and select "Save" to save your organizational chart to your desired location. Use the export options in EdrawMax to save the chart in various formats like PDF, PNG, or others. Share the chart with your team members or incorporate it into presentations and reports.
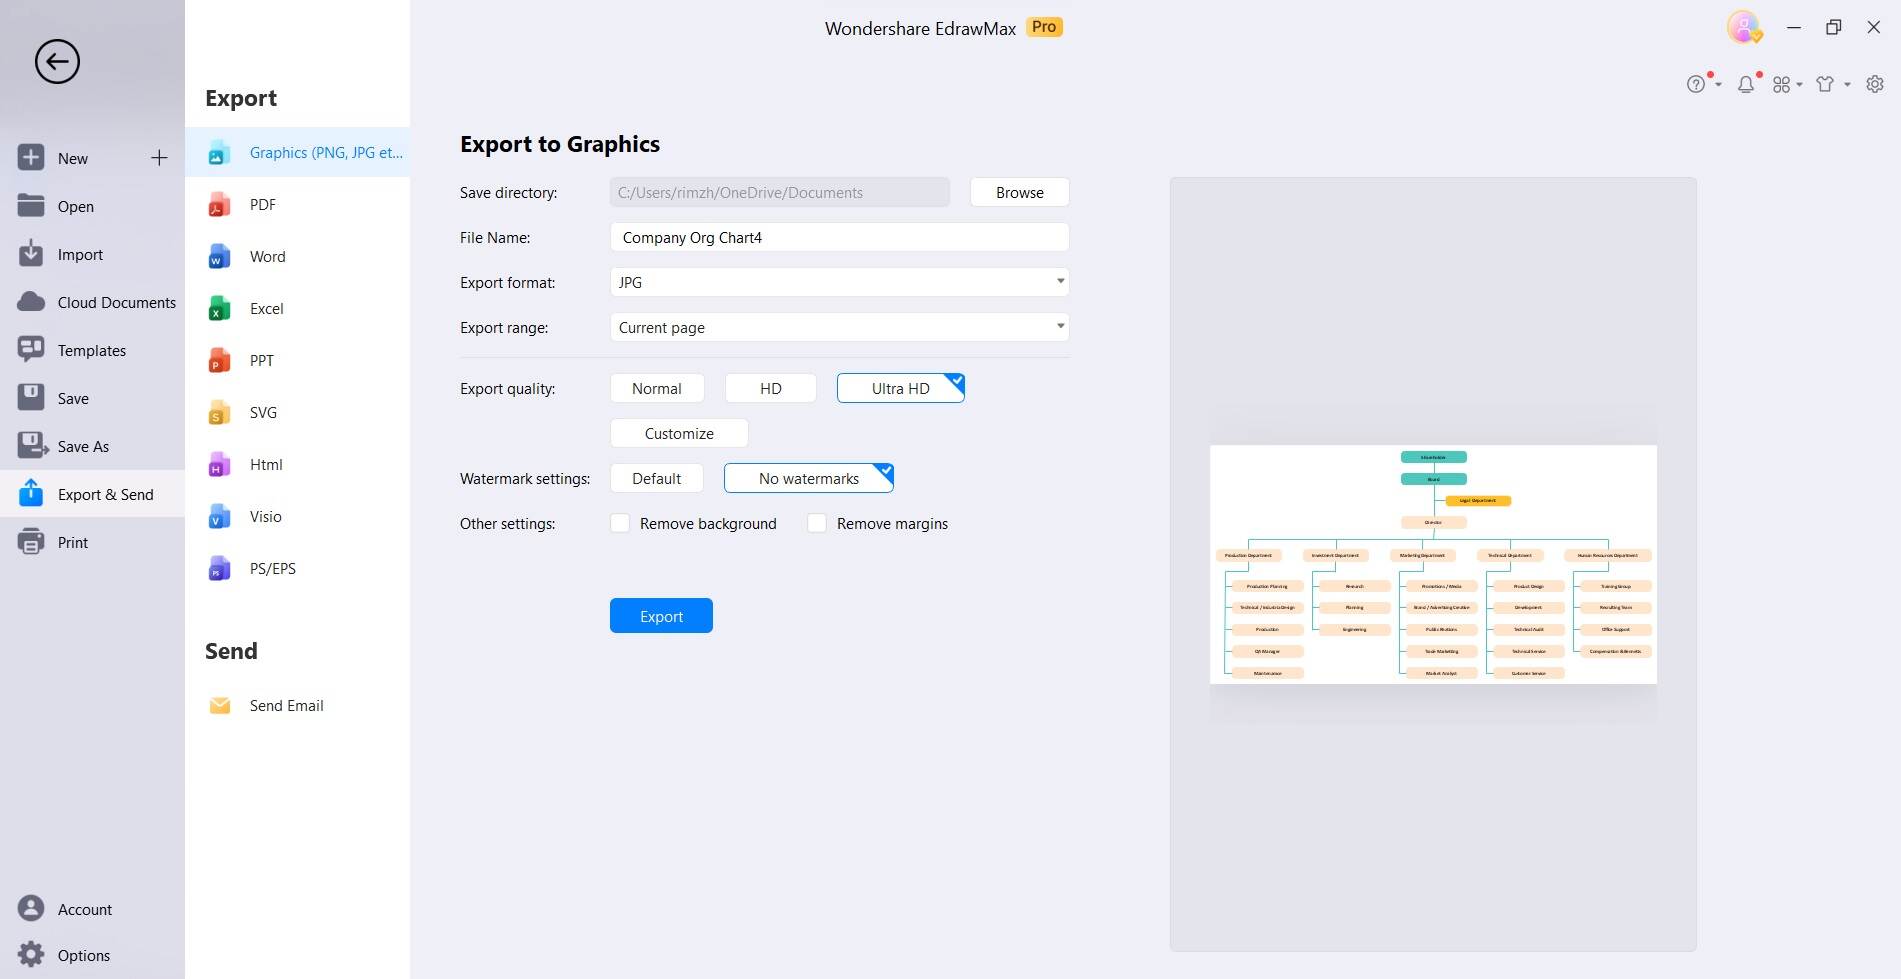
By following these steps, you can efficiently create an informative and visually appealing organizational chart using EdrawMax.
Conclusion
This wraps up our guide on how to create Microsoft Teams organization charts. EdrawMax emerges as a pivotal tool for seamlessly creating organizational charts, especially for integration within Microsoft Teams. Its user-friendly interface and collaborative capabilities facilitate efficient chart design, even for non-designers. This not only saves time but also enhances communication within teams by providing a clear visual representation of the organization's structure. The ability to customize and export charts in various formats adds to its versatility.
Overall, EdrawMax empowers organizations to effortlessly design informative and visually appealing organizational charts.


