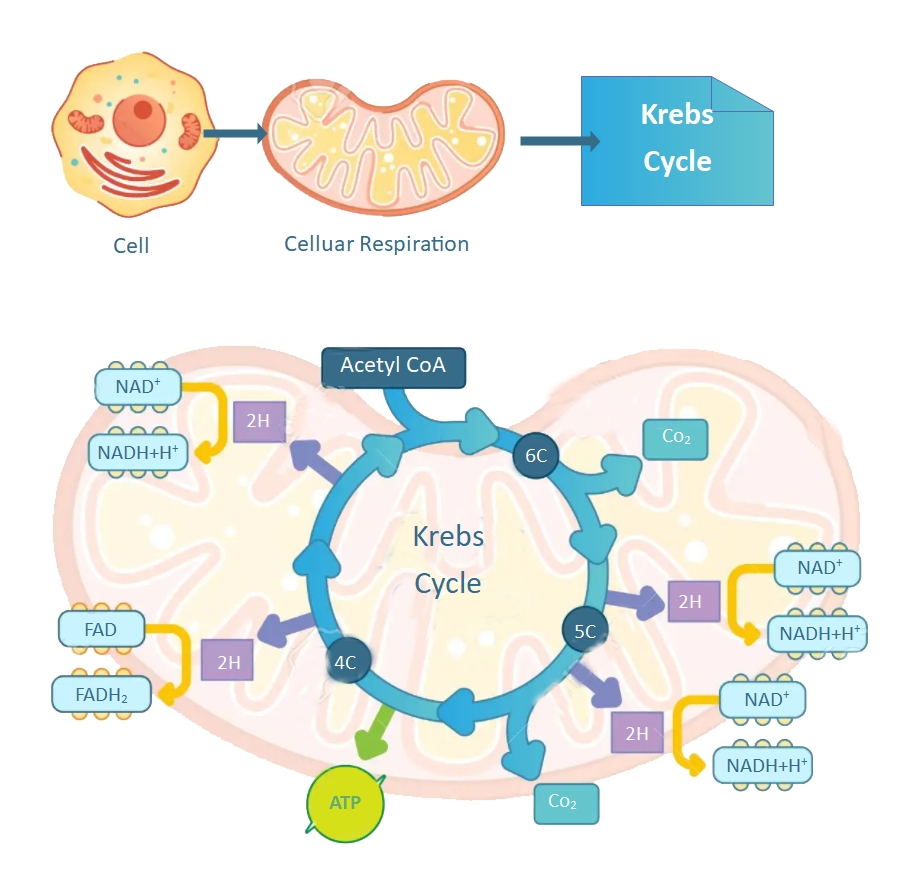
About this Phylogenetic Tree template
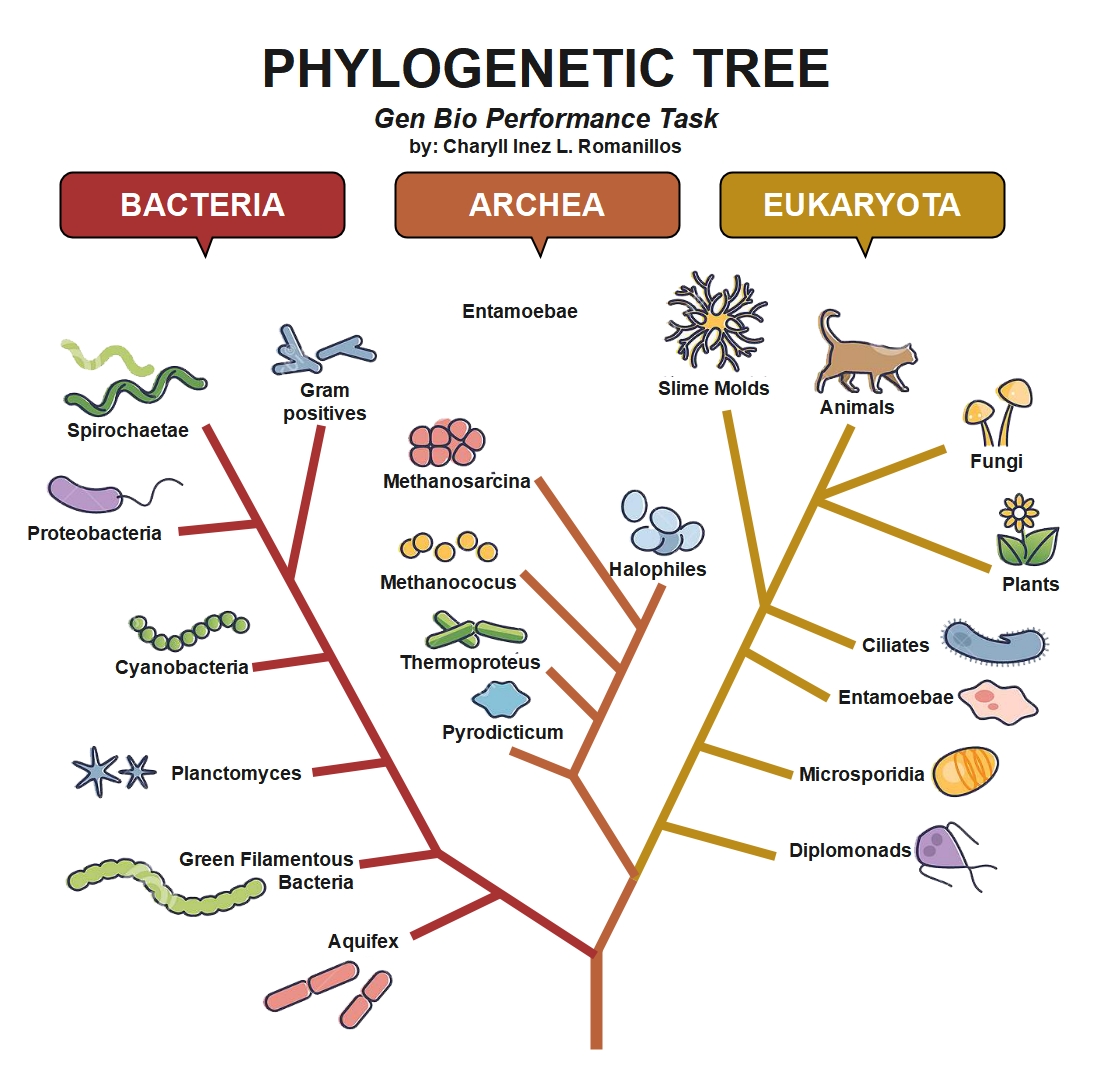
This template provides a clear visual representation of the three domains of life. It helps students and researchers map evolutionary paths from common ancestors to modern, diverse organisms using a structured, branch-like layout for easier learning.
Bacteria
Bacteria represent a massive domain of single-celled prokaryotic microorganisms. This branch includes diverse groups that live in nearly every environment on Earth. They are essential for processes like nutrient cycling and human health within the ecosystem.
- Spirochaetae
- Gram positives
- Proteobacteria
- Cyanobacteria
- Planctomyces
- Green Filamentous Bacteria
- Aquifex
Archaea
Archaea are single-celled organisms that often thrive in extreme environments like hot springs. Though they look like bacteria, they have unique genetic traits. They represent a distinct evolutionary lineage that is often found in harsh conditions.
- Methanosarcina
- Methanococcus
- Thermoproteus
- Pyrodicticum
- Halophiles
Eukaryota
Eukaryota includes all organisms with complex cells containing a nucleus. This domain covers a wide range of life forms from microscopic molds to large mammals. It highlights the structural complexity that evolved much later in history.
- Slime Molds
- Animals
- Fungi
- Plants
- Ciliates
- Entamoebae
- Microsporidia
- Diplomonads
FAQs about this Template
-
What is the primary purpose of a phylogenetic tree?
The primary purpose of a phylogenetic tree is to illustrate the evolutionary relationships among various biological species. It acts as a visual map showing how different organisms evolved from common ancestors over millions of years. By analyzing these branches, scientists can determine genetic similarities, identify ancestral traits, and understand the complex history of life on Earth more effectively.
-
How do you read the branches of this diagram?
Reading the branches involves following the lines from the root to the tips. The root represents the earliest common ancestor for all groups. Points where branches split, known as nodes, indicate where a single lineage evolved into distinct new species. Closer branches suggest more recent common ancestry and higher genetic similarity, while distant branches indicate a much earlier evolutionary split.
-
Why are the three domains separated in this template?
The three domains—Bacteria, Archaea, and Eukaryota—are separated because they represent fundamental differences in cell structure and chemistry. While Bacteria and archaea are both prokaryotic, they have distinct genetic paths. Eukaryota includes organisms with complex cell nuclei. This separation helps viewers quickly identify the broad categories of life and understand the high-level organization of biological diversity.