About this Weather App template
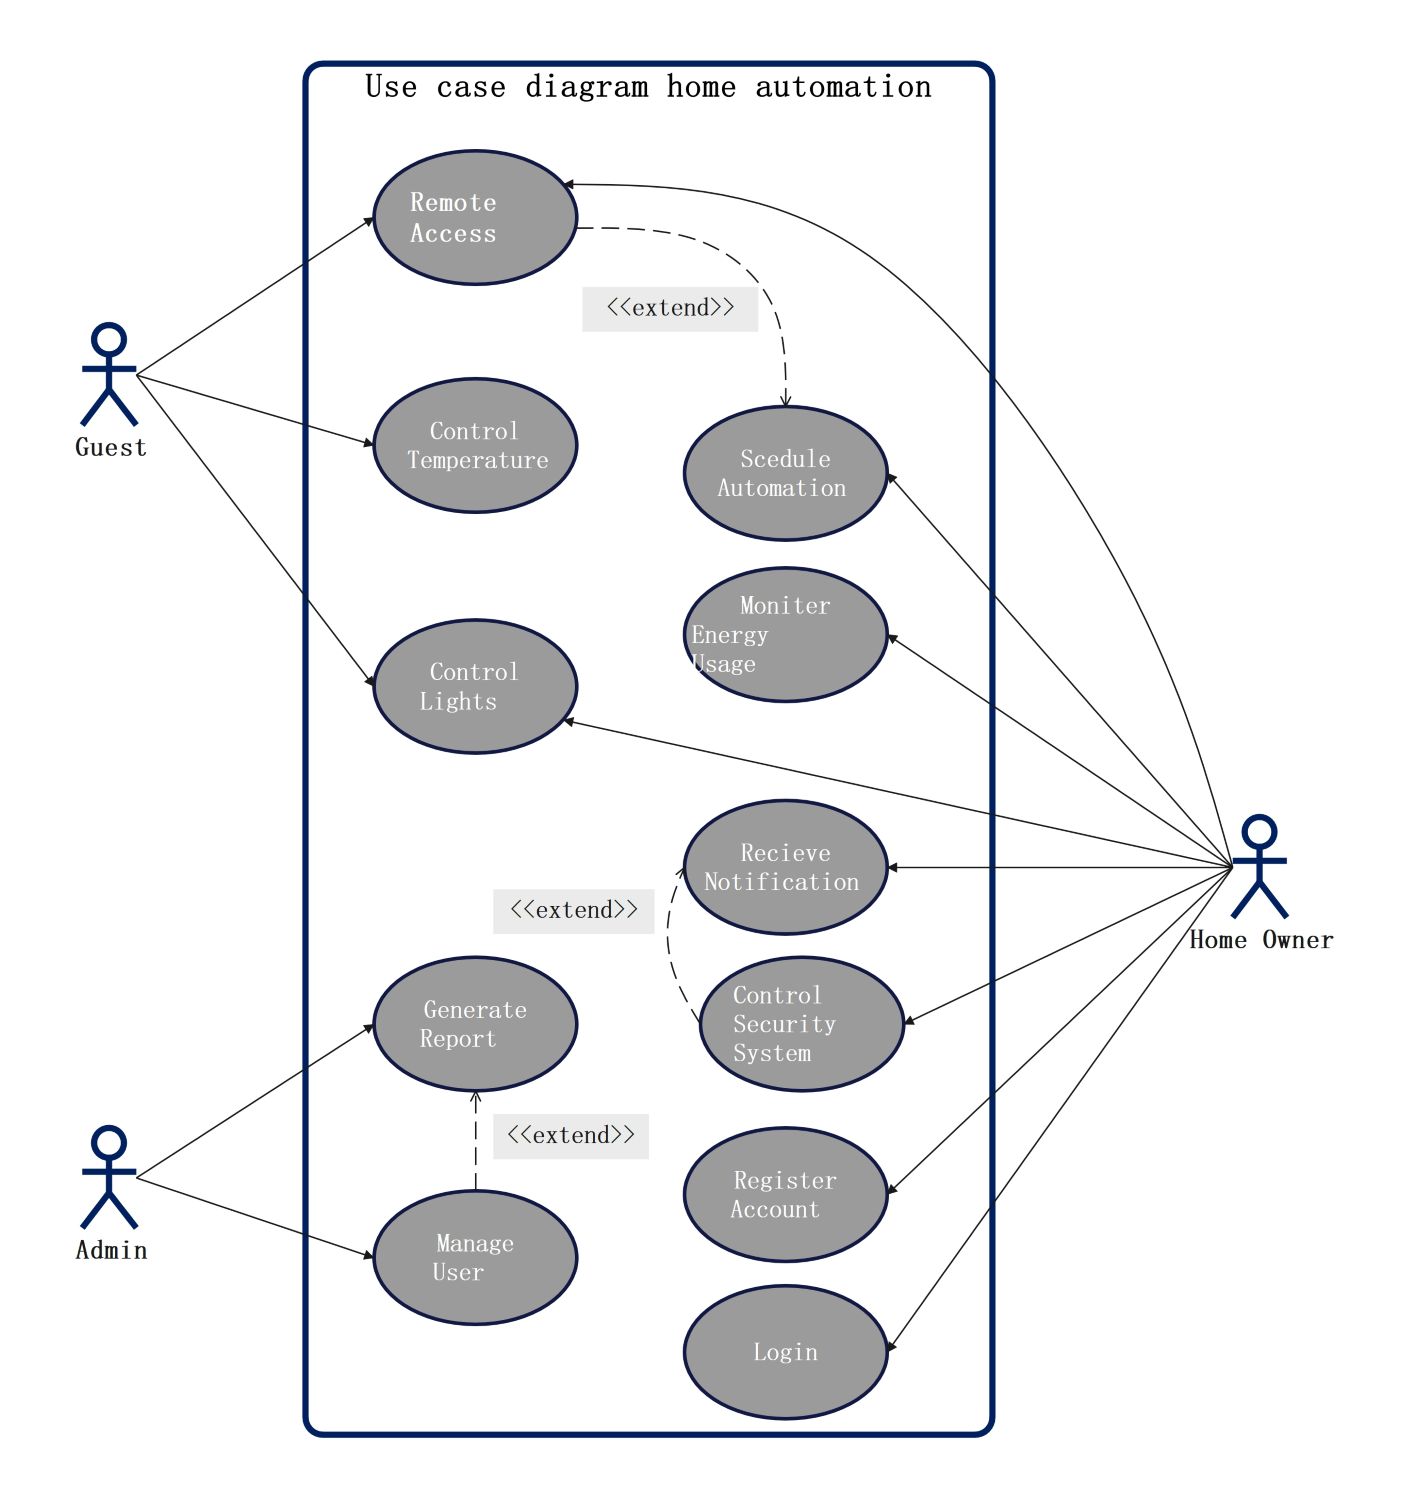
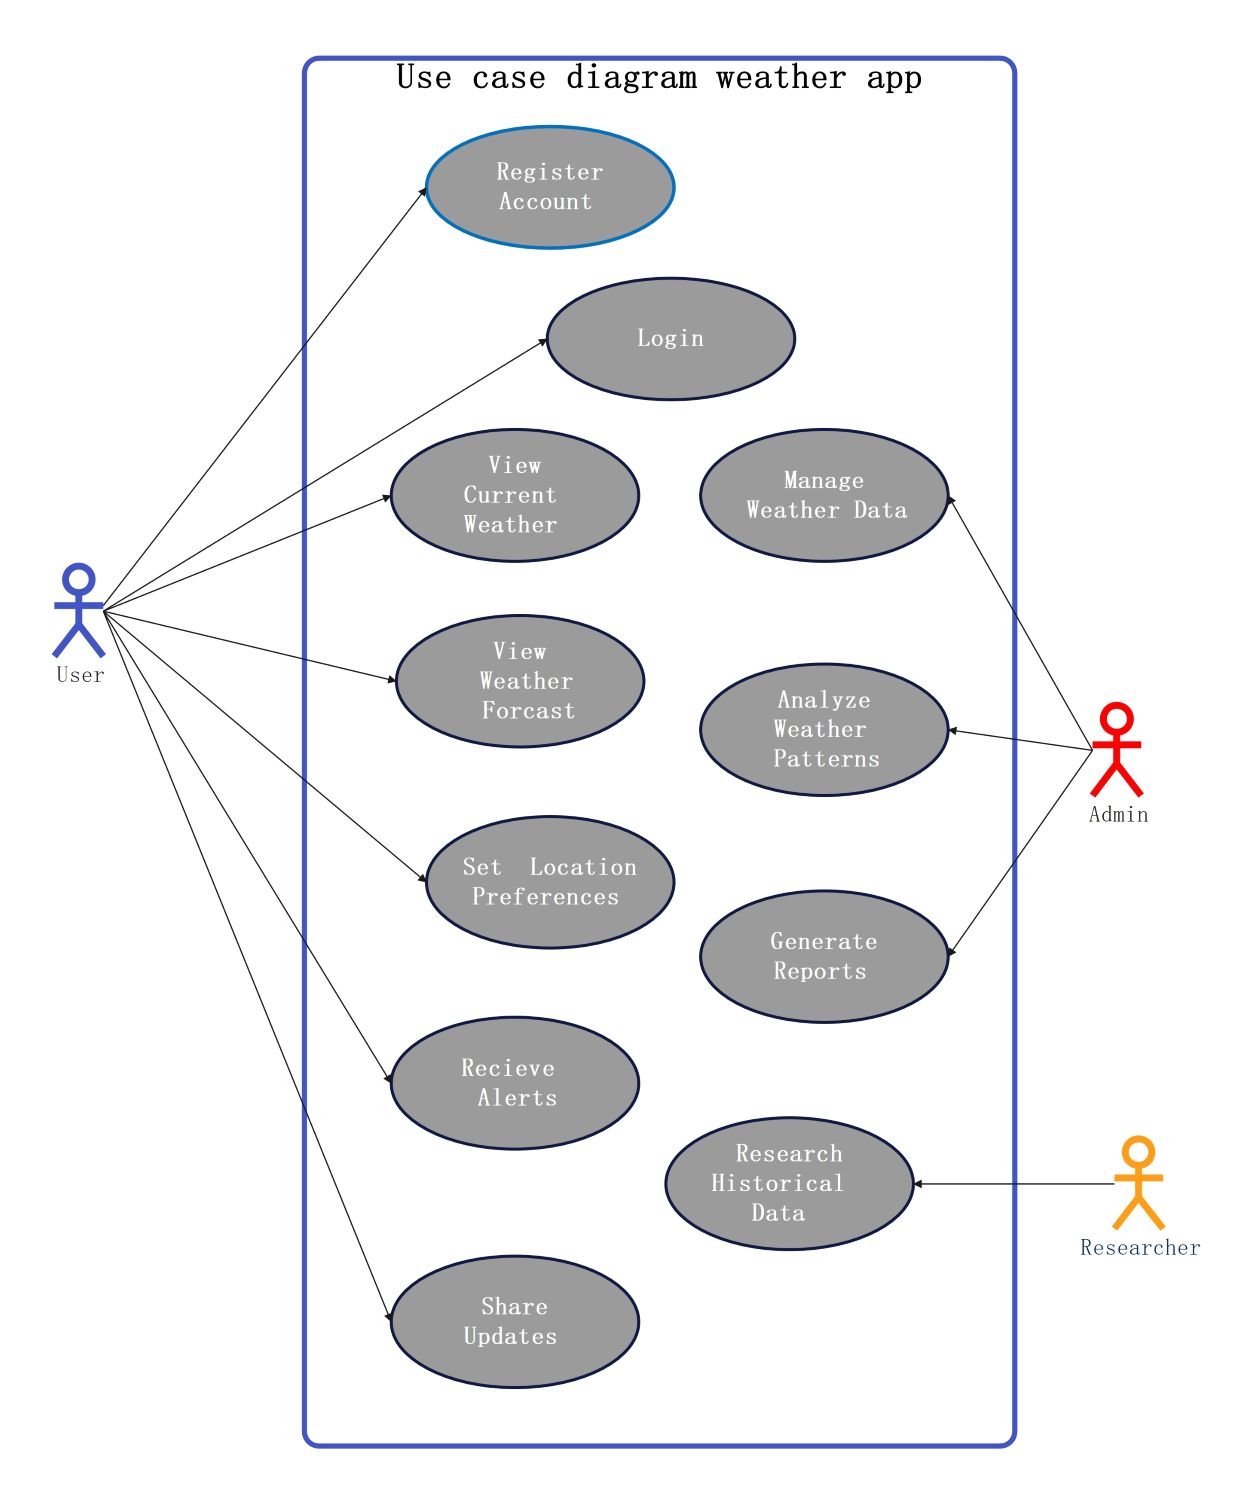
This use case diagram template outlines the functional requirements of a modern weather application. It visually maps how different users interact with the system's features. This helps developers and designers build a structured, user-friendly platform that meets diverse needs for data and safety.
User Interactions
Standard users focus on accessing daily information and managing their personal accounts. They use the app to stay informed about local conditions and share important weather updates with friends or family members through integrated social features.
- Register Account and Login
- View Current Weather
- View Weather Forecast
- Set Location Preferences
- Receive Real-time Alerts
- Share Updates
Administrative Control
Administrators play a vital role in maintaining the system's accuracy and reliability. They handle backend data streams and ensure weather models function correctly. This role is essential for providing high-quality, trustworthy information for every active user.
- Manage Weather Data
- Analyze Weather Patterns
- Generate Detailed Reports
Research and Data Analysis
Researchers use the platform to study long-term trends and historical climatic shifts. By accessing stored data, they identify patterns to improve future predictions. This specialized access supports scientific study and helps refine the app's internal logic.
- Research Historical Data
FAQs about this Template
-
What is the benefit of using a use case diagram for a weather app?
Use case diagrams help teams visualize how different people use the software. They define clear boundaries for features like alerts or forecasts. This visual guide ensures that every requirement is met during development. It also helps project managers spot missing features early in the design phase. Using a diagram saves time and reduces errors before coding starts.
-
How does an admin role differ from a standard user in this system?
Standard users primarily consume data, such as checking forecasts or receiving alerts for their specific city. In contrast, admins manage the system’s health and data integrity. They analyze broad weather patterns and generate internal reports for stakeholders. While users interact with the interface, admins work behind the scenes. This ensures the app remains reliable, fast, and packed with accurate information.
-
Why is historical data important for weather applications?
Historical data allows researchers to compare current conditions with past trends. This helps in identifying climate shifts and improving the accuracy of future forecasts. Users might also use this data to plan events based on typical seasonal weather. For the app itself, archives serve as a training set for predictive algorithms. Without historical records, providing long-term outlooks would be much harder.