About this 5 Steps to Map Your Process template
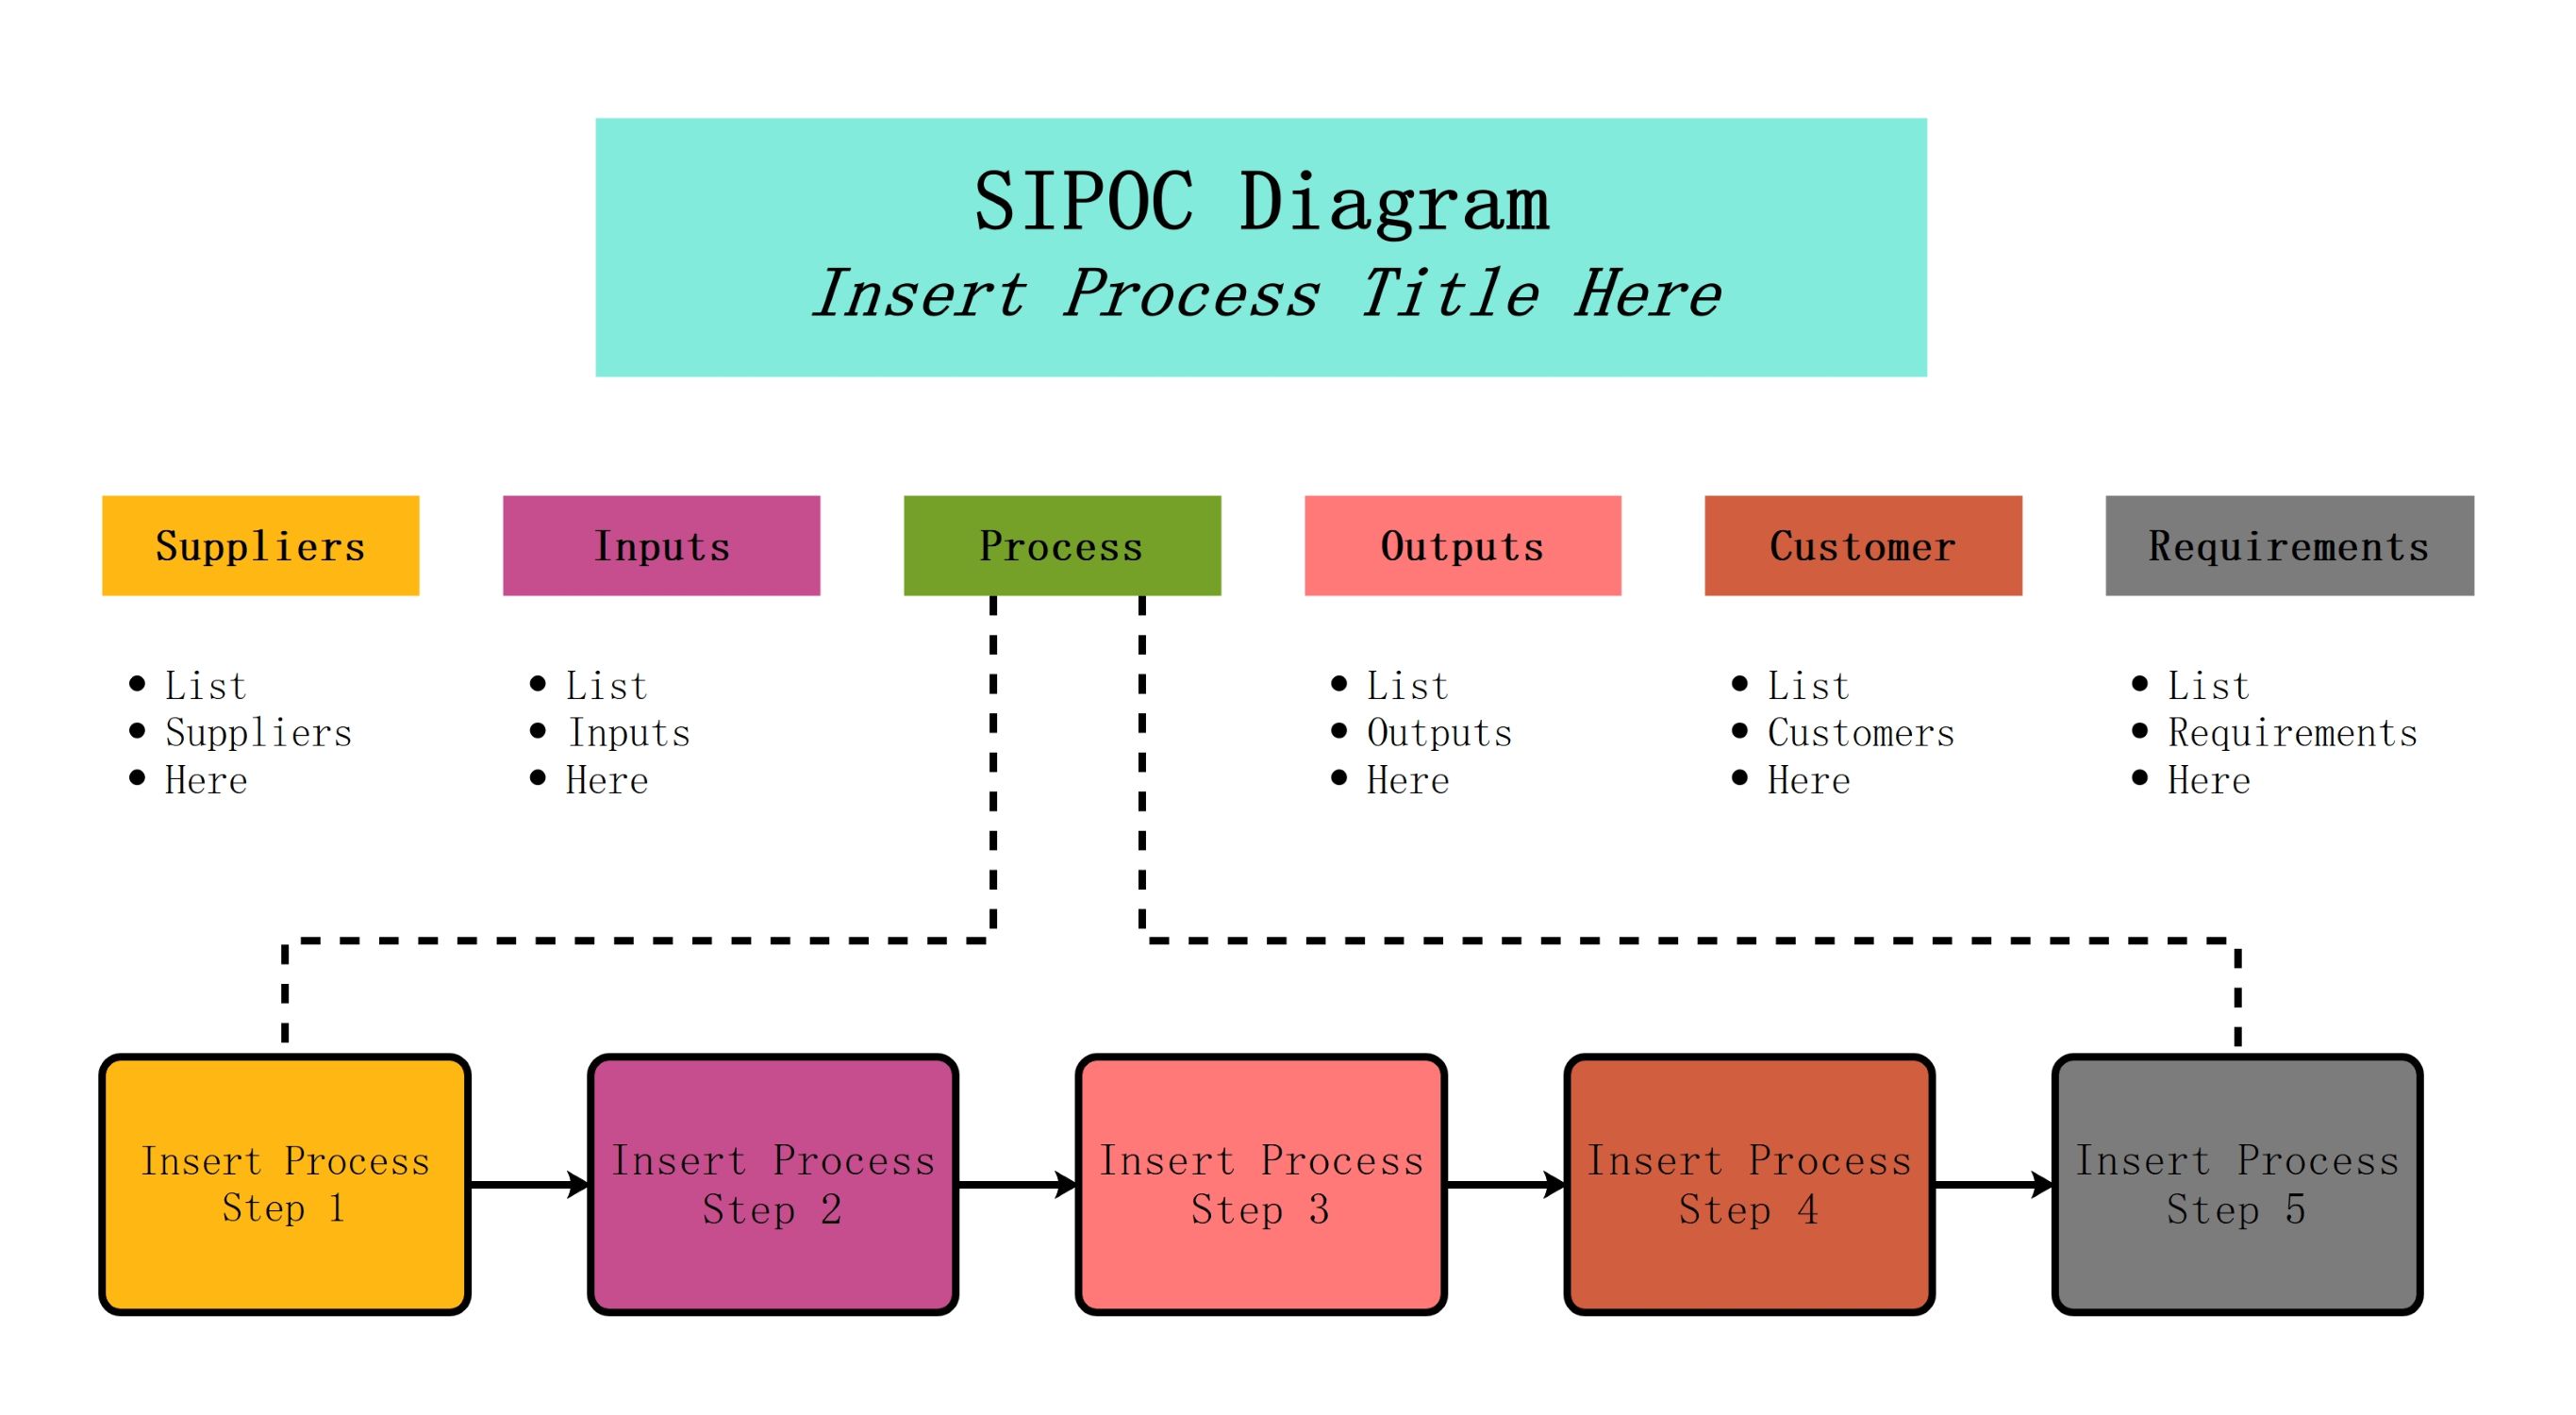
This SIPOC template provides a high-level view of your business processes. It helps you identify key players, resources, and specific steps needed to deliver value. Use this layout to streamline operations and ensure alignment across teams.
Suppliers
Suppliers are the entities providing the necessary resources for your process. Identifying them ensures you know exactly where your materials or data originate. This clarity helps in managing vendor relationships and quality control efficiently.
- List Suppliers Here
- Resource Providers
- External Vendors
Inputs
Inputs represent the materials, information, or resources required to execute the process steps. Accurate identification of inputs is crucial for maintaining consistency and quality. Without the right inputs, the subsequent process steps cannot function correctly.
- List Inputs Here
- Raw Materials
- Data Requirements
Process
The process section details the core activities that transform inputs into valuable outputs. In this template, you can map out five specific stages. This visualization helps teams identify bottlenecks and improve overall workflow efficiency.
- Insert Process Step 1
- Insert Process Step 2
- Insert Process Step 3
- Insert Process Step 4
- Insert Process Step 5
Outputs
Outputs are the specific products, services, or results generated by your process. Defining these clearly helps in measuring success and meeting quality standards. Every output should directly relate to the needs of the end customer or stakeholder.
- List Outputs Here
- Final Products
- Service Reports
Customer
The customer category identifies who receives the final outputs of your process mapping. Understanding your audience ensures that the process is designed to meet their specific needs. This focus helps improve satisfaction and long-term business growth.
- List Customers Here
- Internal Stakeholders
- End Users
Requirements
Requirements outline the specific standards or conditions that the process must meet. These guidelines ensure that the final output aligns with customer expectations and regulatory rules. Clear requirements prevent errors and reduce waste during production.
- List Requirements Here
- Quality Standards
- Compliance Rules
FAQs about this Template
-
What is the primary purpose of a SIPOC diagram in process mapping?
A SIPOC diagram serves as a high-level tool to identify the essential elements of a business process. It maps out suppliers, inputs, processes, outputs, and customers to provide a bird's-eye view. This helps teams understand the scope of a project, align stakeholders, and ensure that all requirements are met before diving into more detailed process improvements or workflow changes.
-
How do the five process steps help in organizing a workflow?
Breaking down a complex workflow into five distinct steps simplifies the visualization of tasks. It allows team members to focus on individual segments of the operation, making it easier to spot inefficiencies or gaps. By using this structured approach, organizations can standardize their procedures, improve communication between departments, and ensure that every team member understands their specific role in the larger process.
-
Why is it important to define requirements at the end of the map?
Defining requirements ensures that the final output meets the necessary quality and compliance standards. It acts as a final check to confirm that the customer's needs are satisfied. Without clear requirements, a process might produce outputs that are unusable or non-compliant. By listing these criteria, you establish a benchmark for success and provide a clear roadmap for continuous process improvement efforts.