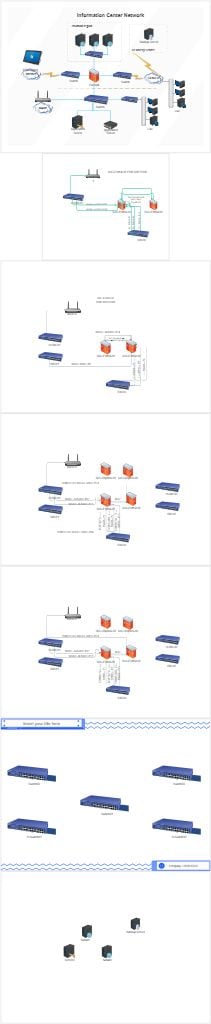
About this Network Diagram for Diagnosis and Troubleshooting template
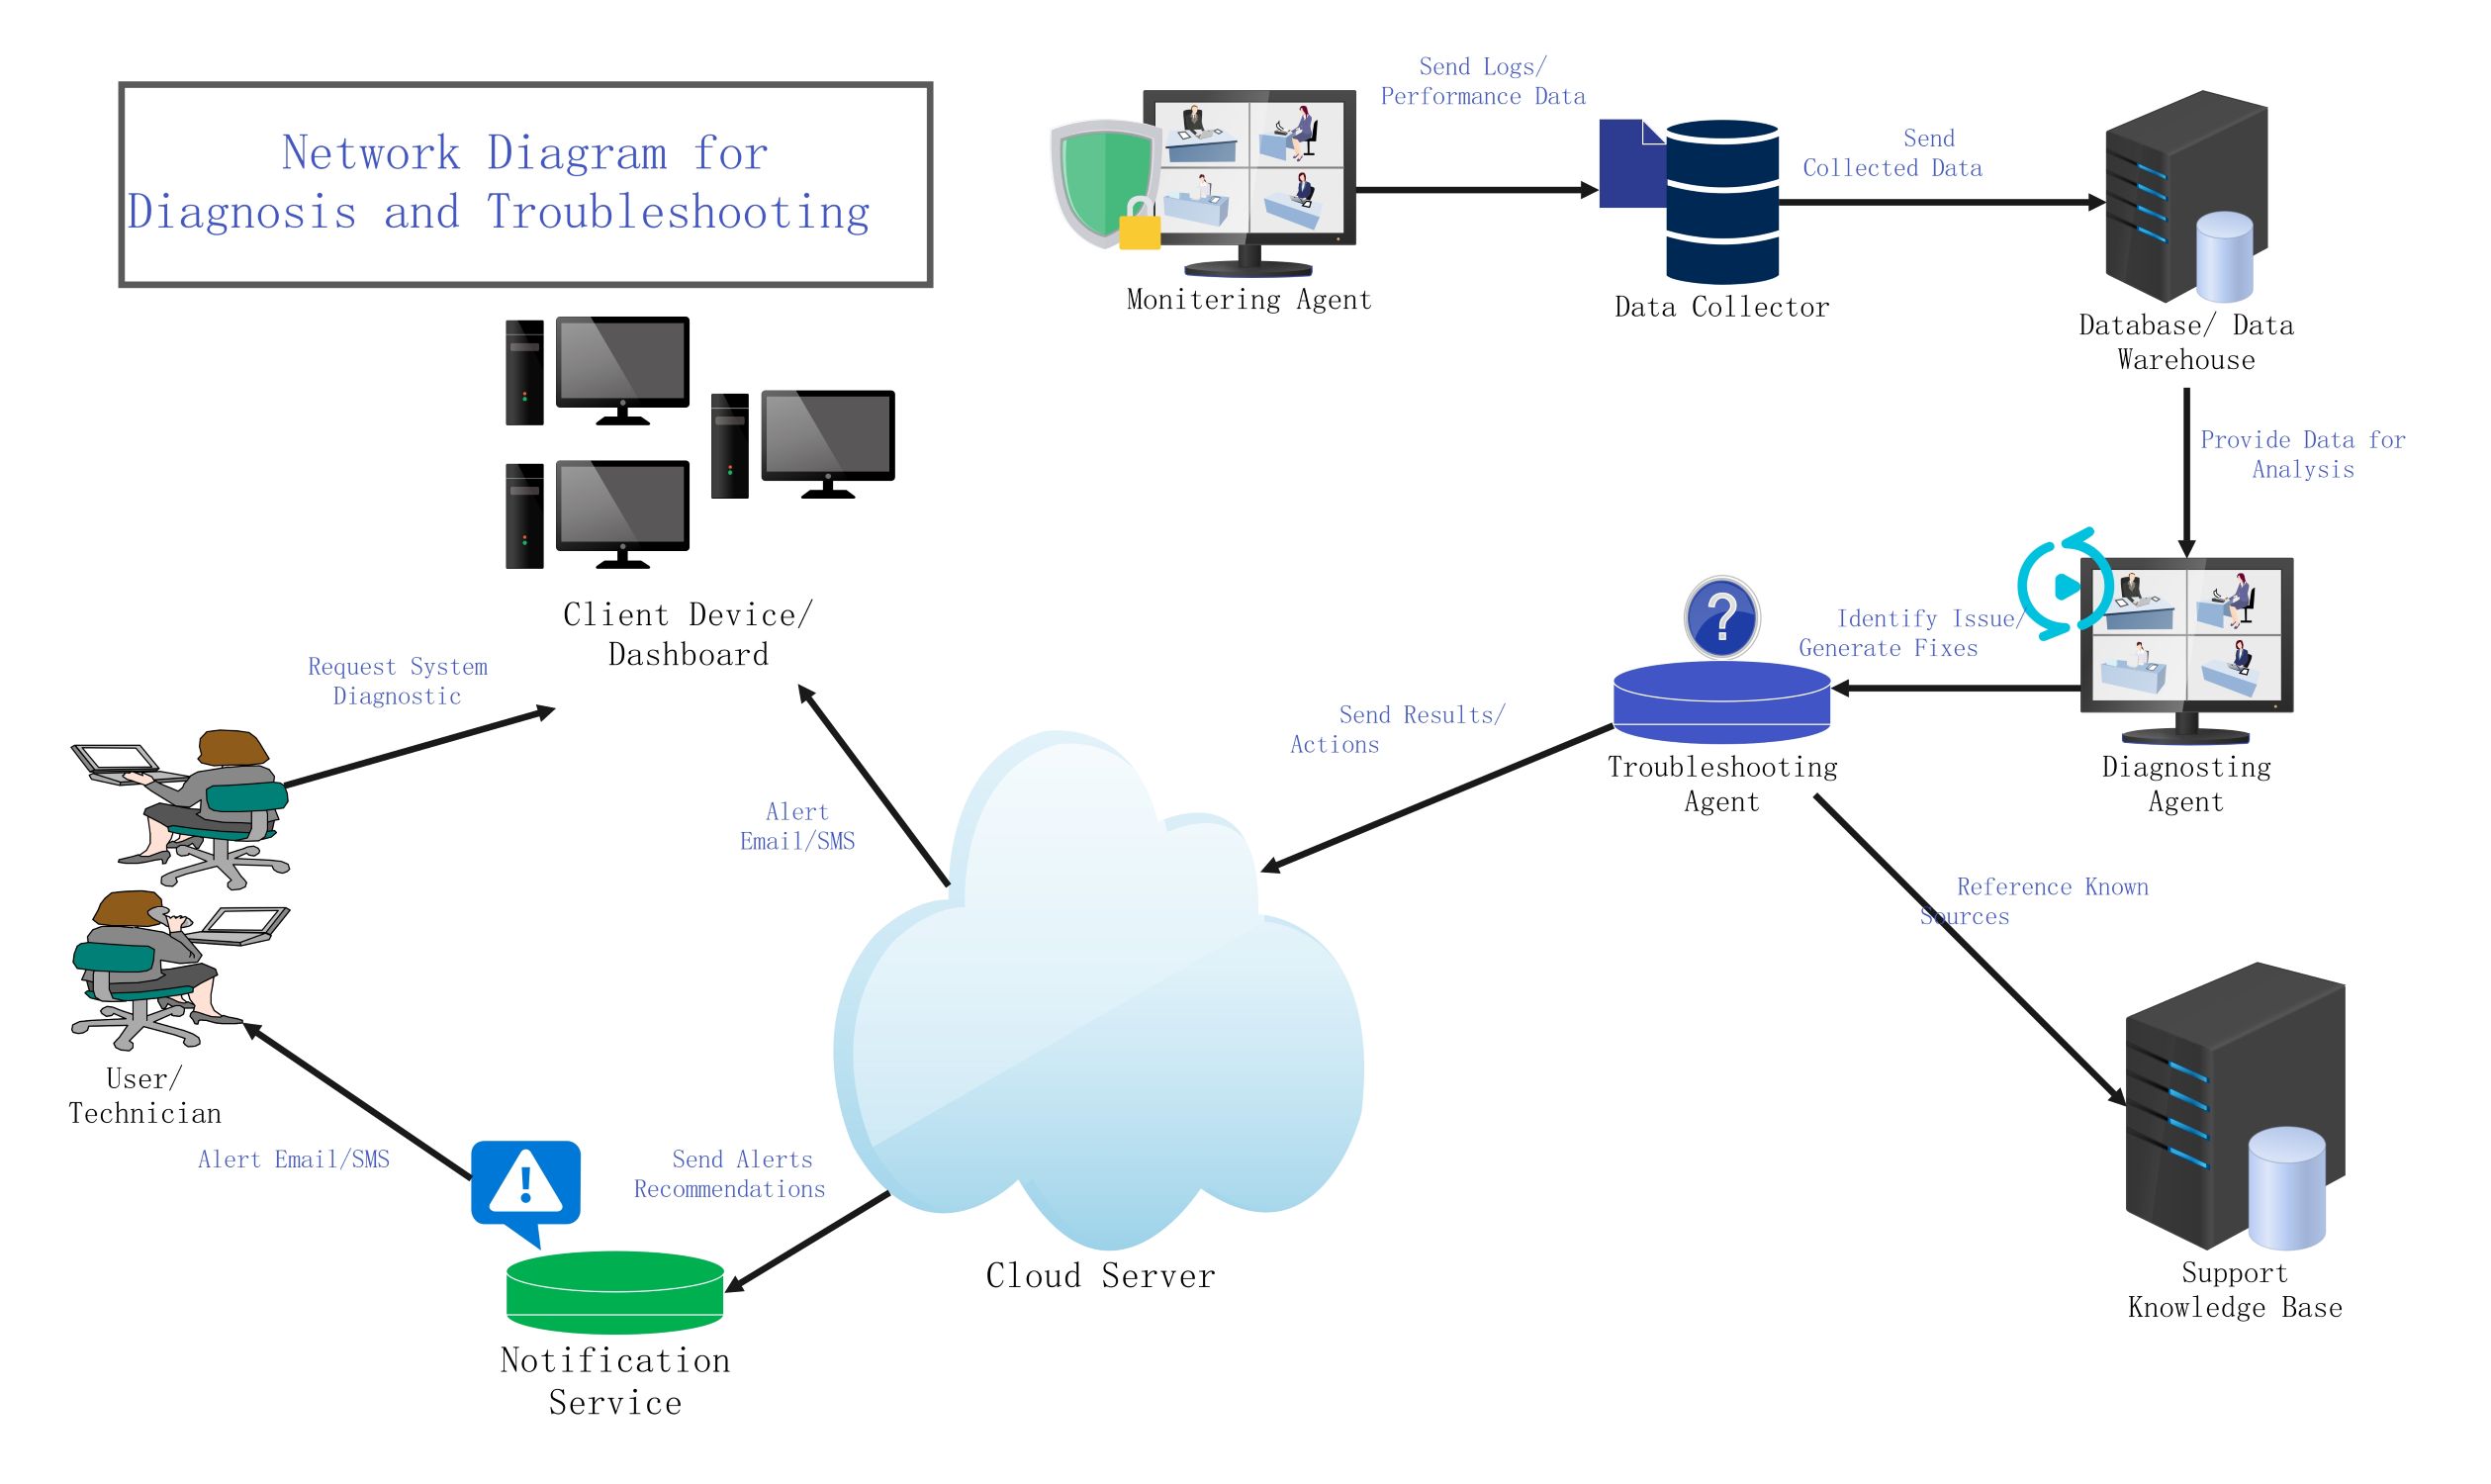
This template provides a clear visual map of a professional troubleshooting workflow. It includes agents, data storage, and notification services. It is perfect for IT teams wanting to optimize their system monitoring and incident response times.
Data Acquisition Phase
This section focuses on gathering raw system data from various sources. The monitoring agent tracks performance and sends logs to the collector. This ensures that every event is recorded for future analysis by technical teams.
- Monitoring Agent
- Data Collector
- Send Logs and Performance Data
Analysis and Storage
Collected data moves into a central warehouse for long-term storage and processing. A diagnosing agent then reviews this data to identify specific issues. This step transforms raw logs into actionable information for the team.
- Database and Data Warehouse
- Diagnosing Agent
- Data for Analysis
Resolution and Knowledge
The troubleshooting agent generates fixes based on the diagnosed issues. It references a support knowledge base to find established solutions. This automated approach helps resolve common problems quickly without manual intervention at every single step.
- Troubleshooting Agent
- Support Knowledge Base
- Identify Issues and Generate Fixes
Communication and User Interface
The cloud server acts as a hub for alerts and results. It pushes notifications to technicians and updates the client dashboard. This ensures that users stay informed about the health and status of their network systems.
- Cloud Server
- Notification Service
- Client Device Dashboard
- Alert Email and SMS
FAQs about this Template
-
Why is a network diagram important for troubleshooting?
A network diagram for diagnosis and troubleshooting provides a clear map of your entire IT infrastructure. It allows technicians to see how data flows between devices and identifies potential points of failure quickly. By visualizing the connections, teams can pinpoint the root cause of an issue. This leads to faster repairs and minimizes downtime for your business operations.
-
What role does the Troubleshooting Agent play?
The Troubleshooting Agent is a critical component that automates the resolution process. It takes analysis from the diagnosing agent and searches the knowledge base for a fix. Once it finds a solution, it executes the necessary actions or sends instructions to the cloud server. This reduces the manual workload for IT staff and speeds up the entire recovery cycle.
-
How does the Notification Service improve uptime?
The Notification Service alerts technicians via email or SMS as soon as a problem is detected. Immediate alerts allow the team to respond to critical errors before they impact the end user. By keeping everyone informed in real-time, the service ensures that troubleshooting begins instantly. This proactive communication is vital for maintaining high system availability and reliable network performance.