About this Network Diagram for Smart Traffic Light template
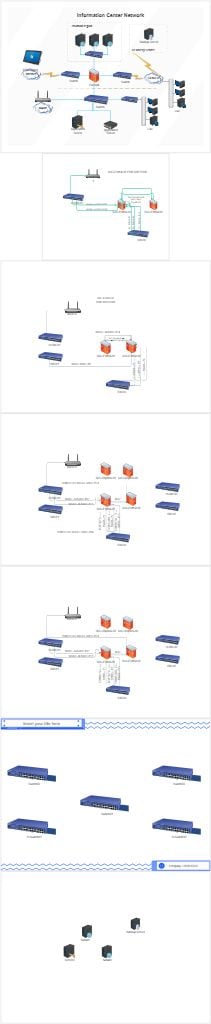
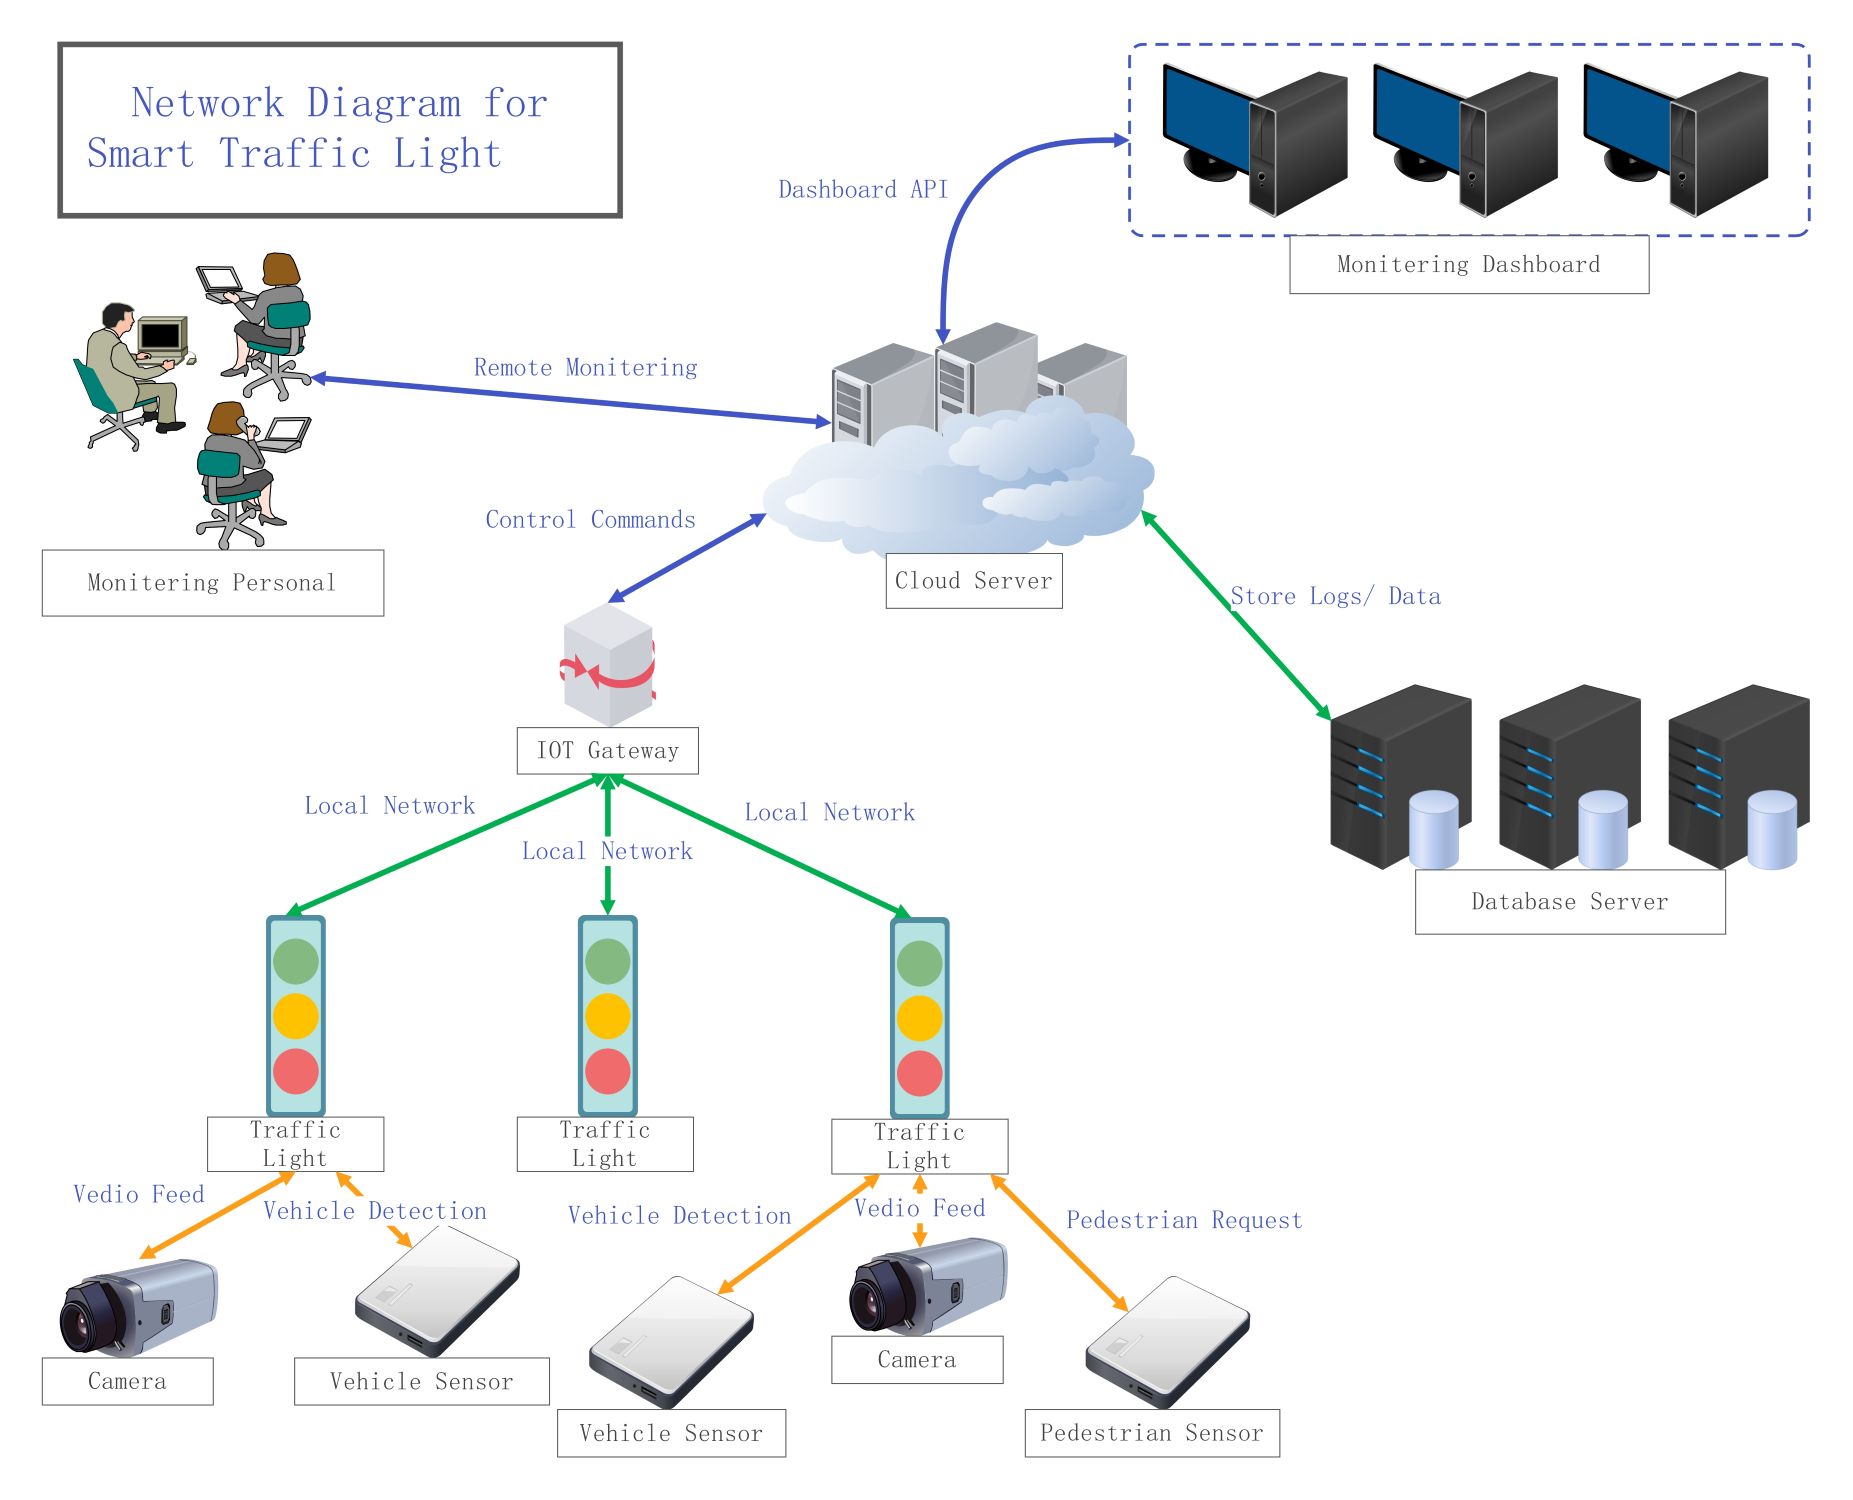
This template provides a clear visual map of a modern traffic management system. It shows the connection between physical road sensors and remote cloud servers for real-time control and monitoring across urban areas.
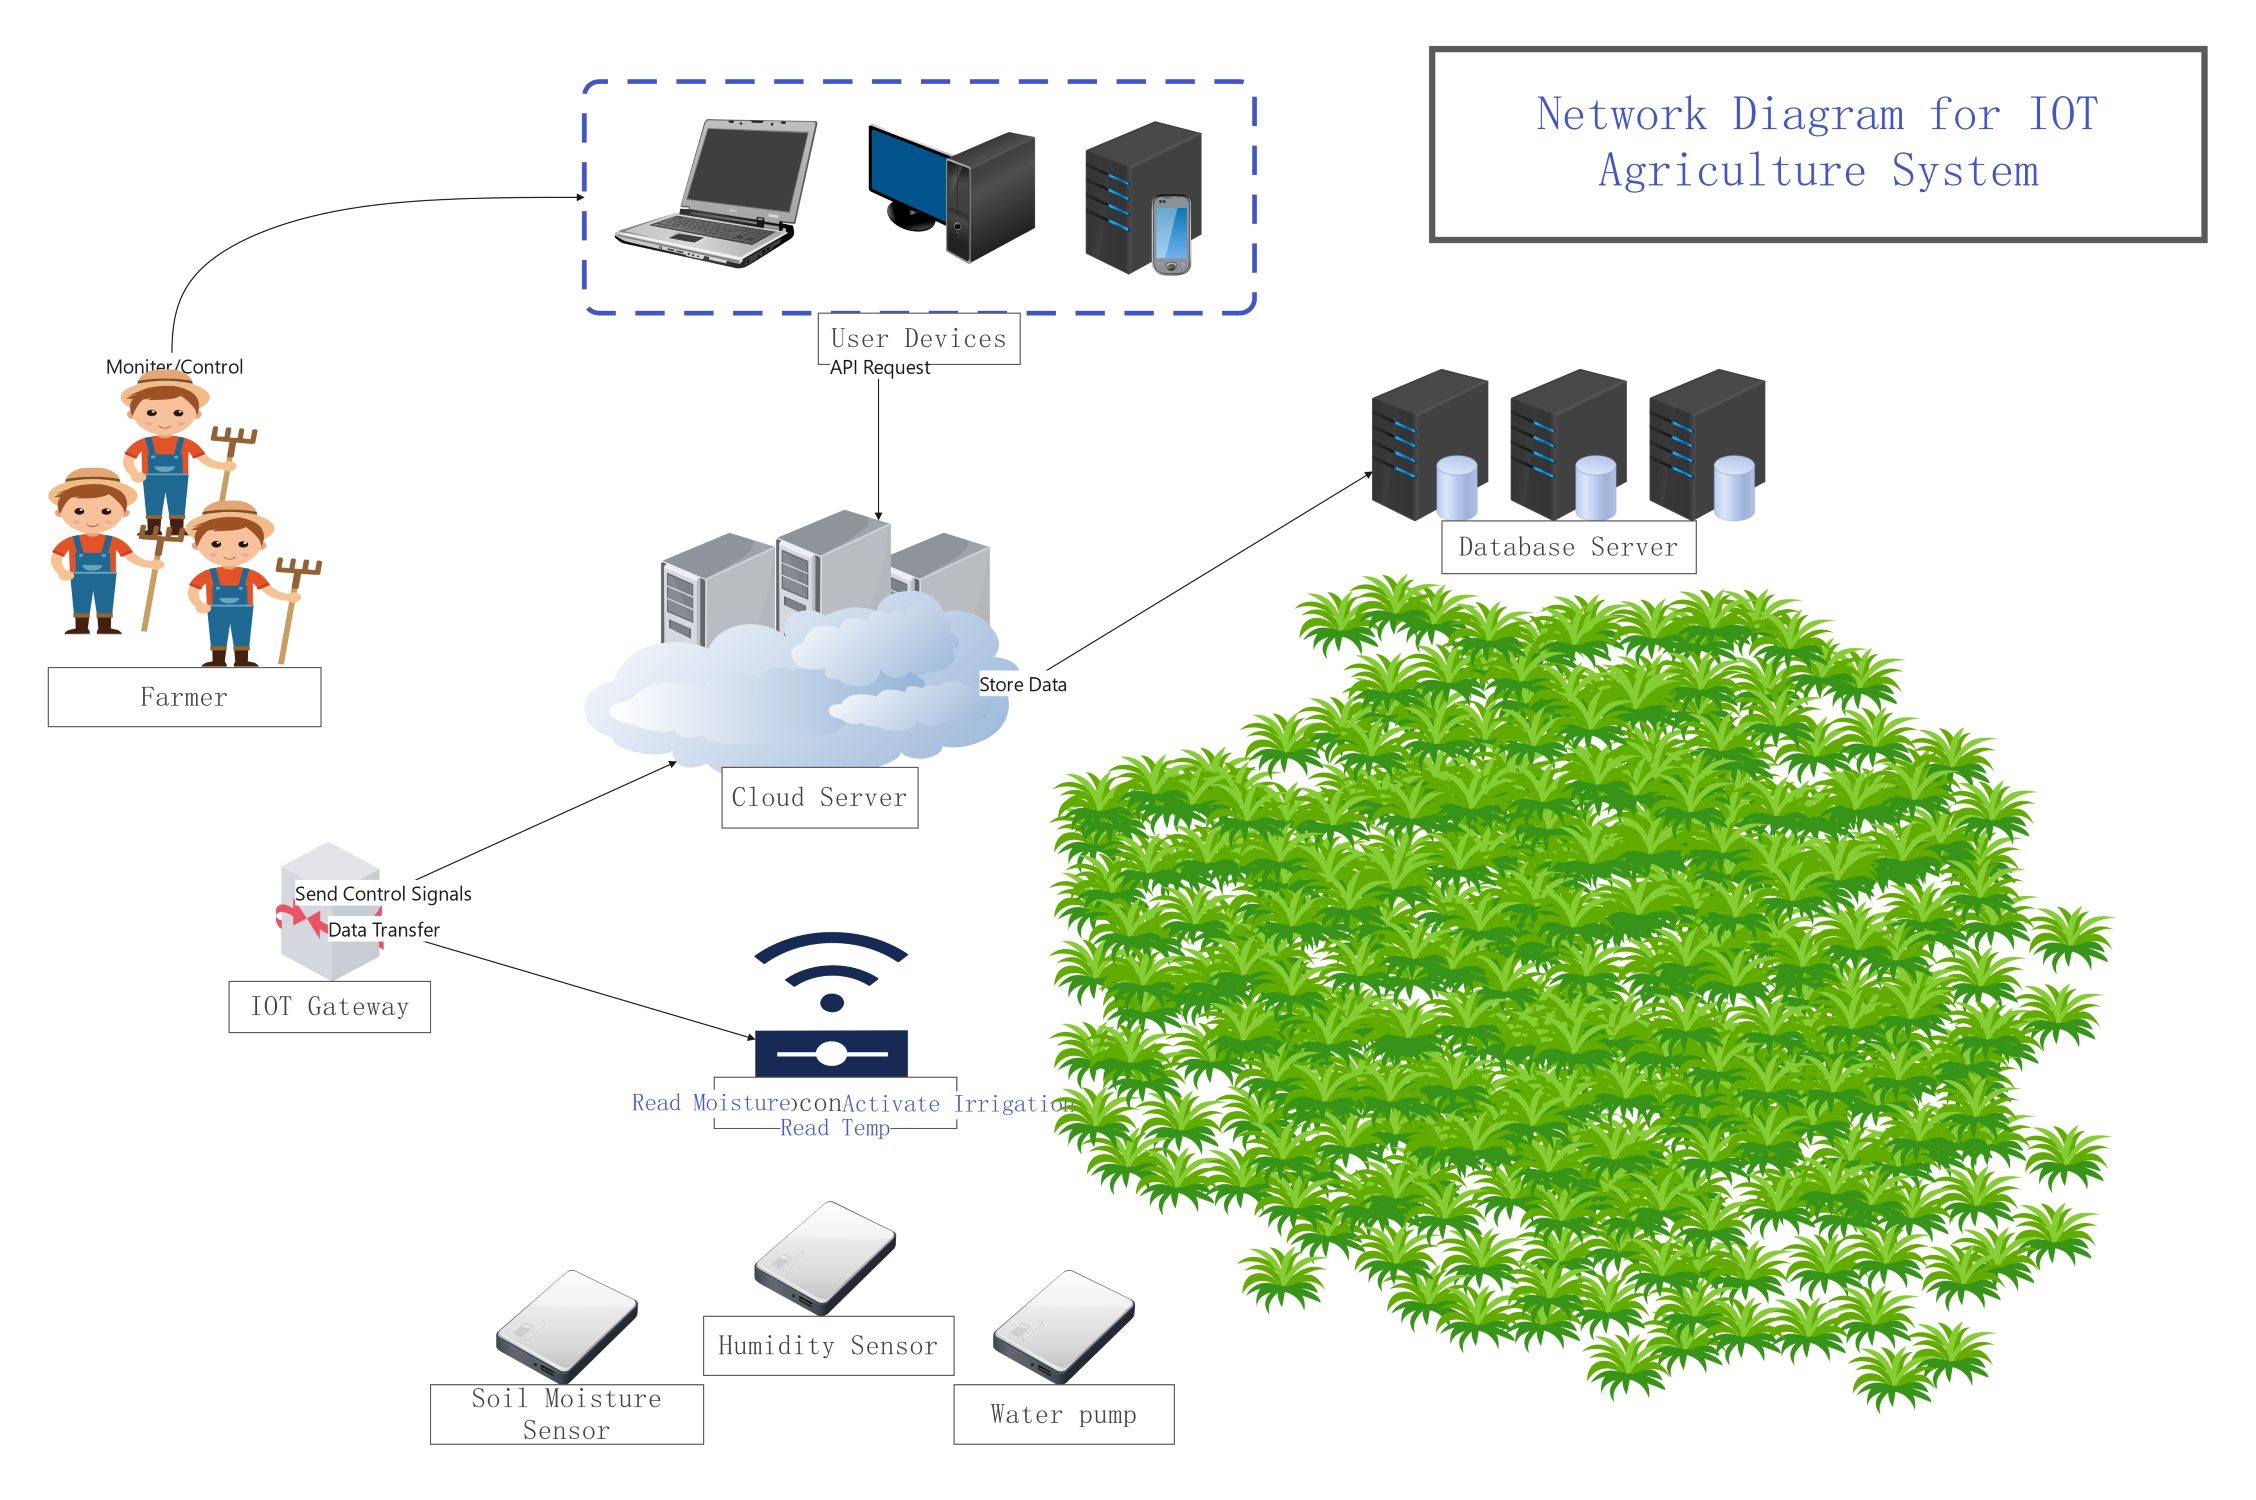
Cloud and Management Hub
The cloud server acts as the central brain of the entire network operation. It receives data from the field and sends commands to local devices while storing logs for future analysis and reporting.
- Cloud Server
- Database Server
- Monitoring Dashboard
- Dashboard API
IOT Gateway and Local Network
The IOT gateway serves as the bridge between the internet and the street hardware. It manages the local network communication to ensure that traffic lights receive instructions without delay for safer road conditions.
- IOT Gateway
- Local Network
- Control Commands
- Remote Monitoring
On-Site Sensors and Hardware
These components collect real-time data from the physical environment to inform the system. Cameras and sensors detect cars or people to adjust light timings dynamically based on the current demand of the intersection.
- Traffic Light
- Camera (Video Feed)
- Vehicle Sensor (Vehicle Detection)
- Pedestrian Sensor (Pedestrian Request)
FAQs about this Template
-
How does a smart traffic light system improve urban mobility?
A smart traffic light system uses real-time data from sensors and cameras to monitor vehicle density. Instead of using fixed timers, the system adjusts light changes based on actual road demand. This reduces unnecessary idling at red lights and prevents traffic congestion. Improved mobility leads to lower fuel consumption and faster travel times for commuters in busy cities.
-
What is the role of an IOT gateway in this network?
The IOT gateway acts as a critical communication link between the cloud server and local traffic hardware. It translates data protocols and ensures that control commands reach the traffic lights securely. By processing some data locally, the gateway reduces the need for constant cloud contact. This helps maintain system stability even if the main internet connection faces temporary issues.
-
Why are database servers essential for traffic management?
Database servers store historical logs and performance data collected from road sensors. Traffic engineers use this information to analyze patterns and plan long-term infrastructure improvements. By reviewing stored data, cities can predict peak traffic hours and optimize light sequences for different times of the day. This data-driven approach ensures that the traffic system evolves with the city's growth.