About this Object Diagram for College Management System template
This template provides a clear visual of a college database. It maps relationships between students, academic departments, and financial records. Use it to build better software or explain system logic to stakeholders quickly and efficiently.
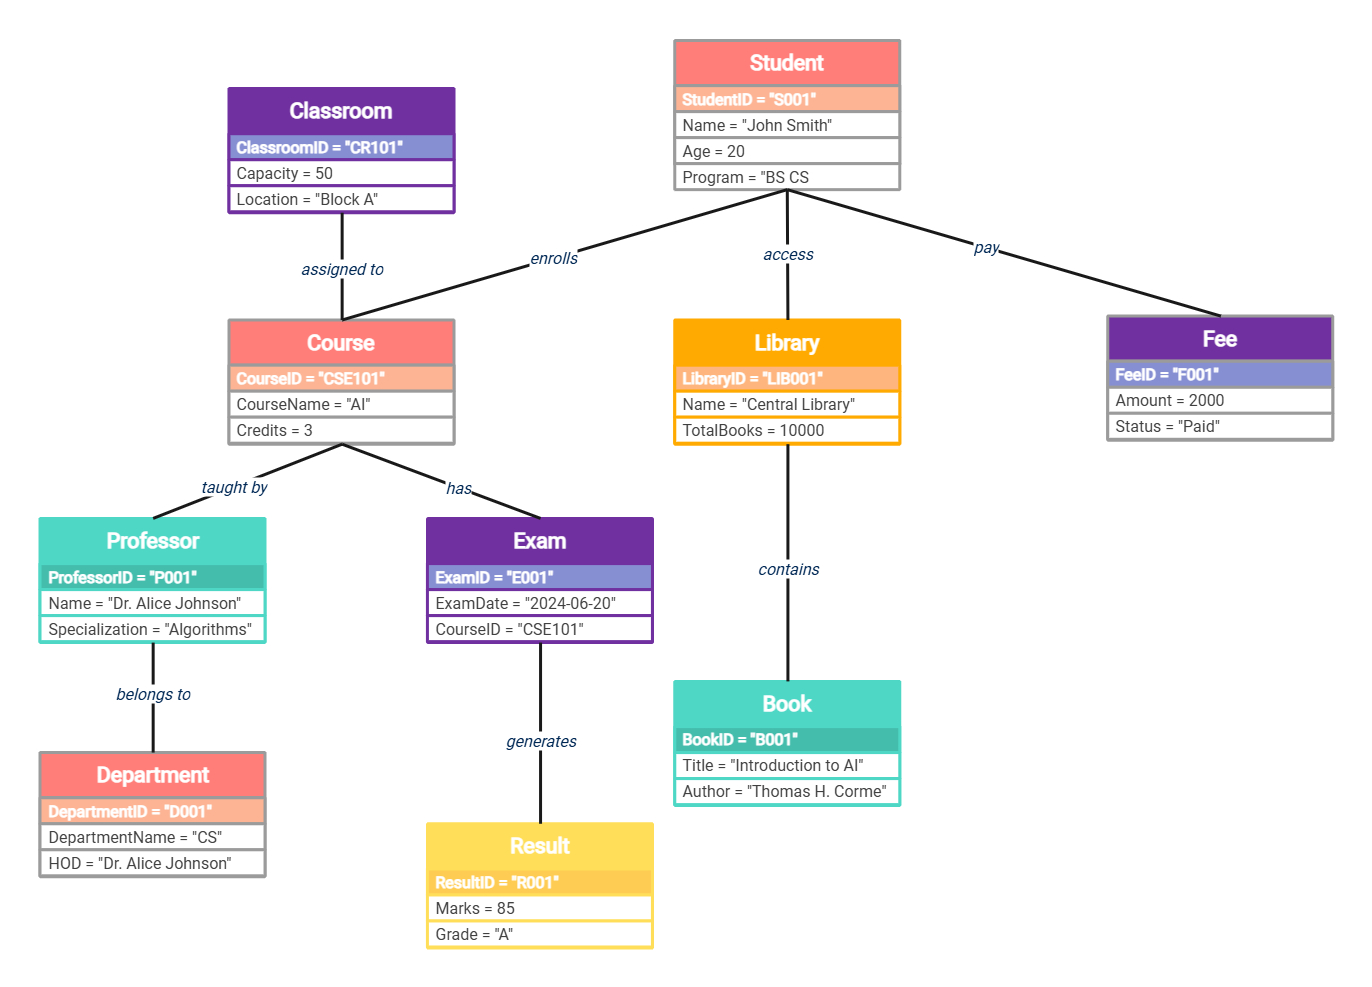
Student Central Hub
The student object represents a single learner in the college. It tracks their personal ID, enrolled program, and age. This node serves as the primary connection for academic activities, financial payments, and resource access.
- Student ID: S001
- Name: John Smith
- Age: 20
- Program: BS CS
Academic Curriculum
The course object defines the specific subject being taught. It links to classrooms for physical scheduling and professors for instruction. This section ensures that every class has a designated space, teacher, and an associated exam.
- Course: AI (CSE101)
- Credits: 3
- Classroom: CR101
- Taught by: Dr. Alice Johnson
Resource Management
This part of the diagram handles physical assets like libraries and books. It shows how students access educational materials. It also tracks the total volume of books available in the central library for student use.
- Library: Central Library
- Total Books: 10000
- Book Title: Introduction to AI
- Author: Thomas H. Corme
Examination and Results
The examination node records the specific date and course ID for tests. Once completed, it generates a result object. This flow allows the system to store student performance data, including numerical marks and final letter grades.
- Exam ID: E001
- Exam Date: 2024-06-20
- Marks: 85
- Grade: A
Administrative Structure
This section outlines the organizational hierarchy of the college. It connects professors to their specific departments and identifies heads of department. It also tracks financial statuses to ensure all student tuition fees are paid on time.
- Department: Computer Science
- HOD: Dr. Alice Johnson
- Fee Amount: 2000
- Payment Status: Paid
FAQs about this Template
-
What is the purpose of an object diagram in a college management system?
An object diagram acts as a snapshot of the college system at a specific moment. It shows how actual data instances, like a specific student or a particular course, relate to one another. This helps software engineers test if the structure can handle real-world scenarios. It ensures that data flows between classrooms, grades, and tuition payments without any errors.
-
How does this diagram differ from a class diagram?
A class diagram describes the general structure and rules of the system, such as what a student should look like. In contrast, an object diagram shows specific examples, like John Smith. It uses concrete values for attributes instead of just naming the fields. This makes it easier to visualize how the system functions when populated with real information for users.
-
Can I customize this college management system template?
Yes, this template is fully customizable to fit your institutional needs. You can add new objects like extracurricular activities or staff payroll to expand the system scope. You can also modify attributes like course credits or fee amounts to match your college policies. Using a visual editor makes it simple to drag and drop elements for better clarity.