About this Object Diagram for College Management System template
This template provides a clear visual of a college database. It maps relationships between students, academic departments, and financial records. Use it to build better software or explain system logic to stakeholders quickly and efficiently.
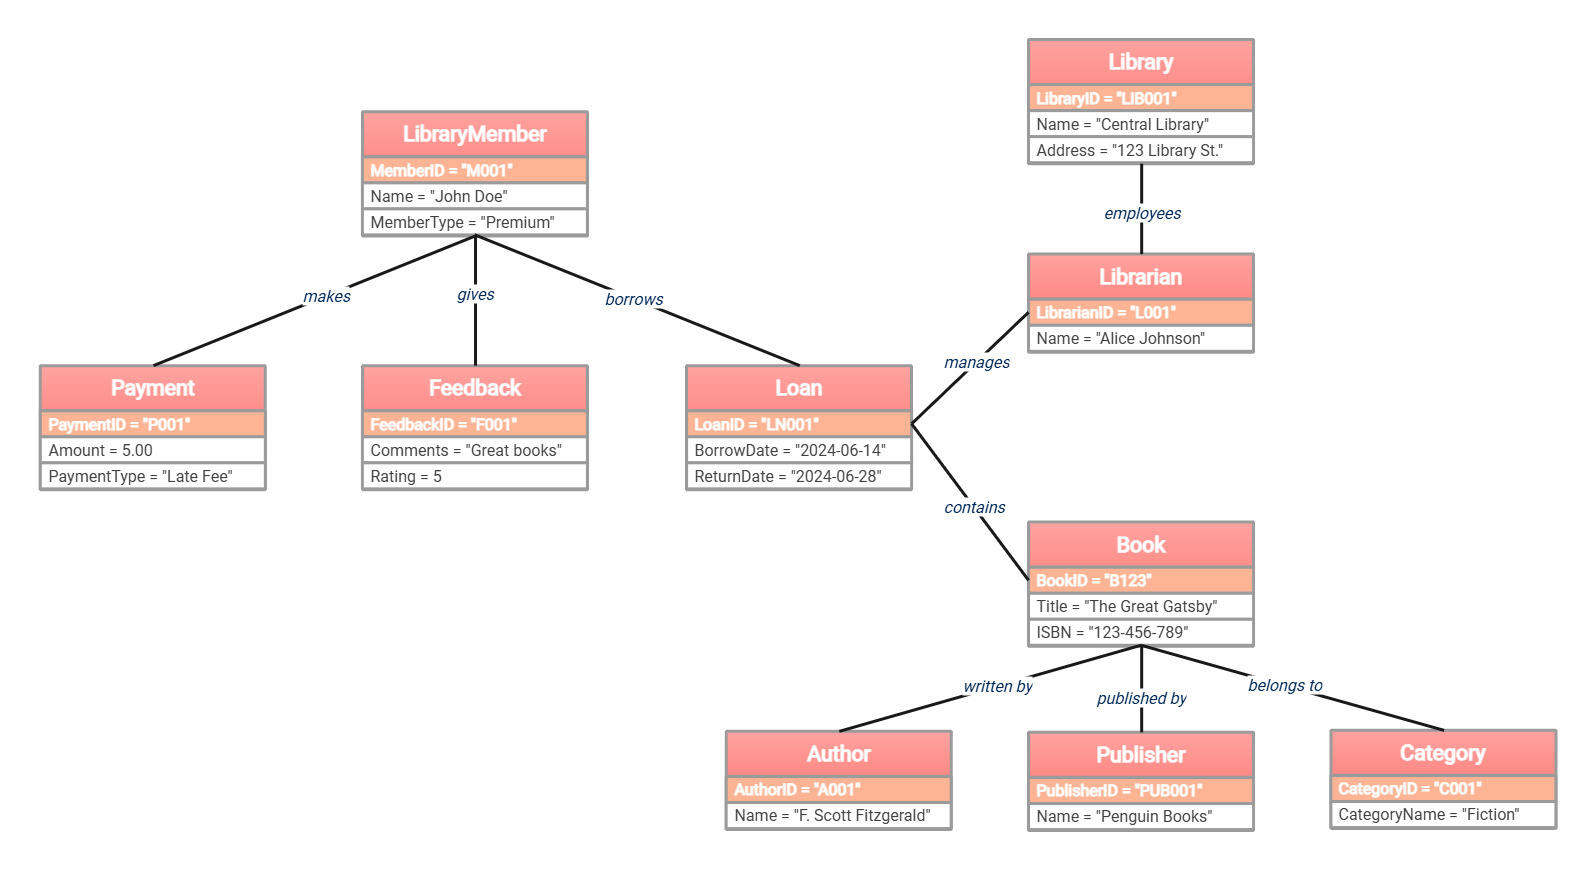
Student Central Hub
The student object represents a single learner in the college. It tracks their personal ID, enrolled program, and age. This node serves as the primary connection for academic activities, financial payments, and resource access.
- Student ID: S001
- Name: John Smith
- Age: 20
- Program: BS CS
Academic Curriculum
The course object defines the specific subject being taught. It links to classrooms for physical scheduling and professors for instruction. This section ensures that every class has a designated space, teacher, and an associated exam.
- Course: AI (CSE101)
- Credits: 3
- Classroom: CR101
- Taught by: Dr. Alice Johnson
Resource Management
This part of the diagram handles physical assets like libraries and books. It shows how students access educational materials. It also tracks the total volume of books available in the central library for student use.
- Library: Central Library
- Total Books: 10000
- Book Title: Introduction to AI
- Author: Thomas H. Corme
Examination and Results
The examination node records the specific date and course ID for tests. Once completed, it generates a result object. This flow allows the system to store student performance data, including numerical marks and final letter grades.
- Exam ID: E001
- Exam Date: 2024-06-20
- Marks: 85
- Grade: A
Administrative Structure
This section outlines the organizational hierarchy of the college. It connects professors to their specific departments and identifies heads of department. It also tracks financial statuses to ensure all student tuition fees are paid on time.
- Department: Computer Science
- HOD: Dr. Alice Johnson
- Fee Amount: 2000
- Payment Status: Paid
FAQs about this Template
-
What is the purpose of an object diagram in a library system?
An object diagram represents a specific instance of the system at one point in time. Unlike a class diagram, which shows general rules, this diagram uses real data examples. It helps developers test if the class structure works for actual library scenarios like tracking a specific book loan or a member payment.
-
How does this diagram help in database design?
This diagram serves as a blueprint for the relationships between database tables. It identifies foreign key requirements, such as linking a book to its author and publisher. By visualizing how data objects connect, designers can create a more organized and efficient database schema that prevents data loss and maintains integrity.
-
Can I add more entities to this library management template?
Yes, you can easily expand this template by adding nodes for digital resources or room bookings. Simply create a new object box and define its attributes and relationships. For example, you might add a DVD object or an Electronic Resource entity to reflect the modern services offered by many contemporary libraries.