About Pi Infographic Template
This pi infographic template explains the meaning of pi and its relationship to circle measurement through a visual, classroom-friendly layout.
What pi represents
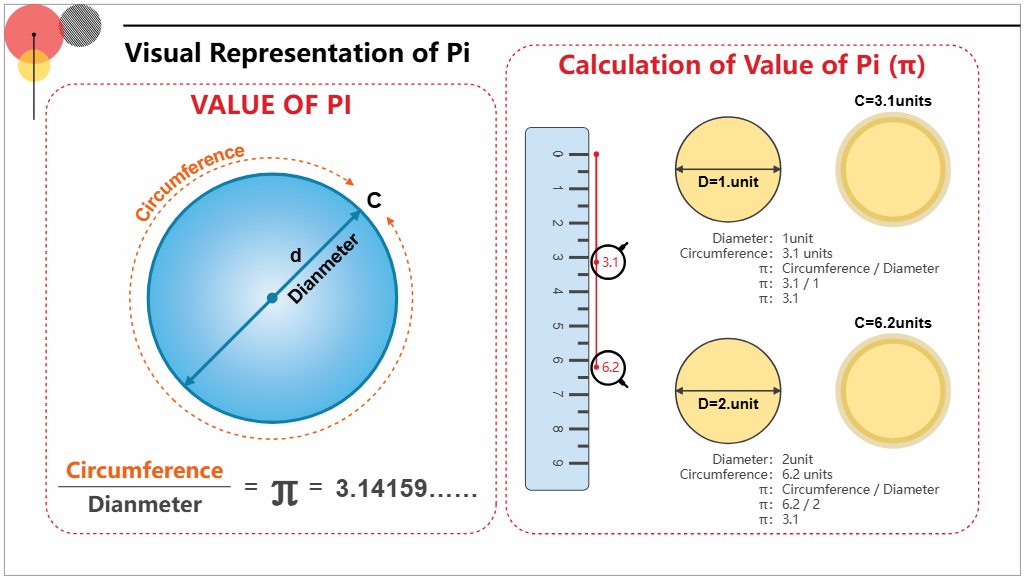
The infographic starts by treating pi as a core math idea rather than just a number. Its layout helps readers connect the symbol with the concept behind circle measurement.
Circle measurement relationship
A central part of the visual focuses on how pi connects circumference, radius, and diameter. This section is the main instructional core of the template.
Classroom and learning use
The overall design is built for teaching. It turns an abstract topic into a structured visual that works well for students, posters, or Pi Day explanation material.
FAQs about this Template
-
What is a pi infographic?
A pi infographic is a structured visual or planning reference used to organize a topic more clearly. It helps readers understand the main idea, relationships, or steps involved without relying only on long-form text explanation.
-
What should a pi infographic include?
A pi infographic should include the most important sections, labels, relationships, or checkpoints needed to explain the topic properly. The right content depends on the use case, but the structure should always improve clarity and make the subject easier to follow.
-
How do you create a pi infographic?
To create a pi infographic, define the purpose first, identify the main sections, and arrange them in a logical order. A good result should make the topic easier to explain, review, or present rather than simply filling space with generic blocks.
-
Why is a pi infographic important?
A pi infographic is important because it improves communication and understanding around a specific subject. A clear structure makes information easier to explain, compare, and apply, especially when the topic includes multiple parts or decision points.