About this Roadmap Infographic template
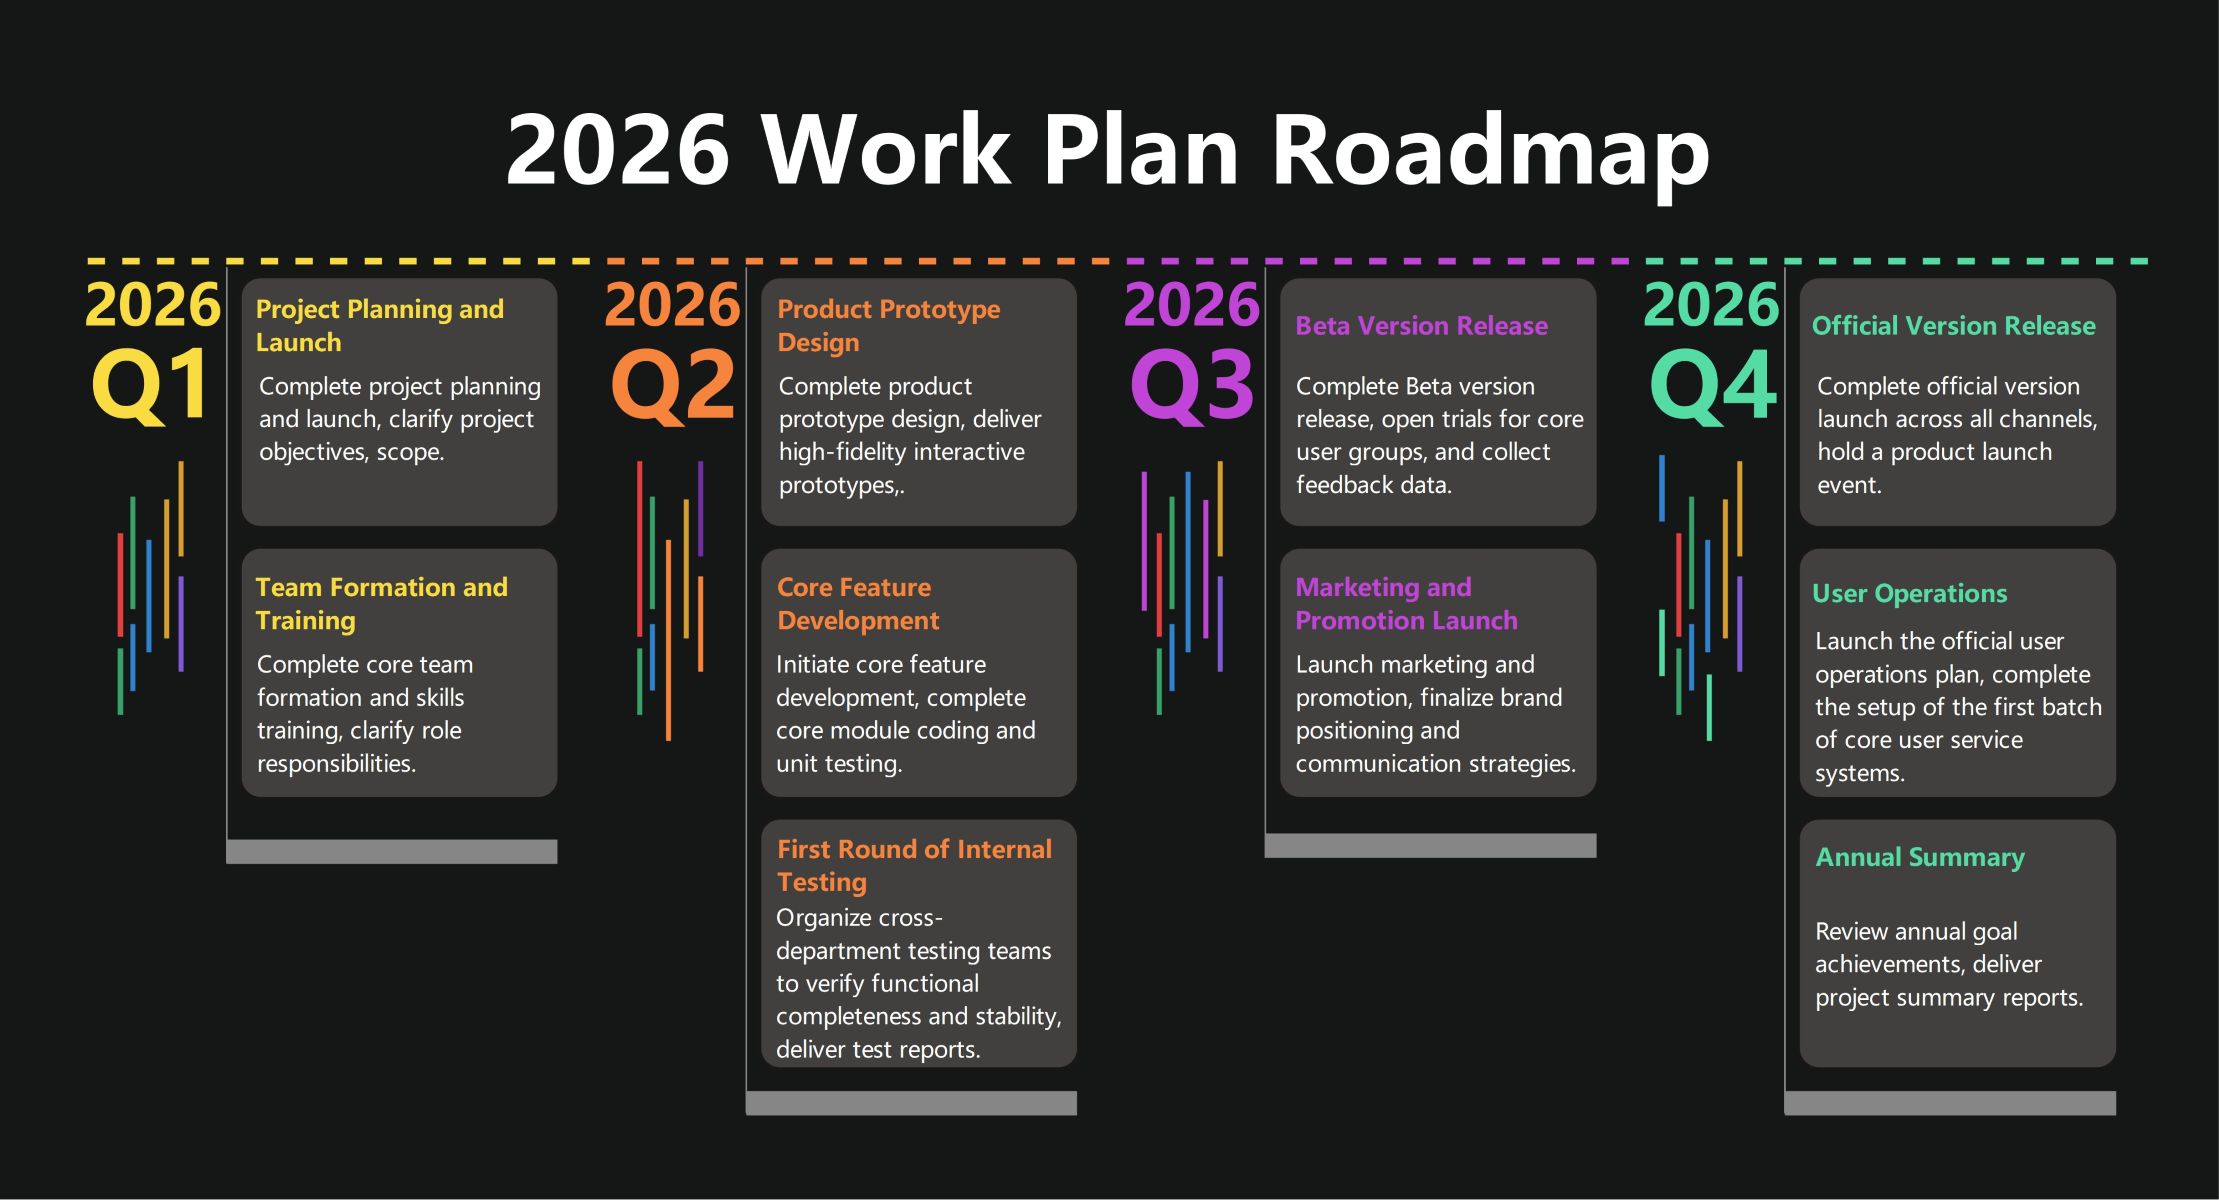
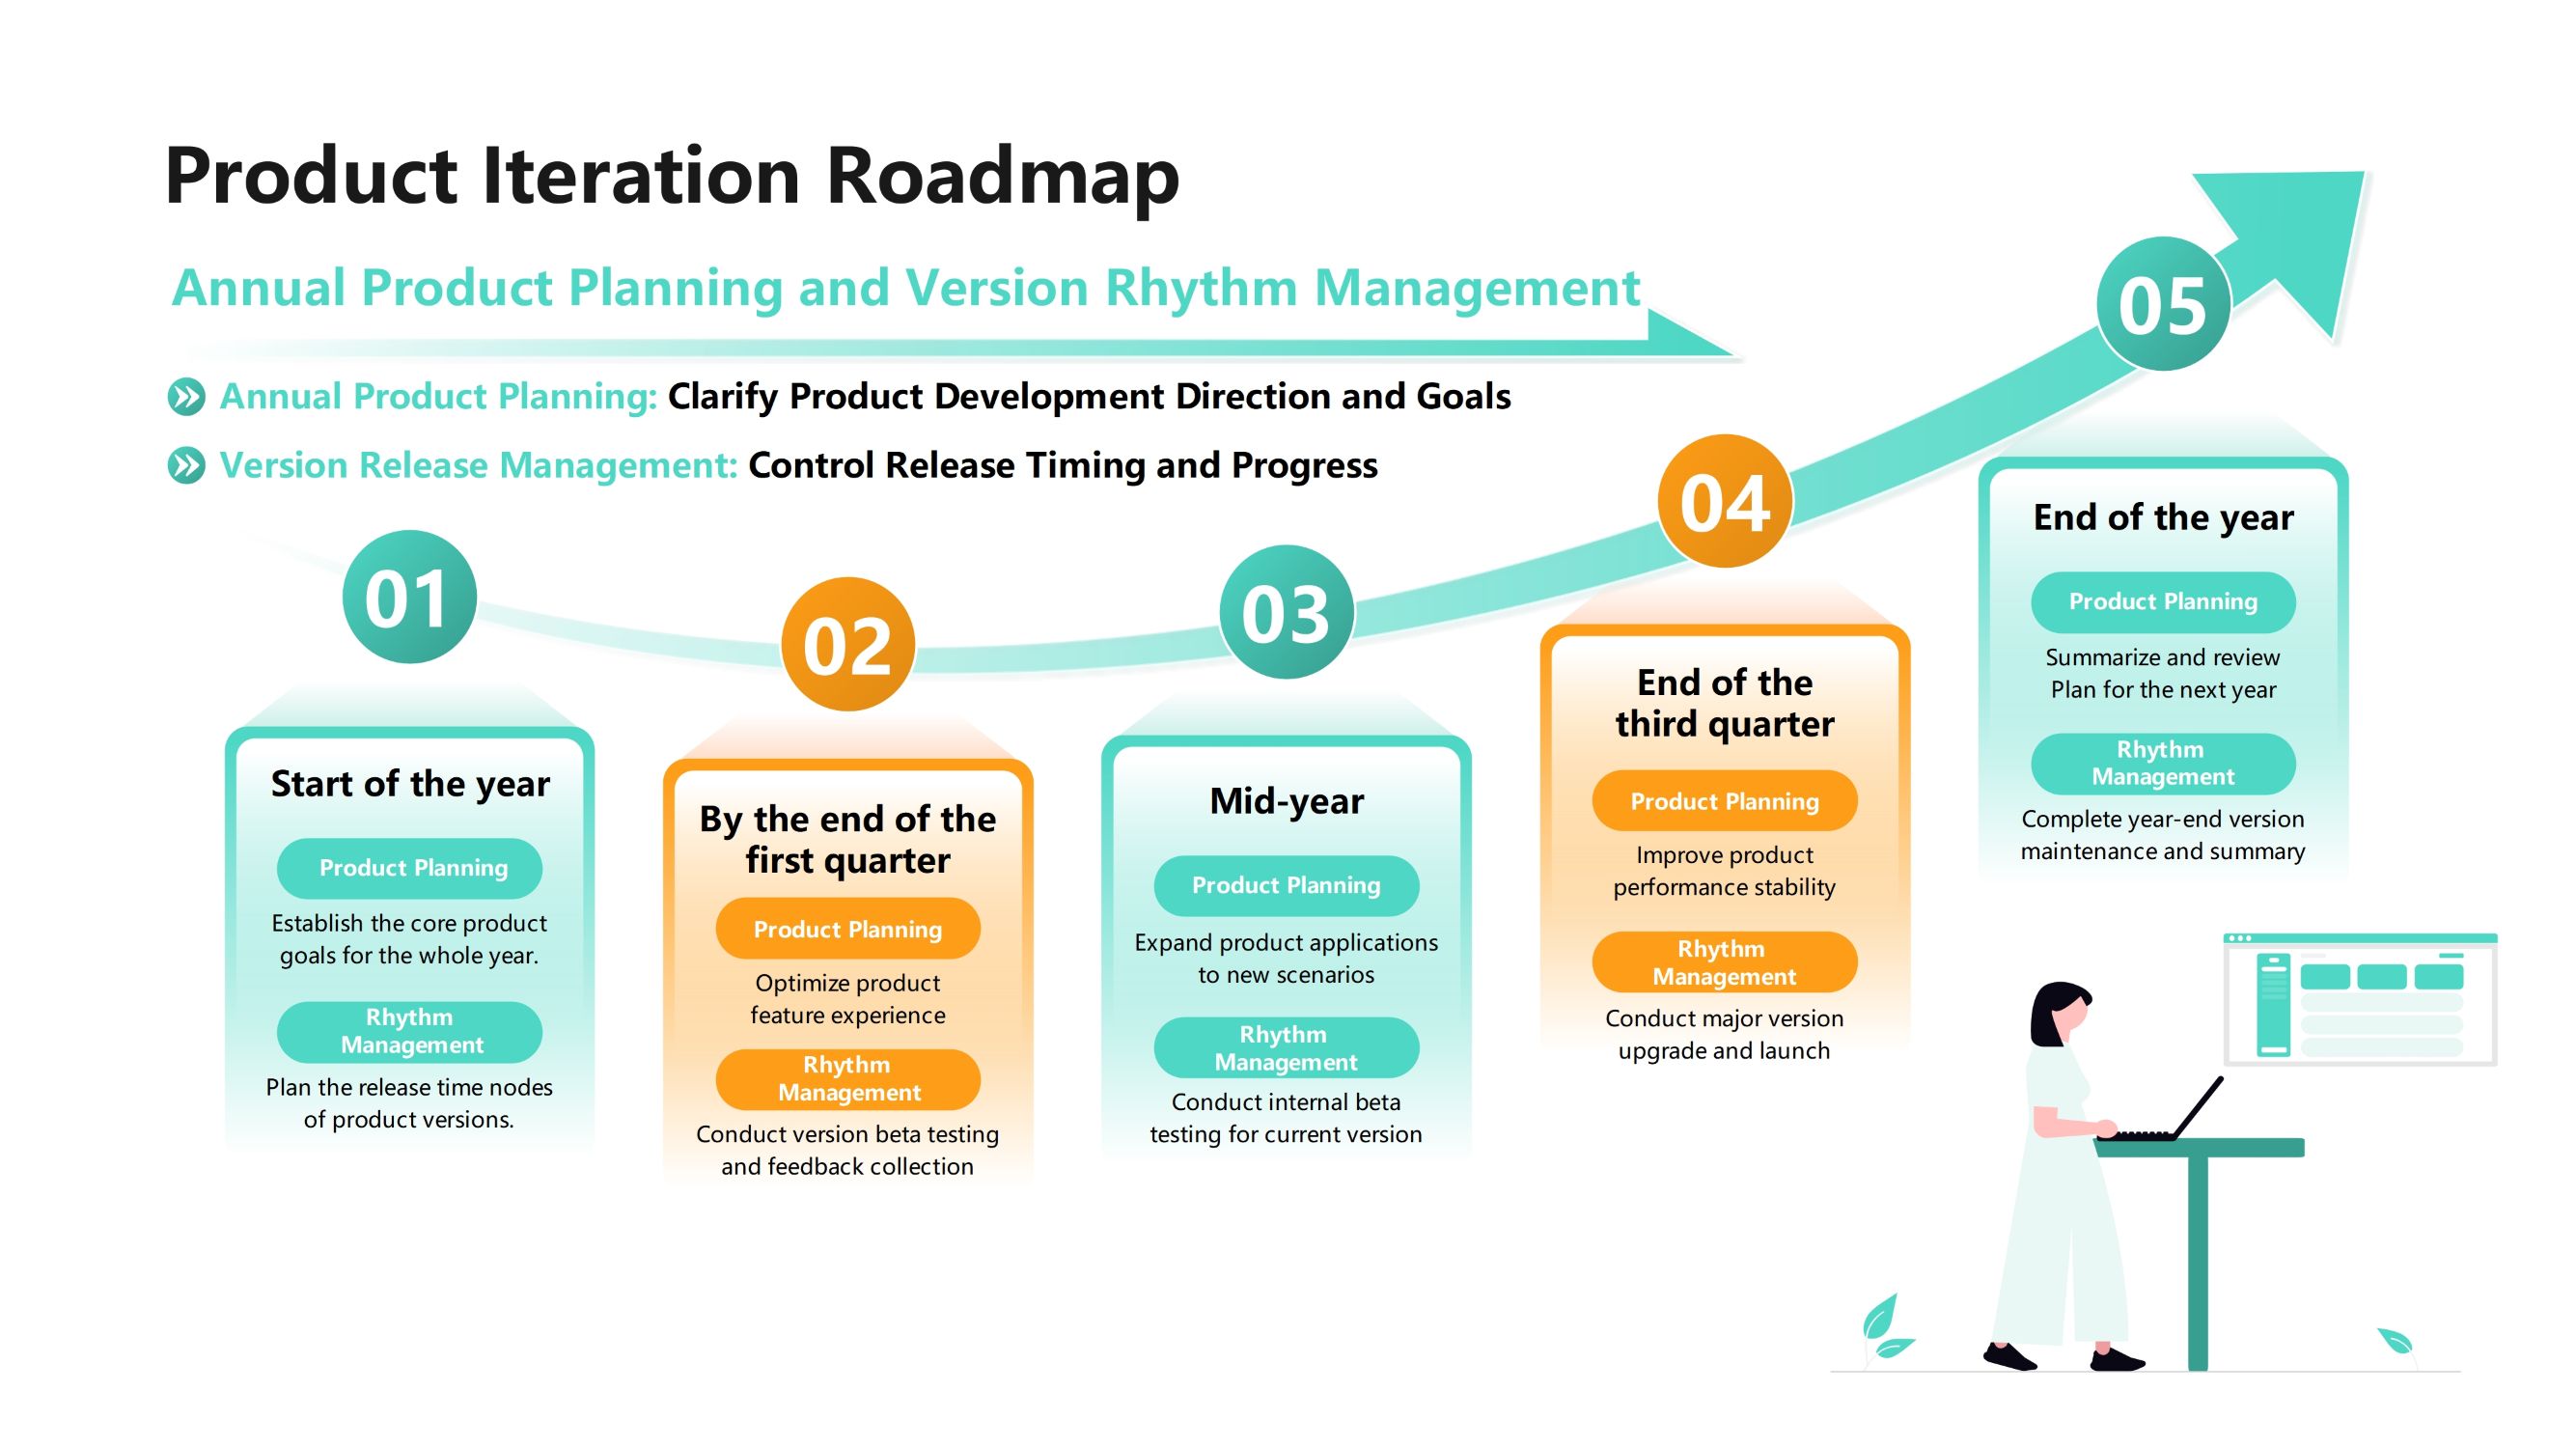
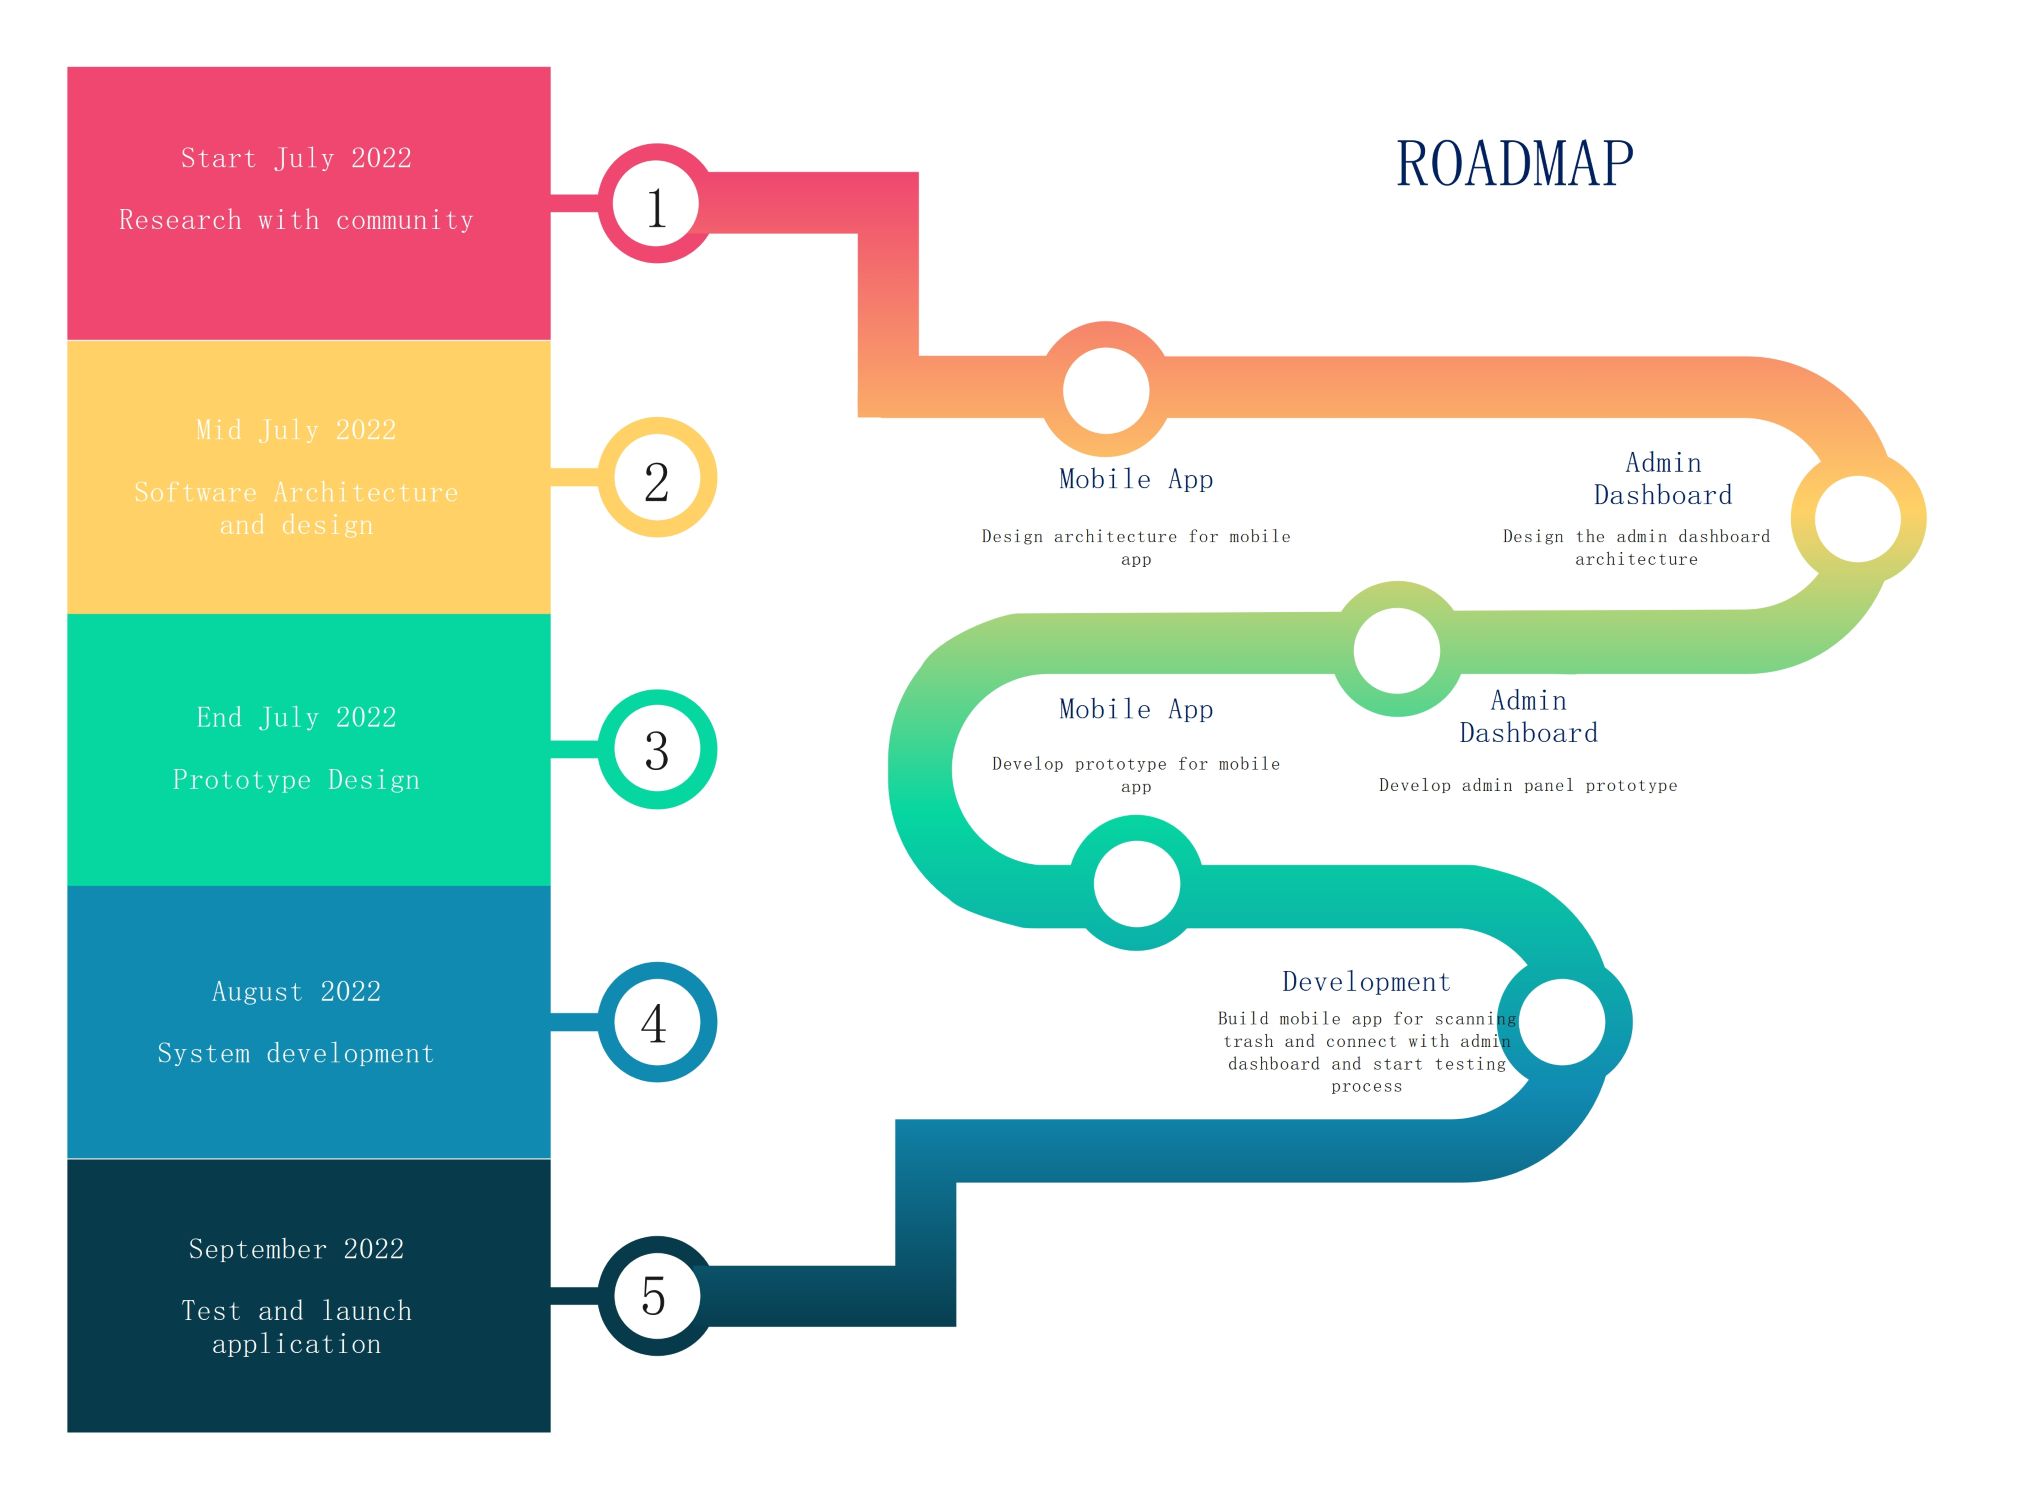
This roadmap infographic template provides a clear visual guide for project management. It maps out a five-stage timeline for software development. The design uses color-coded sections and icons to help users follow the progress of specific tasks and milestones easily.
Research and Community Engagement
The first phase focuses on gathering data and understanding user needs. Starting in early July, this stage involves community research to define the core requirements. It ensures the project starts with a solid foundation based on real feedback.
- Research with community
- Initial project kick-off
Software Architecture and Design
During mid-July, the project moves into the technical design phase. Teams focus on building the structural framework for both the mobile application and the administrative tools. This step bridges the gap between raw ideas and technical implementation.
- Design architecture for mobile app
- Design admin dashboard architecture
Prototype Development Phase
At the end of July, the team builds functional prototypes. These early versions allow designers to test the user interface and basic features. Creating these models helps identify potential usability issues before the heavy coding and development begin.
- Develop prototype for mobile app
- Develop admin panel prototype
Full System Development
August is dedicated to the core building process. Developers write the code for the mobile scanning features and connect them to the dashboard. This phase includes the first rounds of testing to ensure all system components work together correctly.
- Build mobile app for scanning
- Connect with admin dashboard
- Start testing process
Final Testing and Application Launch
The final stage occurs in September. The team performs deep testing to fix bugs and ensure performance stability. Once the application meets all quality standards, it is ready for the official launch to the public or the client.
- Test application performance
- Official software launch
FAQs about this Template
-
How can a roadmap infographic improve project transparency?
A roadmap infographic acts as a shared visual map for every team member. It clearly displays key milestones, deadlines, and dependencies in one view. This prevents confusion regarding project status or individual responsibilities. By sharing this graphic, stakeholders can see exactly where resources are allocated. This level of openness builds trust and ensures everyone works toward the same strategic goals.
-
What are the essential elements of an effective project roadmap?
An effective roadmap must include a clear timeline with specific dates or quarters. It needs distinct phases or categories to group related tasks together. Use visual cues like color-coding or icons to differentiate between work streams. Additionally, include high-level descriptions of each milestone to provide context. Finally, ensure the design is clean so users can grasp the entire plan at a glance.
-
Why should teams use a roadmap template instead of a simple list?
Lists often fail to show the relationship between different project phases. A roadmap template provides a spatial layout that illustrates how tasks overlap or follow one another. This visual approach makes it much easier to identify potential bottlenecks early. Visual learners can process complex schedules faster through graphics than through dense text. Templates also save time by providing a professional structure for presentations.