


Have you ever faced problems at work or wondered why certain things happen in history or science? It can be puzzling to figure out the reasons behind these issues. But don't worry; a helpful method called a cause and effect analysis can make things more straightforward for you.
This tool shows how different things are connected, like the causes and effects of a problem. It's not just for work. You can also use it to understand history and science. And the best part is that online tools can guide you in making these diagrams. This article will explore how cause and effect diagrams can help you make analysis. It will also introduce a great online tool to get you started.
Part 1. What Is a Cause and Effect Diagram?
The most common cause-and-effect diagram is the fishbone diagram or the Ishikawa diagram. It is a simple and powerful tool to understand the reasons for a problem or outcome. The diagram gets its name from its appearance. It looks like a fish skeleton, with the main issue or effect being the "head." The contributing factors form the "bones."
To create a traditional cause-and-effect diagram, you start with a horizontal line. That line represents the main problem or outcome. Then, draw lines branching off from it like the bones of a fish. These branches represent the major reasons that could be causing the problem. For example, say that you are trying to figure out why a project at work is delayed. The branches might include equipment, processes, people, and materials.
Within each category branch, you add more lines representing the specific factors. Continuing with the earlier example, under the "people" category, you might list factors like lack of training, communication issues, or staffing problems.

 below.
  below.
There is also a simple cause-and-effect diagram that uses columns to identify the potential causes and effects. In this format, you have two columns, one for listing the possible reasons and the other for noting the corresponding results.
The "causes" column might include items like "lack of training," "communication issues," and "staffing problems." The "effects" column would list the consequences of these causes, such as "project delays" and "inefficient processes."

Advantages and Disadvantages of Cause and Effect Diagrams
Cause and effect diagrams offer several benefits that make them valuable problem-solving tools.
- They visually represent complex relationships. This makes it easier to see how various factors are connected to the main problem.
- These diagrams encourage people to work together. They are made to share insights and knowledge. Having people from different departments or expertise work on the same problem will enrich the chart with information.
However, cause and effect diagrams also have some limitations.
- They do not provide quantitative data. The relationships between factors may sometimes be complicated. In these cases, a cause-and-effect chart may not be suitable.
- Also, creating the chart can be time-consuming, especially when dealing with harder issues.
Use Cases for Cause and Effect Diagrams
Here are several cases which cause and effect diagrams may be used for:
Conflict Resolution at Work
Cause and effect diagrams can be instrumental in resolving conflicts within a workplace. Creating a cause-and-effect chart allows everyone to see the root causes and contributing factors when an ongoing issue or dispute occurs. That fosters understanding and empathy. By identifying these factors, teams can work together to address the natural sources of the problem.
Historical Studies
In historical studies, cause and effect diagrams are handy tools for understanding the factors that led to significant historical events or changes. For example, say you study a historical event like the Industrial Revolution. You can use the diagram to analyze the factors that triggered this pivotal period. It should include technological advancements, economic shifts, and social changes.
Scientific Studies
In scientific studies, cause and effect diagrams help researchers and students understand relationships between variables. For instance, in environmental studies, a cause-and-effect diagram can be used to analyze the factors contributing to climate change. These may include deforestation, greenhouse gas emissions, and industrial practices. This tool aids in identifying potential solutions and informing policy decisions.
Coaching/Training
Cause and effect diagrams can benefit coaching and training settings. When faced with performance issues, coaches and trainers can collaborate with the individual to create one. It should pinpoint the underlying factors affecting their performance. This process allows for targeted skill development and support, improving outcomes.
Cause and effect diagrams are powerful tools that help understand problems. Visualizing these relationships gives us valuable insights that can lead to effective problem-solving and decision-making. It can help resolve conflicts at work and study historical events. These charts can also analyze scientific data or enhance coaching and training.
Part 2. Wondershare EdrawMax: Empowering You To Create Cause and Effect Diagrams With Ease
If you're looking for a user-friendly and efficient tool to create cause and effect diagrams, Wondershare EdrawMax is an excellent choice. Here are the reasons prove why EdrawMax is a perfect tool for making cause and effect diagrams:
- Whether you are a seasoned professional or new to diagramming, EdrawMax's intuitive interface and powerful features make it easy for anyone to create visually appealing cause-and-effect diagrams.
- It offers a free version so that you can get started without cost. The free version provides access to many of its features, including creating cause and effect diagrams. Before committing to a paid version, try it out and see if it suits your needs.
- Another standout feature of EdrawMax is its extensive template library. The platform has a diverse collection of pre-designed templates. It offers various styles of cause and effect diagrams. These templates serve as a great starting point. This will save you time and effort in creating your diagrams from scratch.
Create Cause-and-Effect Diagrams in EdrawMax within Minutes
With EdrawMax, creating cause-and-effect diagrams is a breeze. Easily get started with one of its massive templates. Here are the steps to follow:
Step1
Download and install EdrawMax
Step2
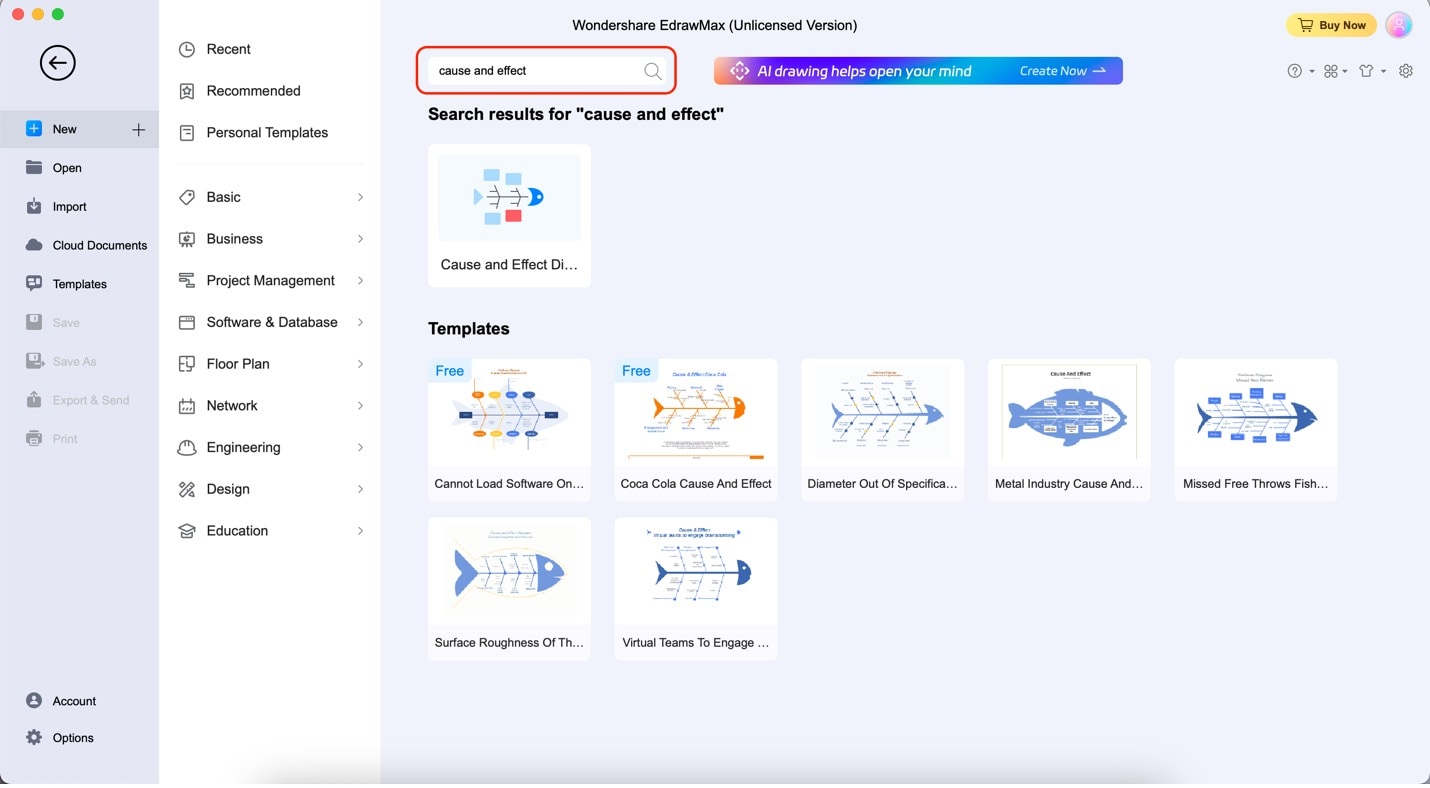
Search for a "cause and effect" template through the search bar on the homepage. Choose one which suits your needs under Templates.
Step3
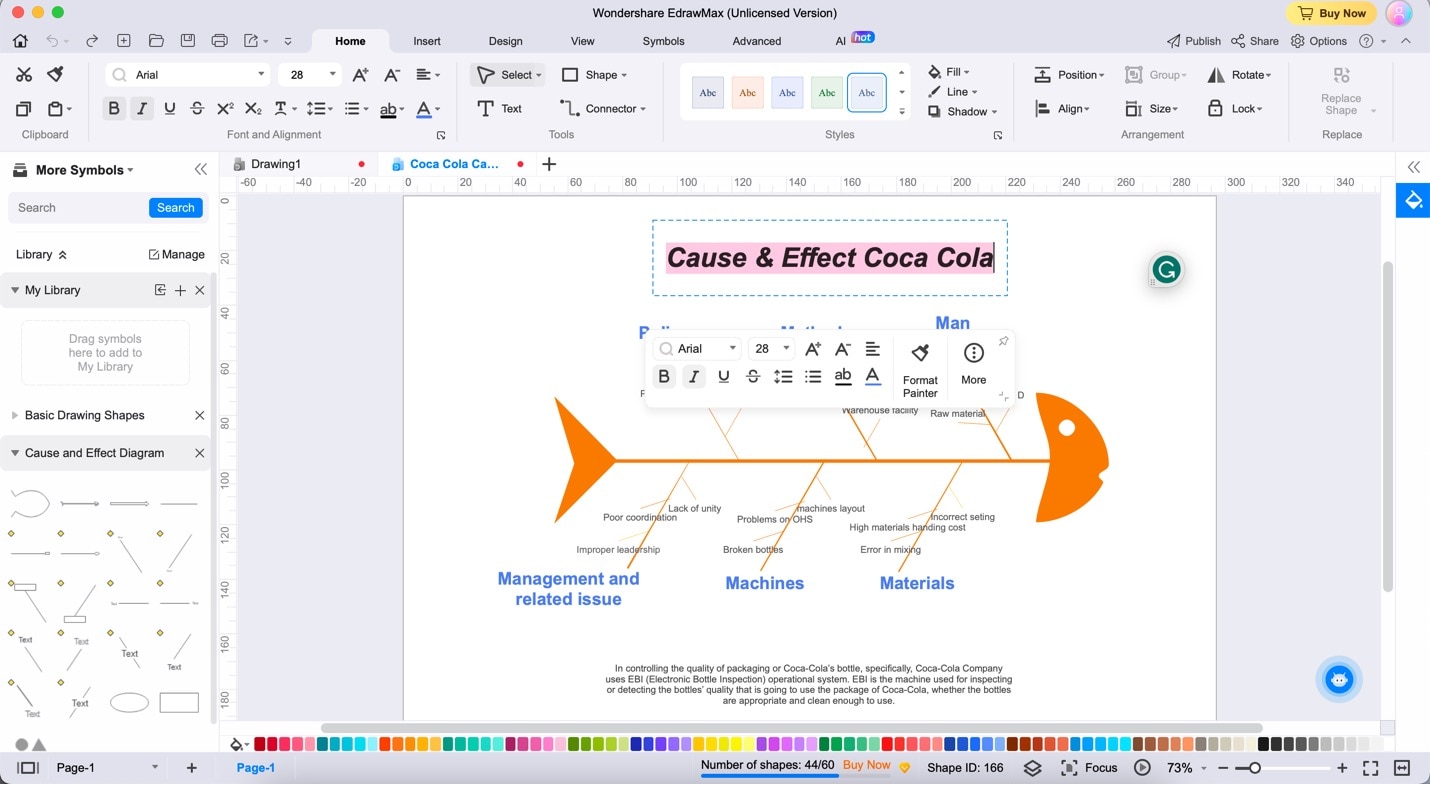
Double-click the texts to edit them. Change the content according to your needs.
Step4
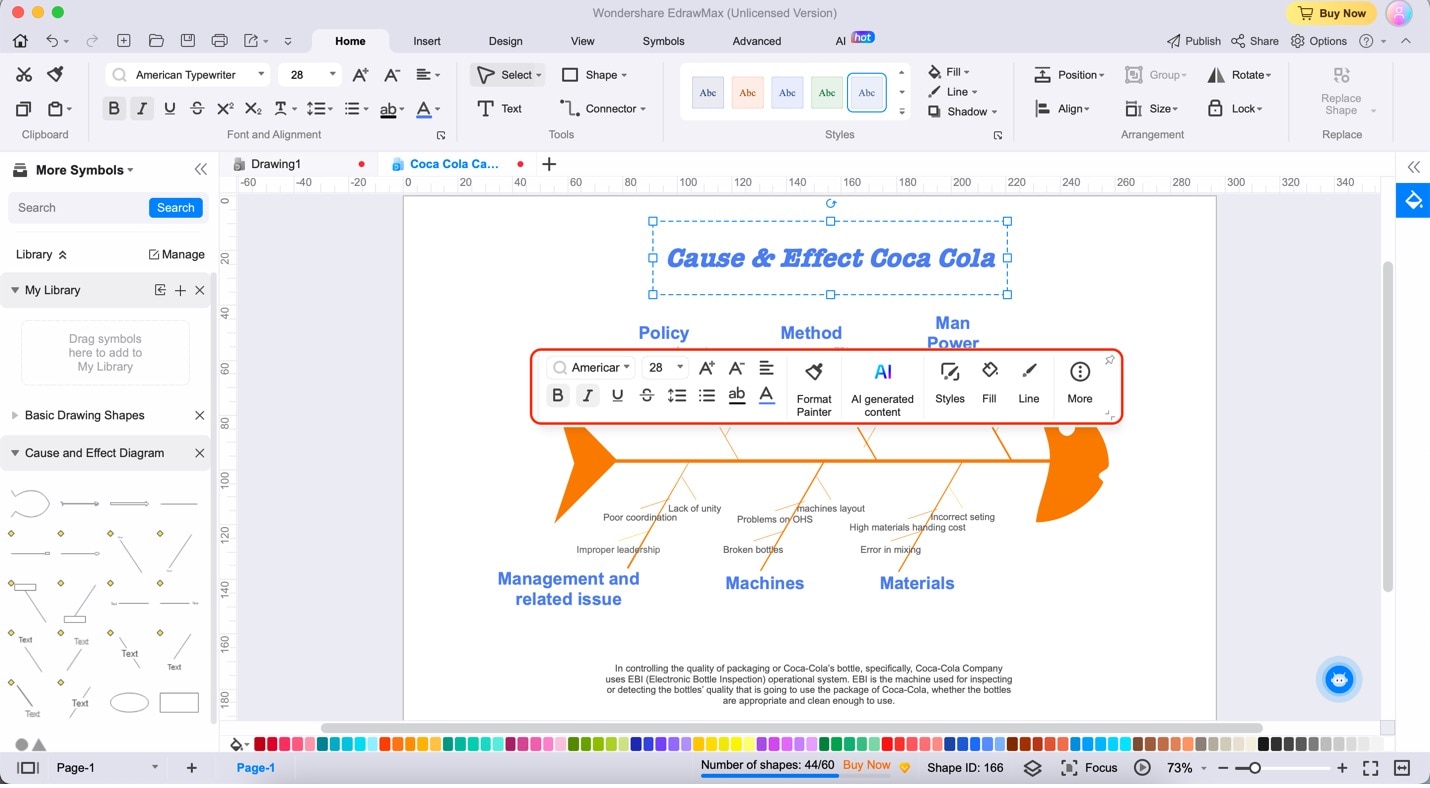
Start customizing the diagram's appearance by clicking any element. Use the appearing customization bar. You can change any element's font, style, and line colors.
Step5
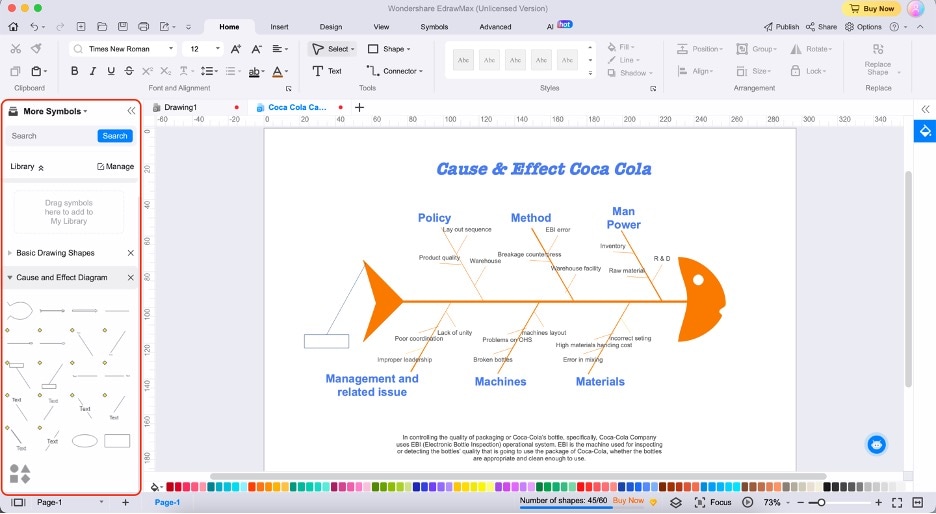
Add more elements to the diagram using the options on the left toolbar. You can drag and drop these elements.
Conclusion
In conclusion, cause-and-effect diagrams are super helpful for understanding why things happen. Whether at work, in history, science, or training, these diagrams show the connections between different factors that lead to problems or outcomes.
To create these diagrams easily, Wondershare EdrawMax is the perfect choice. It has a free version and many ready-made templates, so you don't need to start from scratch. You can quickly make excellent cause-and-effect analysis with EdrawMax. So, use EdrawMax for all your diagramming needs.
[没有发现file]AI Diagram Generator
Enter your prompt. Upload files if needed. Generate diagrams, charts, or slides instantly.


