


A Gantt chart is a great way to share project timelines with a team. Many project managers or companies use them to share tasks, deadlines, and dependencies, especially in larger teams and across departments. These diagrams can be a central resource for large companies working on big projects.
One of the ways to make these is through PlantUML. It’s a text-based tool that uses structured text. This syntax can initially seem intimidating, but it’s easy to use. You can describe Gantt charts or diagrams without dragging shapes or adding lines or arrows, as in GUI tools.
A key advantage of using PlantUML or text-based Gantt charts is version control. The syntax and code live in source files. Developers or team members can easily track them. No need to export images. All you have to do is embed the diagram directly into your Markdown, wiki, or Confluence page.
In this article
How to Make a Gantt Chart with PlantUML
Before creating full project timelines, it’s essential to understand the basic syntax of Gantt charts in PlantUML. Like other diagram types in PlantUML, Gantt charts are built with precise but easy-to-understand text. Once you get used to the format, you can create Gantt charts with a few lines of code.
Start and End Tags
Every PlantUML Gantt chart must begin with “@startgantt” and end with “@endgantt”. These tags enclose the contents of your diagram and tell PlantUML what kind of diagram to render. Add the “Project Starts YYYY-MM-DD” keyword to create the foundation for your Gantt chart.
@startgantt
Project Starts 2025-07-01
@endgantt
Defining Tasks
Now, it’s time to add the tasks into your Gantt chart, or the “in-betweens” of the startgantt and endgantt tags. Here, you’ll learn how to define tasks, specify start dates and durations, and edit your Gantt chart’s general flow.
Basic Task Definition
A task is declared by writing its name inside square brackets. The most straightforward possible task, therefore, looks like:
[TaskName]
Specifying Start Dates and Durations
After determining your task name, it’s time to set its start date and duration.
Method 1Using the “starts” and “lasts” keywords
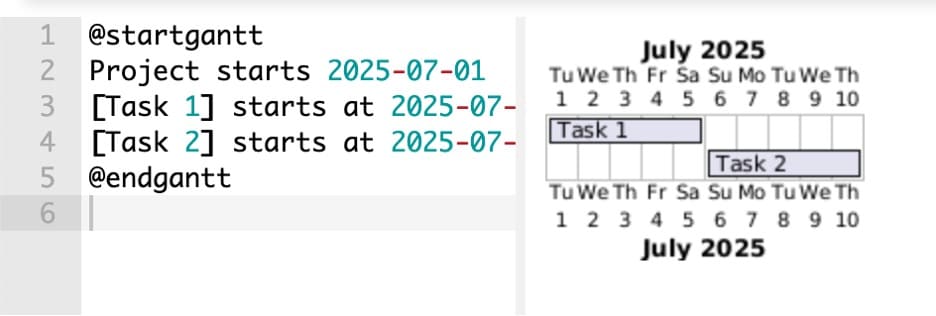
You’ll work with the keywords “starts at YYYY-MM-DD” and “lasts x days” to do this. A Gantt chart with set durations should look like this:
@startgantt
Project starts 2025-07-01
[Task 1] starts at 2025-07-01 and lasts 5 days
[Task 2] starts at 2025-07-06 and lasts 5 days
@endgantt
Method 2Using Absolute Dates
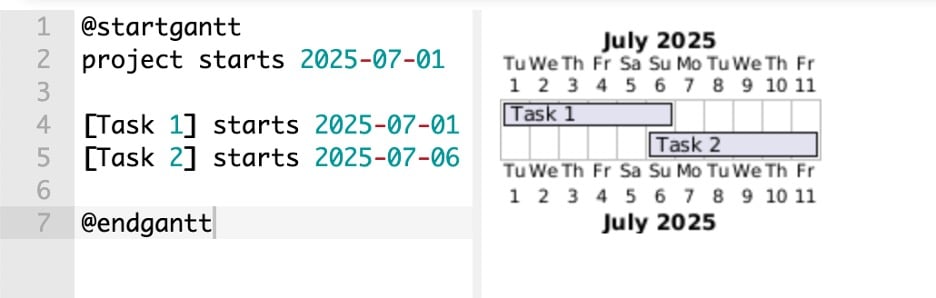
Another method is to use absolute dates (“starts” and “ends”) instead of working with a set duration, as in the previous example.
@startgantt
project starts 2025-07-01
[Task 1] starts 2025-07-01 and ends 2025-07-06
[Task 2] starts 2025-07-06 and ends 2025-07-11
@endgantt
Defining Milestones
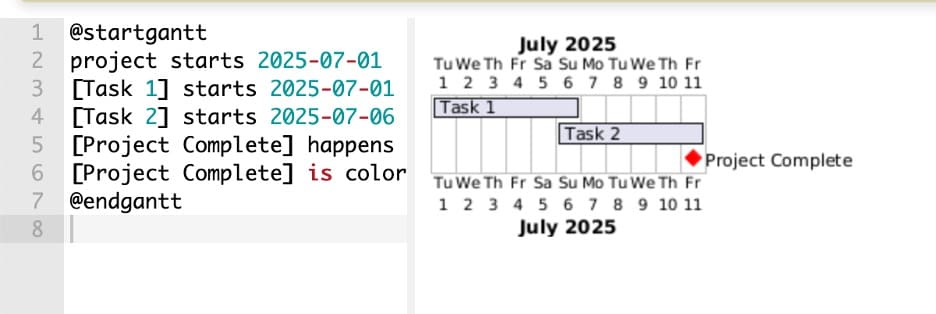
Milestones are crucial points in your project that don’t span multiple days, such as deadlines, decision gates, or product launches. There is no direct milestone keyword in PlantUML, so you’ll have to work creatively. Here’s how:
- Use “happens” with a specific date for a milestone.
- Define the milestone as “[MilestoneName]”
- Add “lasts x days” to make it appear as a milestone (diamond shape)
- You can add “is colored in red” or another color to make it stand out
@startgantt
project starts 2025-07-01
[Task 1] starts 2025-07-01 and ends 2025-07-06
[Task 2] starts 2025-07-06 and ends 2025-07-11
[Project Complete] happens 2025-07-11
[Project Complete] is colored in red
@endgantt
Adding Timeline Scales
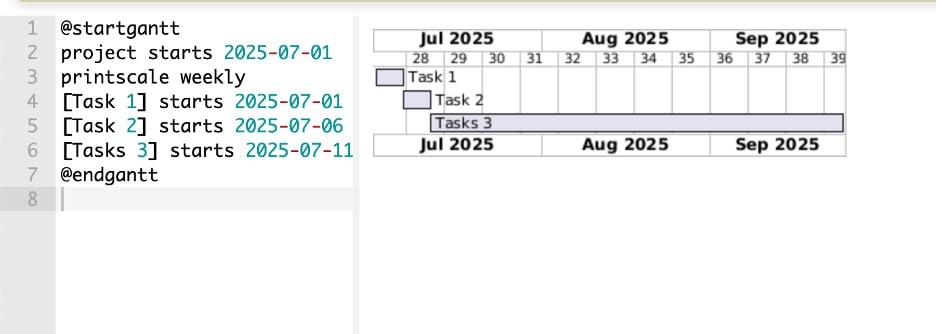
As you’ve seen, PlantUML also automatically adjusts the visible date range of your Gantt chart based on entries and durations. However, if you want to adjust the scale of time rendered in the Gantt chart, you can use the following syntax:
- “printscale daily” shows a daily timeline scale
- “printscale weekly” shows a weekly timeline scale
- “printscale monthly” shows a monthly timeline scale
@startgantt
project starts 2025-07-01
printscale weekly
[Task 1] starts 2025-07-01 and ends 2025-07-06
[Task 2] starts 2025-07-06 and ends 2025-07-11
[Tasks 3] starts 2025-07-11 and ends 2025-09-25
@endgantt
Comments and Titles
PlantUML allows you to add titles, captions, and inline comments to keep your charts readable and well-documented.
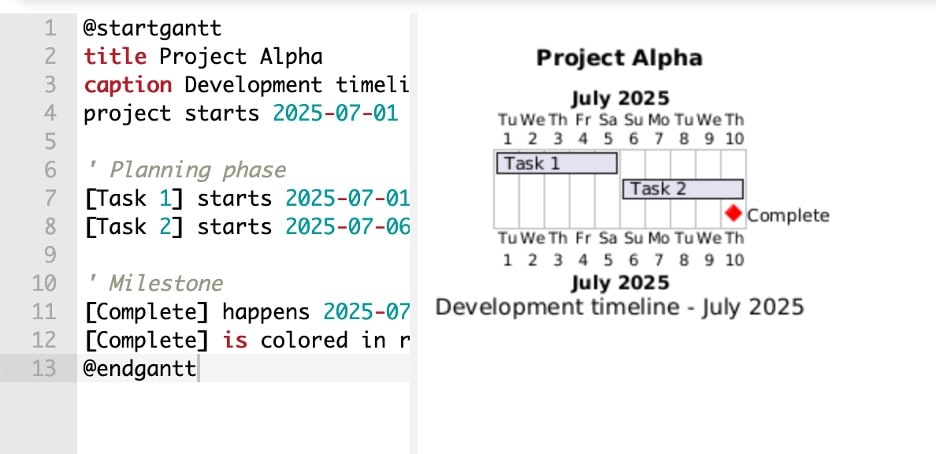
Use the “title” keyword to add a header at the chart's top. If you want to add a footnote or descriptive line below the chart, use “caption”. And for developer-facing notes that won’t appear in the chart, use an apostrophe to leave comments in your code. Here are these codes in action:
@startgantt
title Project Alpha
caption Development timeline - July 2025
project starts 2025-07-01

' Planning phase
[Task 1] starts 2025-07-01 and ends 2025-07-05
[Task 2] starts 2025-07-06 and ends 2025-07-10

' Milestone
[Complete] happens 2025-07-10
[Complete] is colored in red
@endgantt
How to Make a Complex Gantt Chart in PlantUML
Once you’ve mastered the basics of Gantt chart syntax in PlantUML, you can start layering in more powerful features. These advanced tools help you visualize dependencies, group tasks, highlight essential periods, and reuse common values with variables.
Let’s explore the features that give your timeline real depth.
Task Dependencies
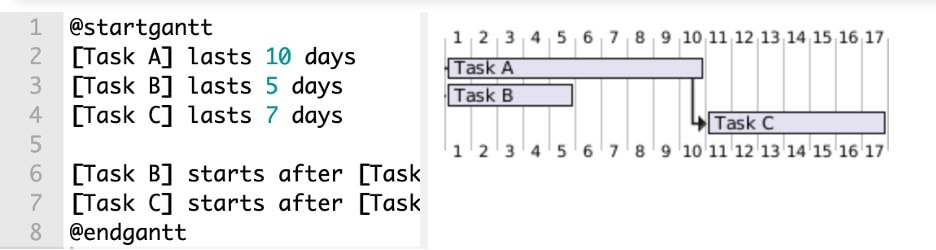
Dependencies are essential in any project plan. They tell you which tasks must be finished before others can begin. In PlantUML, you define this relationship using the “starts after” keyword. You won’t have to define actual start and end dates; you can add a “lasts x days” keyword after the task names. Then, play with the “starts after” keyword as provided below:
@startgantt
[Task A] lasts 10 days
[Task B] lasts 5 days
[Task C] lasts 7 days

[Task B] starts after [Task A]'s start
[Task C] starts after [Task A]'s end
@endgantt
Grouping Tasks
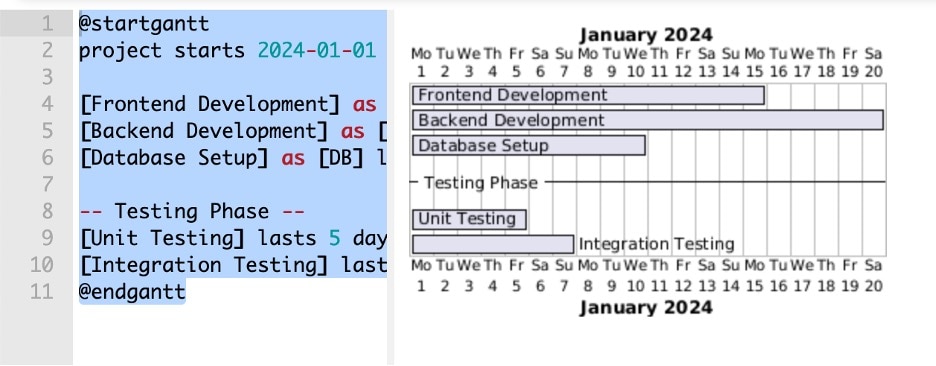
You can group related tasks with a simple “—GroupName --" keyword within the code. This is great because you can mark tasks related to departments or stages of the project. For example, in the example below, we added a “Testing Phase”, which will show up clearly in the Gantt chart to be rendered.
@startgantt
project starts 2024-01-01
[Frontend Development] as [FE] lasts 15 days
[Backend Development] as [BE] lasts 20 days
[Database Setup] as [DB] lasts 10 days
-- Testing Phase --
[Unit Testing] lasts 5 days
[Integration Testing] lasts 7 days
@endgantt
Customizing Colors and Styles
You can add color to tasks for better visibility or to represent categories, statuses, or teams. Use square brackets and a color keyword like “[#colorname]” to add colors just like this:
@startgantt
-- Frontend Development --
[UI Design] lasts 5 days
[UI Design] is colored in lightblue
[Component Development] lasts 8 days
[Component Development] is colored in lightblue

-- Backend Development --
[API Design] lasts 4 days
[API Design] is colored in lightgreen
[Database Schema] lasts 6 days
[Database Schema] is colored in lightgreen

-- Testing Phase --
[Unit Tests] lasts 5 days
[Unit Tests] is colored in orange
[Integration Tests] lasts 7 days
[Integration Tests] is colored in orange
@endgantt
Using Variables
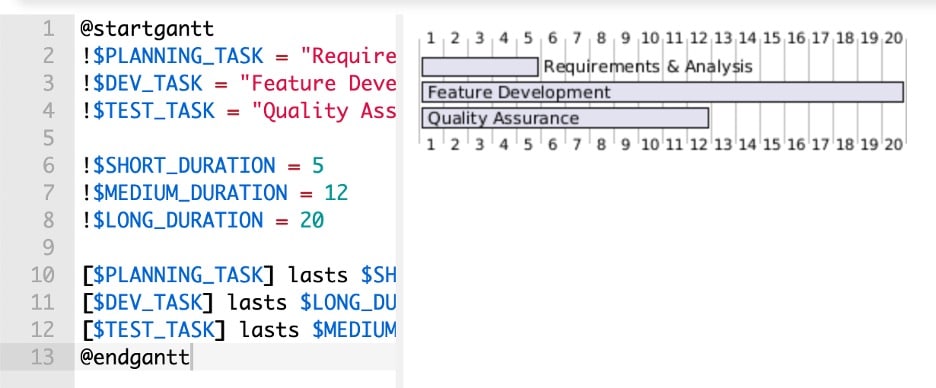
You can simplify your chart by defining variables using the !$variable_name = value syntax for repeating dates or durations. This keeps your diagram DRY (don't repeat yourself) and easy to update.
This has two benefits: 1) you can add new tasks with the same duration, or 2) if you need to bump up durations, you can edit in one place rather than manually editing the other tasks.is especially useful in complex or evolving timelines.
@startgantt
!$PLANNING_TASK = "Requirements & Analysis"
!$DEV_TASK = "Feature Development"
!$TEST_TASK = "Quality Assurance"

!$SHORT_DURATION = 5
!$MEDIUM_DURATION = 12
!$LONG_DURATION = 20

[$PLANNING_TASK] lasts $SHORT_DURATION days
[$DEV_TASK] lasts $LONG_DURATION days
[$TEST_TASK] lasts $MEDIUM_DURATION days
@endgantt
With these advanced features, your Gantt charts will go from simple timelines to fully interactive, professional-grade project diagrams, all while staying inside a text file.
PlantUML Gantt Chart Examples
Now that you’ve seen the core syntax and advanced features, combine everything with real-world Gantt chart examples. These will help solidify what you’ve learned and give you a strong foundation to build from.
The first example is a straightforward project timeline. The second demonstrates a more complex plan, including task dependencies and grouped phases, perfect for teams managing larger workloads.
Simple Project Plan
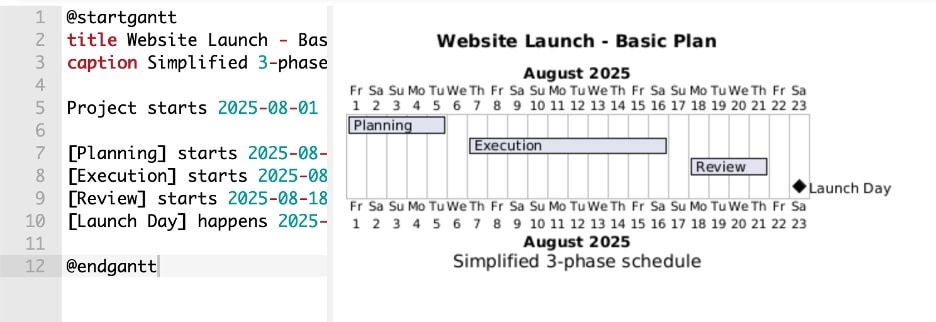
This chart outlines a basic three-step process: Planning, Execution, and Review. Each task has a start date and duration, making it a great starter template for small projects. This timeline shows the key stages of a website launch and ends with a milestone. It’s ideal for personal planning, academic projects, or MVP timelines.
@startgantt
title Website Launch - Basic Plan
caption Simplified 3-phase schedule

date 2025-08-01 to 2025-09-15

Planning starts 2025-08-01 duration 5
Execution starts 2025-08-07 duration 10
Review starts 2025-08-18 duration 4
Launch Day starts 2025-08-23 milestone
@endgantt
Complete Project With Dependencies and Grouping
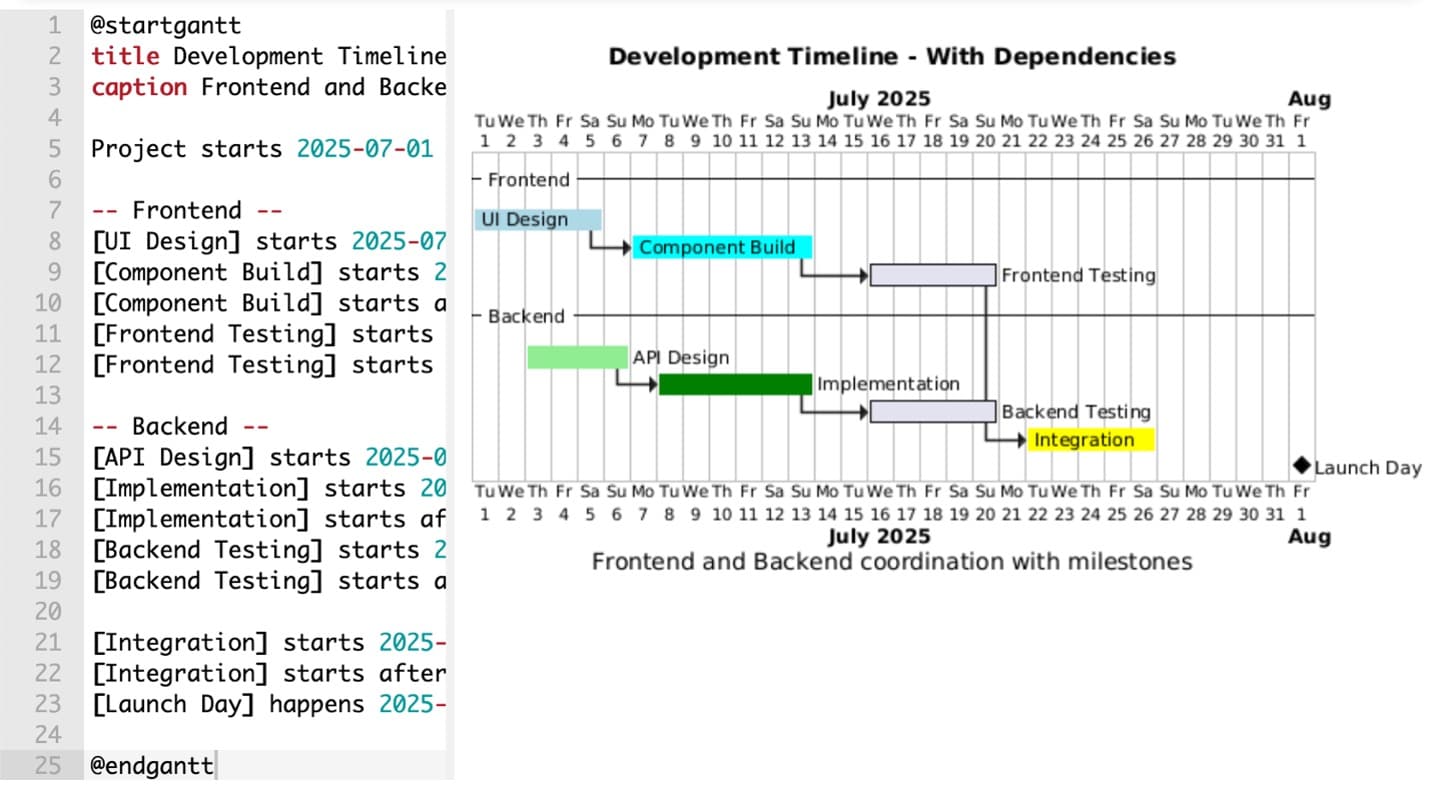
This example reflects a more structured project with front-end and back-end teams, task dependencies, color-coded phases, and a highlighted sprint period. Here, tasks are grouped by team for better visibility, dependencies ensure the workflow follows real constraints, and the highlighted sprint helps teams focus on the most critical window.
This kind of diagram is ideal for sprint planning, engineering roadmaps, or agile ceremonies where task coordination is essential.
@startgantt
title Development Timeline - With Dependencies
caption Frontend and Backend coordination with milestones

Project starts 2025-07-01

-- Frontend --
[UI Design] starts 2025-07-01 and lasts 5 days and is colored in LightBlue
[Component Build] starts 2025-07-07 and lasts 7 days and is colored in Cyan
[Component Build] starts after [UI Design]'s end
[Frontend Testing] starts 2025-07-16 and lasts 5 days
[Frontend Testing] starts after [Component Build]'s end

-- Backend --
[API Design] starts 2025-07-03 and lasts 4 days and is colored in LightGreen
[Implementation] starts 2025-07-08 and lasts 6 days and is colored in Green
[Implementation] starts after [API Design]'s end
[Backend Testing] starts 2025-07-16 and lasts 5 days
[Backend Testing] starts after [Implementation]'s end

[Integration] starts 2025-07-22 and lasts 5 days and is colored in Yellow
[Integration] starts after [Frontend Testing]'s end
[Launch Day] happens 2025-08-01
@endgantt
How to Share or Export a Gantt Chart in PlantUML
Creating Gantt charts with PlantUML is only half the story. The real value comes when you integrate these charts into your existing workflow. Because PlantUML is designed for flexibility, it fits naturally into many environments that developers and technical teams already use.
Embedding PlantUML Gantt Charts in Markdown Documents
PlantUML integrates with several Markdown-based documentation platforms, though support varies. GitLab has native PlantUML support, while MkDocs works well with PlantUML plugins. Confluence supports PlantUML through third-party plugins. GitHub requires workarounds using external rendering services since it lacks native support.
You can embed PlantUML directly in Markdown using fenced code blocks for supported platforms. Write or copy/paste your PlantUML Gantt chart between the markers.
```plantuml @startgantt title Sprint Overview Planning starts 2025-07-01 duration 3 Development starts 2025-07-04 duration 10 @endgantt ```
Exporting to PNG, SVG, or Other Image Formats
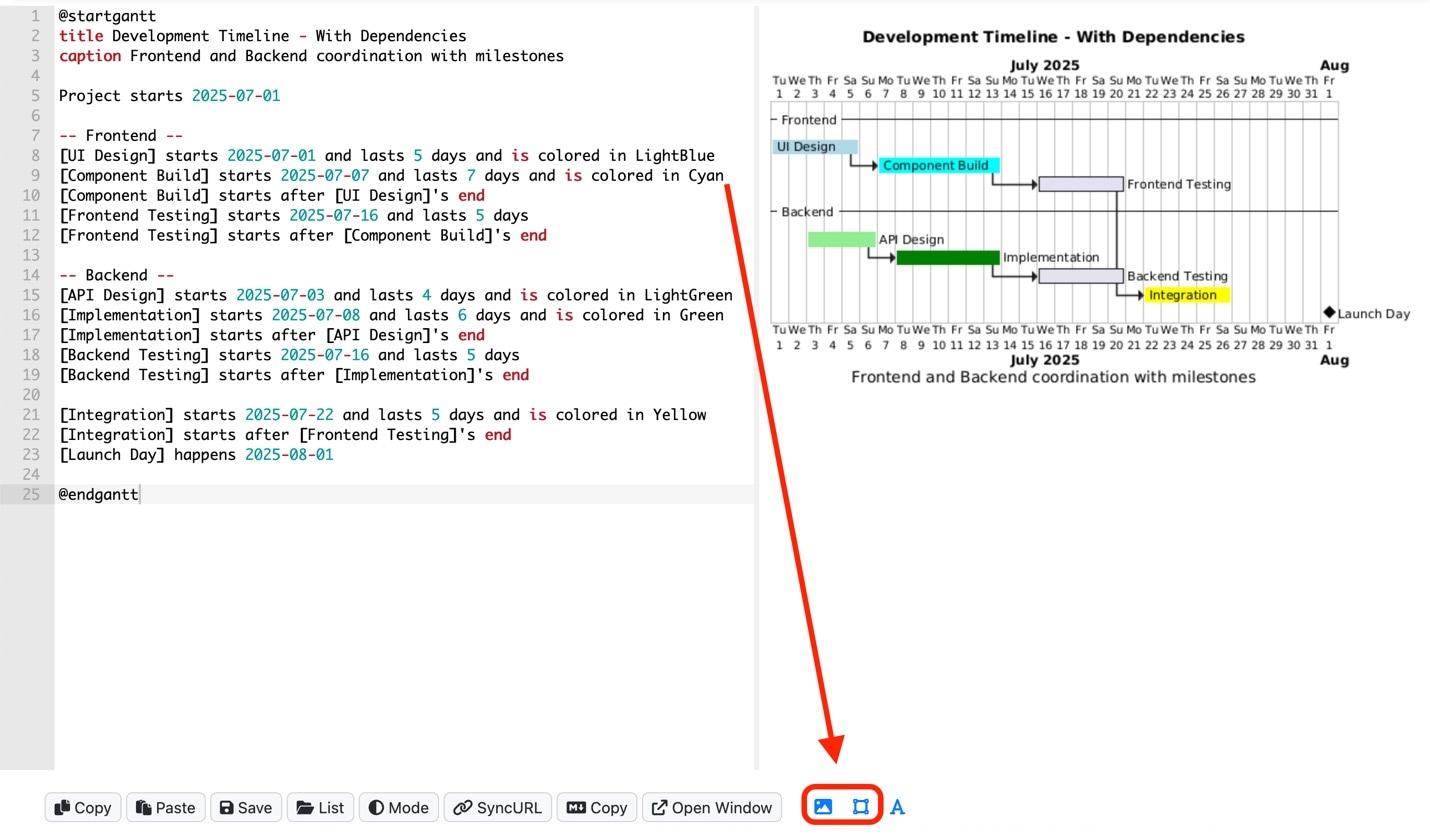
If you’re preparing a slide deck or sending a report to stakeholders who won’t use Markdown or PlantUML, you can easily export your charts to image formats like PNG or SVG. You can press the PNG/SVG buttons in the editor, as marked below, to download them.
PlantUML Alternatives: More Methods to Make a Gantt Chart
While PlantUML is a flexible and efficient tool for creating Gantt charts, it may not be the best option for every team or scenario. Understanding its limitations can help you decide when it makes sense to explore alternatives.
PlantUML Limitations
One common challenge with PlantUML is its learning curve, especially for non-developers. Even though the syntax is straightforward, it still requires users to write and edit text manually. This can become a barrier for teams that include designers, project managers, or business stakeholders. These users often prefer tools where changes can be made visually without understanding formatting rules or keywords.
Another limitation is the level of manual adjustment sometimes required for layout. While PlantUML does its best to position tasks automatically, complex timelines with multiple overlapping tasks or dependencies may need extra configuration. You might find yourself specifying date ranges, adjusting groups, or fine-tuning highlight areas to achieve a balanced layout. This can slow things down, particularly when creating charts for high-visibility reports or presentations.
For example, if your team is preparing a detailed project timeline to include in a client proposal or investor update, creating and fine-tuning the visual layout in PlantUML might take longer than expected. A visual-first tool could help complete the same task more quickly, especially when non-technical feedback is part of the review process.
GUI Tool Options
In these situations, a graphical tool might be a better fit. For teams that need a "what you see is what you get" editing experience, software like EdrawMax offers features like:
- Built-in templates for fast project setup
- Intuitive drag-and-drop interfaces
- Visual dependency lines and timeline scaling
- Collaboration-friendly features for real-time edits
- Flexible export options like PDF, image, or spreadsheet formats
These platforms are beneficial when visual polish, ease of use, or team-wide access are prioritized. That said, many teams benefit from using both approaches. PlantUML is ideal for technical documentation, internal roadmaps, and automated workflows. On the other hand, visual tools work better for early-stage planning, collaborative sessions, or public-facing reports.
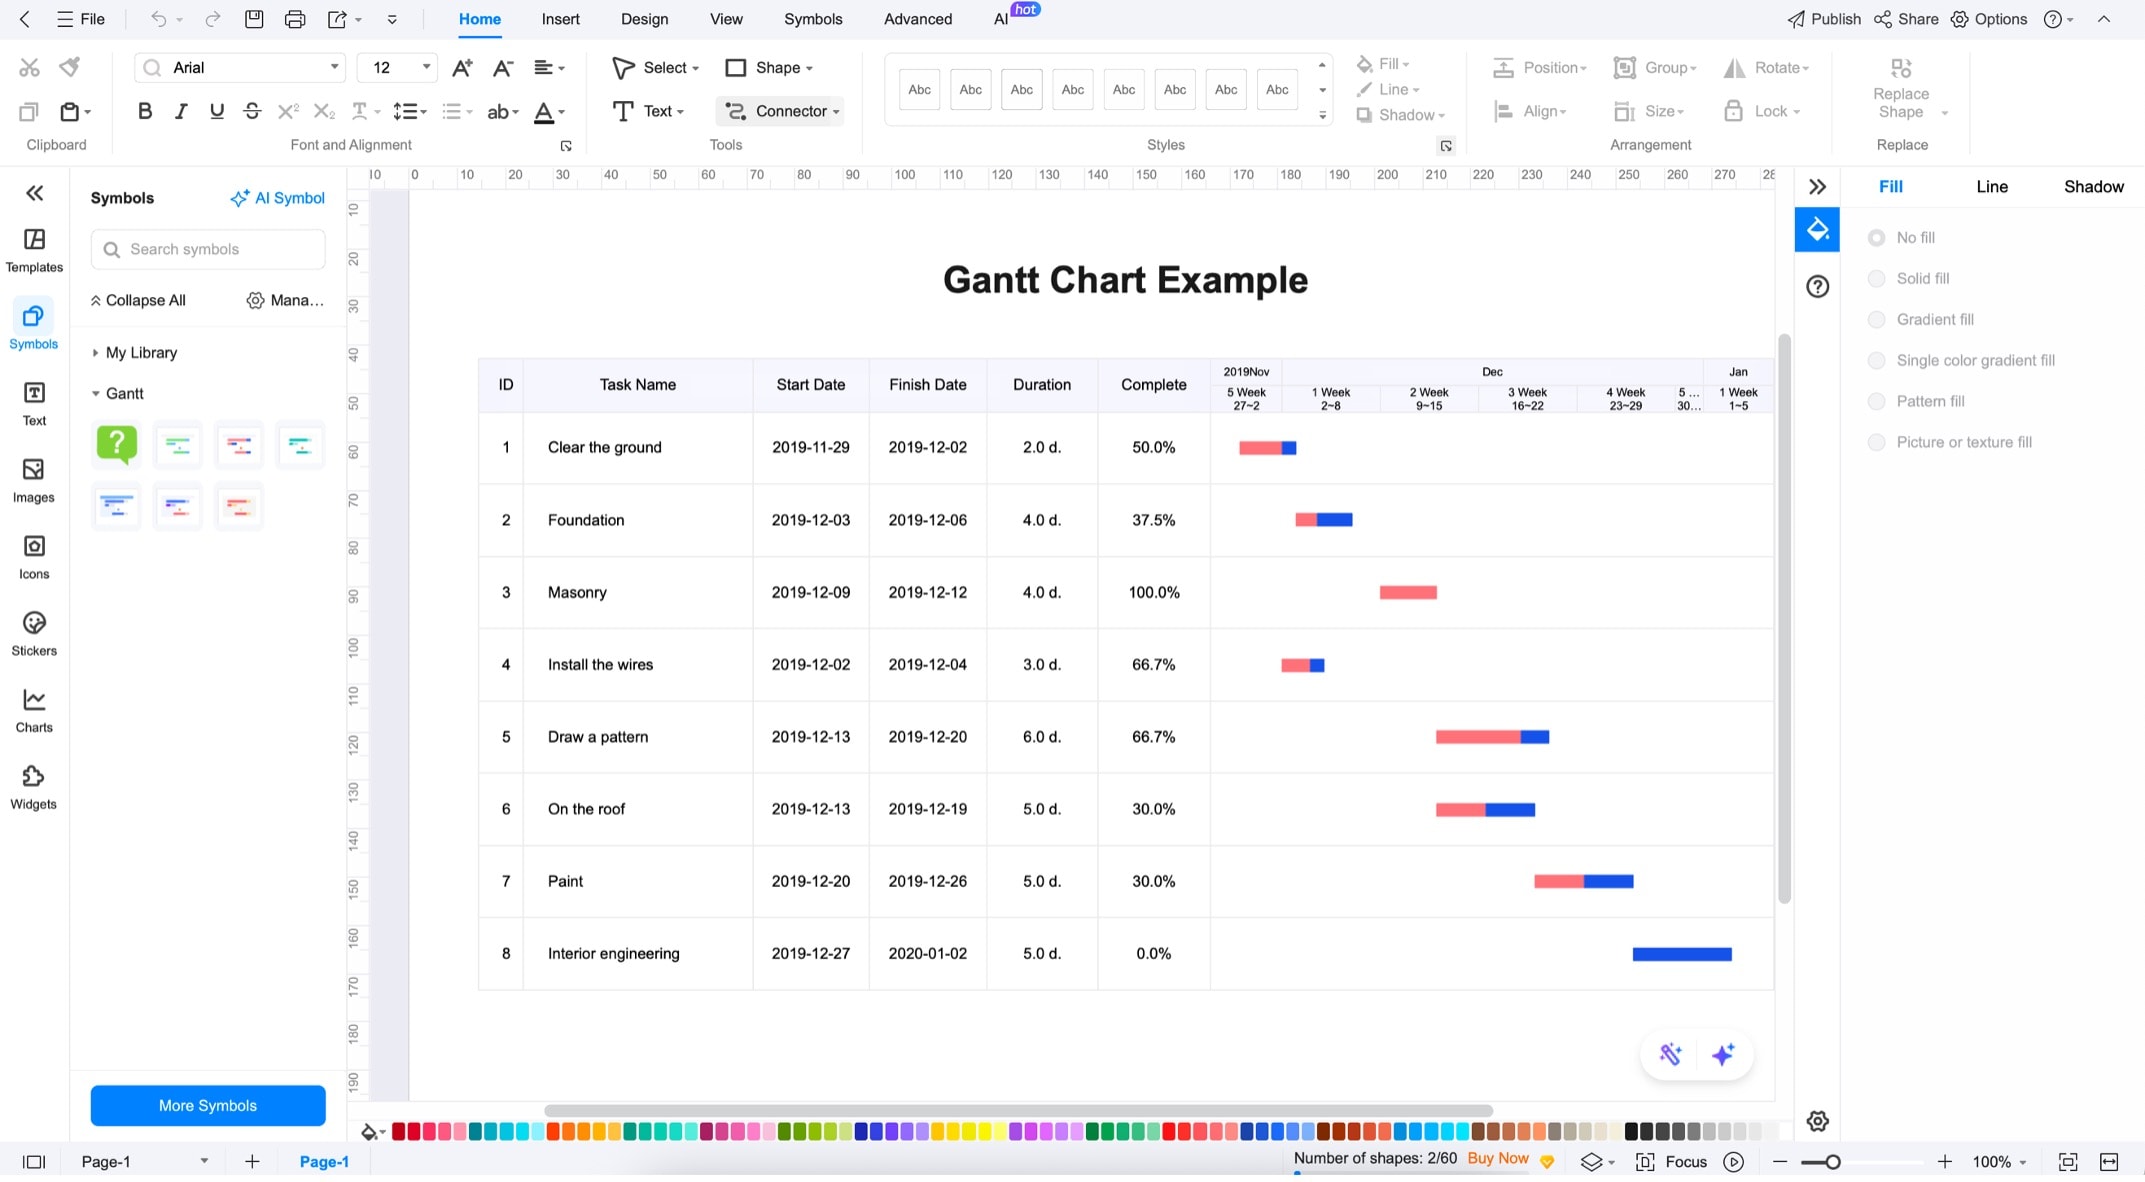
EdrawMax: Overview and Key Features
So, if you need a GUI tool, try to check out the power of Wondershare EdrawMax. While it’s a GUI tool, it offers a similar, precise charting experience that you can also get via PlantUML, except that you won’t have to memorize complicated syntax. All you have to do is select a template, edit it, drag in some new elements you need, and export.
To make your Gantt chart workflow so easy, EdrawMax gives you the following features to work with:
- Built-in Gantt Chart module. You can generate task bars, dependencies, and timelines using a dedicated interface designed for project scheduling.
- Data import from Excel/CSV. You can also import structured data directly from spreadsheets: task names, start/end dates, durations, and EdrawMax will instantly generate a corresponding Gantt chart.
- Custom task attributes. You can define fields like priority, progress percentage, resource name, or cost, giving you more control over project tracking.
- Multi-page support. You can split large Gantt charts into manageable pages or sub-maps and navigate between them via tabbed views or hyperlinks.
- Export to Visio, PDF, or SVG. You can also export your finished Gantt chart to multiple formats, including Visio-compatible files for team collaboration or SVG for high-res documentation.
- AI Tools. With the help of AI tools, EdrawMax also allows you to speed up your workflow. Generate charts, images, and text or custom schedules from scratch.
AI Diagram Generator
Enter your prompt. Upload files if needed. Generate diagrams, charts, or slides instantly.


