




Quick answer: A cause and effect graphic organizer is a visual worksheet that helps learners organize ideas, relationships, events, details, or evidence before reading, writing, or presenting.
Best for: Use these examples for classroom worksheets, writing preparation, reading comprehension, brainstorming, and student presentations.
- Choose simple organizers for quick comprehension and detailed organizers for complex assignments.
- Keep labels short enough for students to scan and compare.
- Use EdrawMax to customize prompts, shapes, colors, and printable worksheets.
In this article
1. What is Cause and Effect Graphic Organizer
How to use it?
- Write the title of the problem or topic you want to explore or organize.
- In the cause section, list what you think are the reasons for the problem.
- In the effect section, list the things that happened due to these causes.
2. The Cause and Effect Graphic Organizer Examples
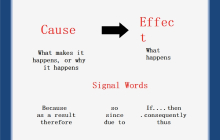
You can use a cause and effect graphic organizer to organize information and explore the causes and effects of any event or problem. These graphic organizers can depict underlying causes and effects of a reading passage for a series of events. The type of diagram or layout you use to create these graphic organizers depends on what you want to explore. Picking a suitable design for your task makes your job much easier. Here are some cause and effect graphic organizer examples that will help you learn everything you want to know. Check out these examples and pick a suitable template for your assignment.
 |  |  |
| Cause and Effect Graphic Organizer | Graphic Organizer Cause and Effect | Cause and Effect Graphic Organizer PDF |
 |  |  |
| Cause and Effect Graphic Organizer Printable | Cause and Effect Graphic Organizer Examples | Cause and Effect Graphic Organizer 4th Grade |
 |  |  |
| French and Indian War Cause and Effect Graphic Organizer | Cause and Effect Graphic Organizer Template | Cause and Effect Graphic for Kids |
Example 1: Cause and Effect Graphic Organizer
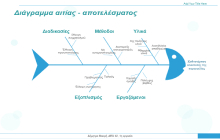
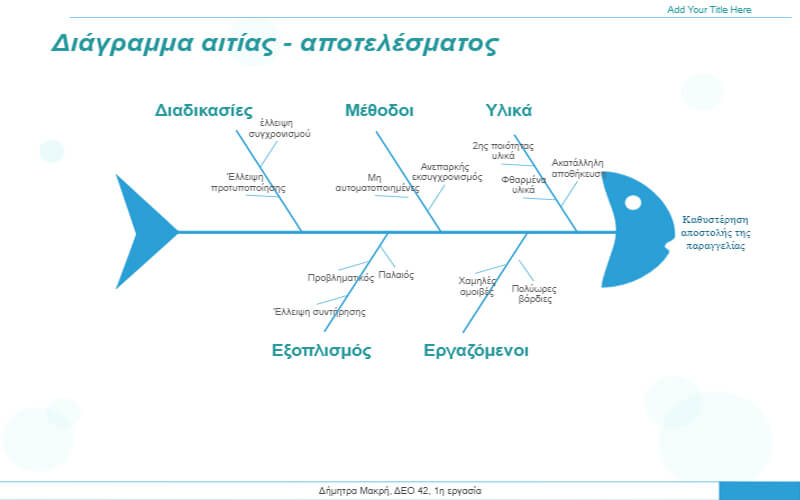
A cause and effect graphic organizer helps with smooth brainstorming sessions and problem-solving activities when the whole team agrees on one statement or topic and determines its causes and effects. You can use various diagrams to create a cause-effect organizer. The diagram in this example is a fishbone diagram mainly used to identify the multiple causes regarding a specific problem. The title of the problem goes on the center-right side. Each bone in the fishbone diagram represents the effects or causes of the described situation.


Example 2: Graphic Organizer Cause and Effect
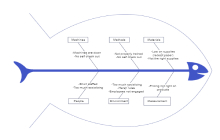
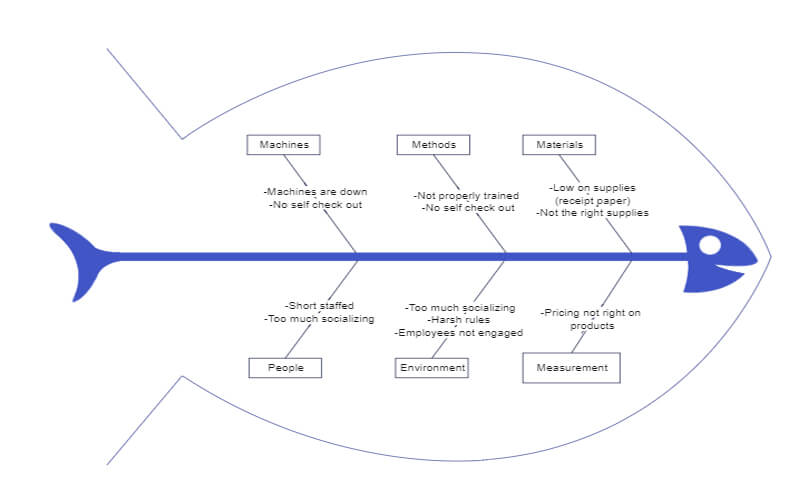
A business graphic organizer cause and effect visually represent various factors that could change multiple things in a business with both good and bad effects. With these graphic organizers, marketers can figure out which strategies will yield better results and what technique will make the process more efficient. The fishbone diagram in this example is a cause-effect graphic organizer to identify the effects of various causes in a business. The effects on the business area are in the boxes connected with fishbones, and the text in the connectors represents the causes.
Example 3: Cause and Effect Graphic Organizer PDF
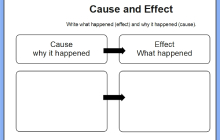
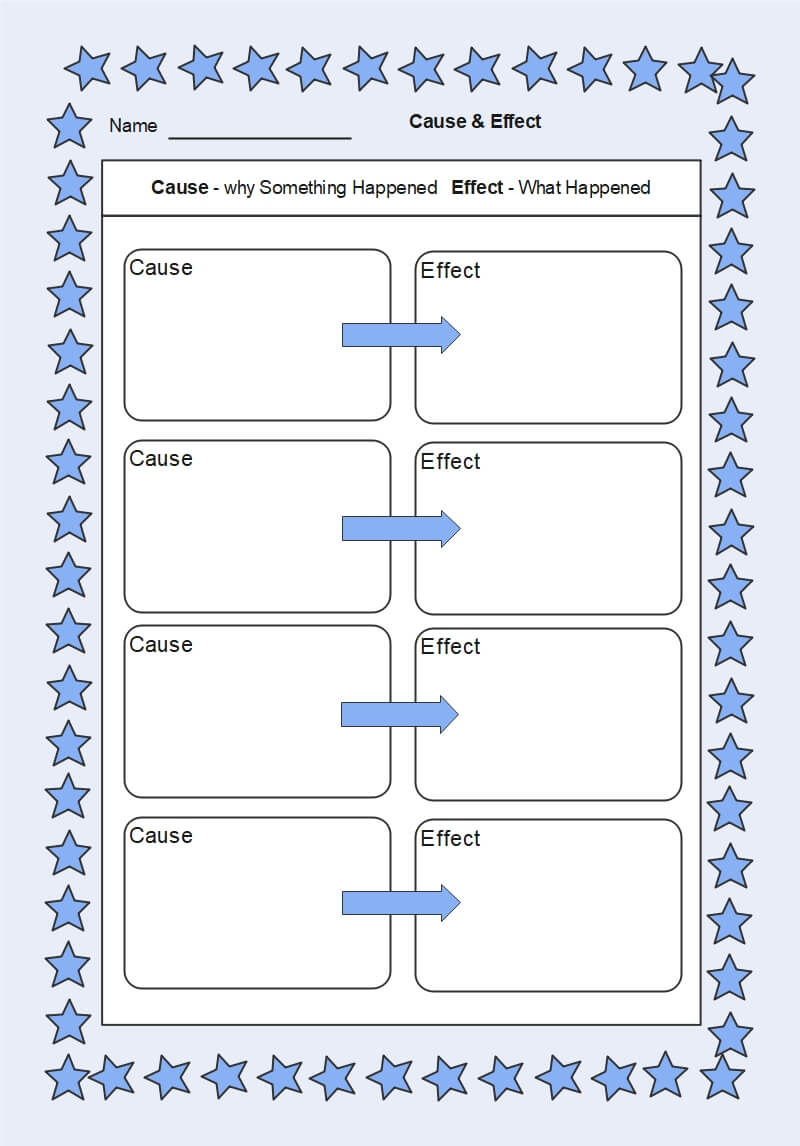
The cause and effect graphic organizer PDF identifies the relationships between two entities and depicts the causes and effects easily. There is no specific layout of a chase effect organizer, and you can use any diagram or chart you think is perfect for your task or assignment. The template in this example is a simple cause-effect chart with the causes on the left side and the effects on the right side. The problem statement or topic title goes at the top. Each situation or event depicted in the charts is wholly based on the central idea.
Example 4: Cause and Effect Graphic Organizer Printable
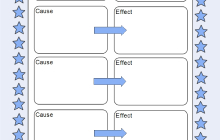
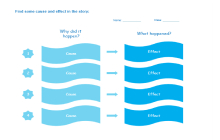
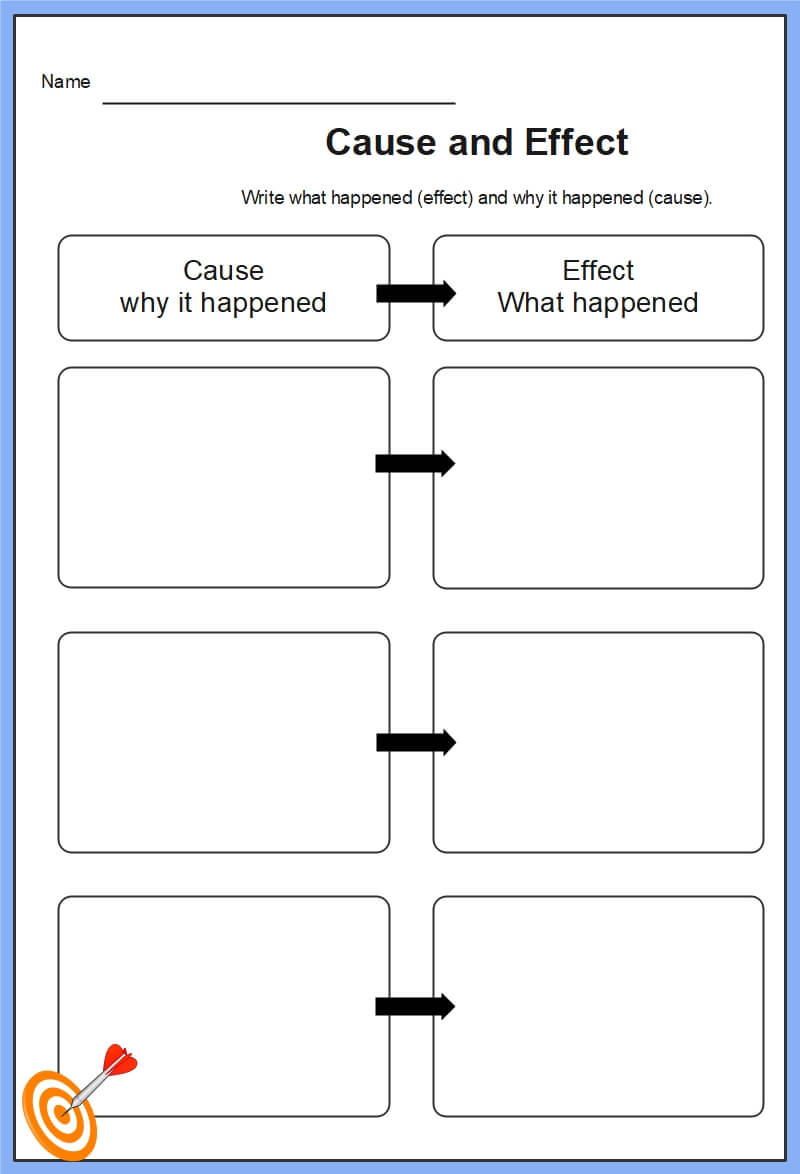
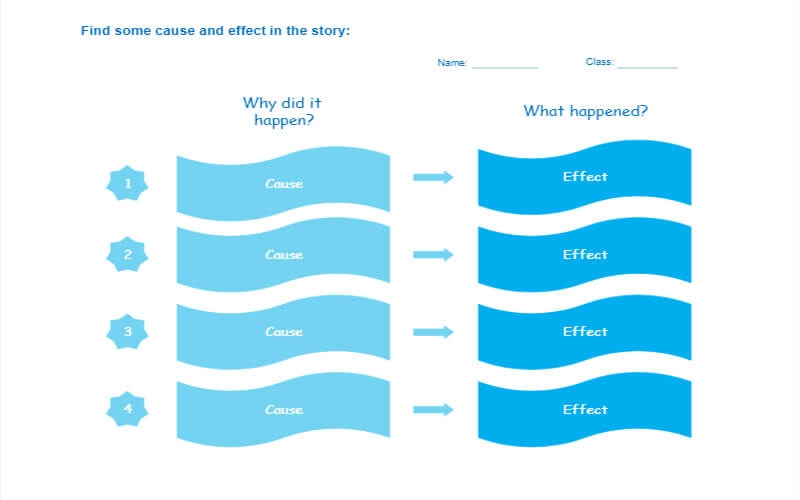
The cause and effect graphic organizer printable template is the most commonly used graphic organizer because it is easy to edit and print. Teachers use these organizers to give assignments and tests to their students. This example is a sequence chart depicting why it happened, refers to the cause, and what happened referred to as its effects on the situation. The boxes on the right side are the cause section, where you can write the details and reasons for the event. In the right area, you can report the effects it caused.
Example 5: Cause and Effect Graphic Organizer Example
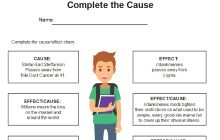
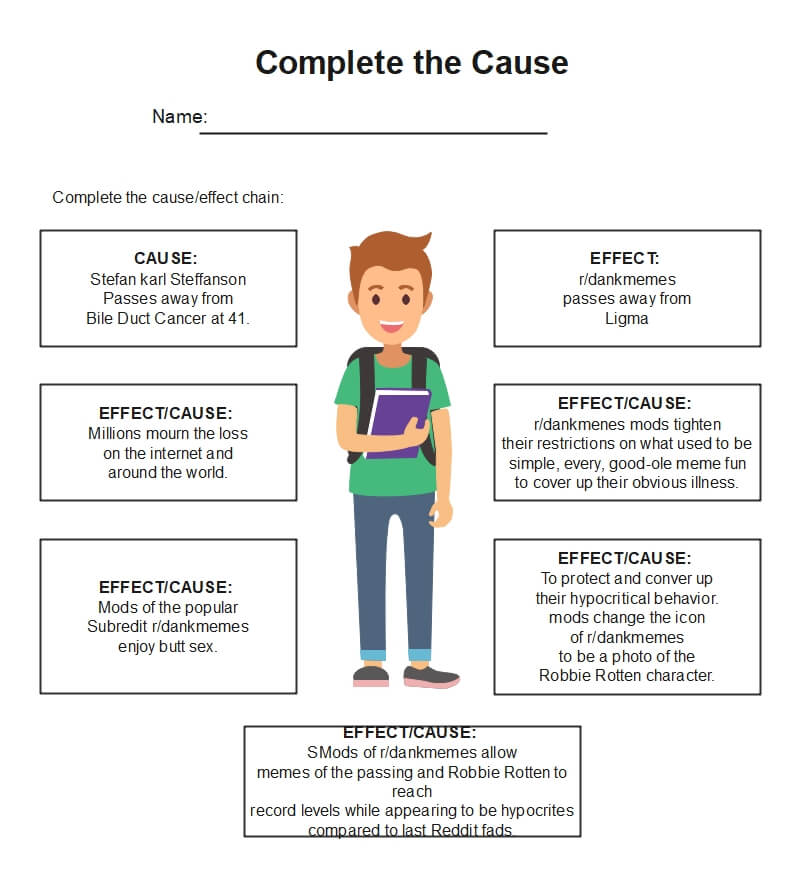
This is a cause and effect graphic organizer example for test assignments. Teachers use these tools to teach their students how to organize information logically and how to identify the cause and effect of any event or situation. There are a total of seven boxes in this template. The labels of the two boxes in the top row are cause and effect. Other than these boxes, the labels on the rest are effect/cause, making it harder for students to identify their category. The students determine their type and draw a chain to complete the sequence diagram.
Example 6: Cause and Effect Graphic Organizer 4th Grade
A cause and effect graphic organizer for 4th-grade students is best to teach primary schoolers to determine the causes and effects of various situations or problems in a text paragraph. It helps them improve their reading skills and makes helpful notes and brainstorm to figure out what happened due to the causes and why these causes occurred. Students can use this cause-effect diagram to clarify and organize complex information, and they can determine the leading cause of the problem and solve it from the roots.
Example 7: French and Indian War Cause and Effect Graphic Organizer
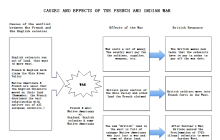
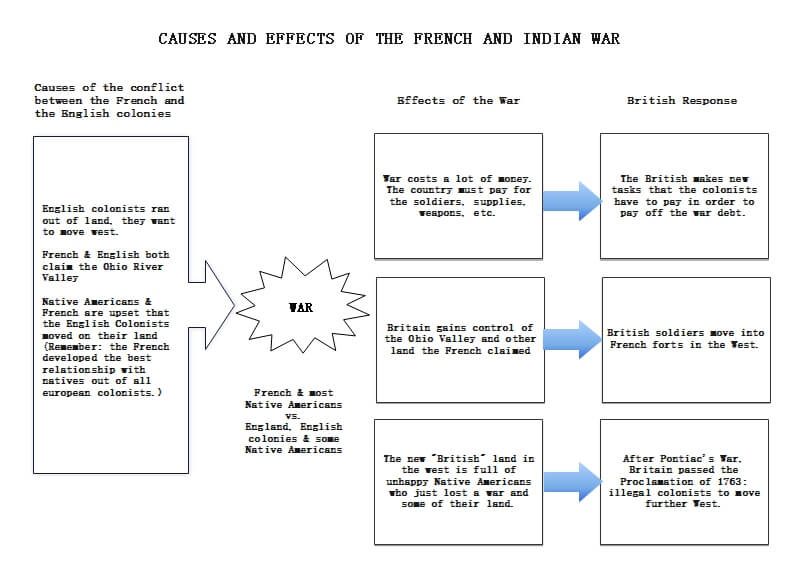
This French and Indian war cause and effect graphic organizer visually represents the reason behind the dispute between the French and English colonists and how it affected the people. The causes of the war are in the boxes on the left side. The war started because native Americans and French were upset due to English colonists moving to their land. The effects of the war and the British's response are in the boxes on the right side. Lots of money got wasted on the war, and some land got stolen from the native Americans.
Example 8: Cause and Effect Graphic Organizer Template
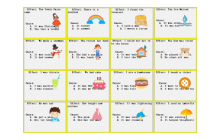
With a cause and effect graphic organizer template, teachers can make creative reading books for their students to teach them the basics of cause and effect of any event or situation. It also helps them understand the benefits of logically organizing information and developing out-of-the-box thinking. There is a picture book template in this example. You can see various pictures, each with an effect written at the top and two causes written at the bottom. The template is attractive, and kids will love to read it and, at the same time, learn more about the cause and effect method.
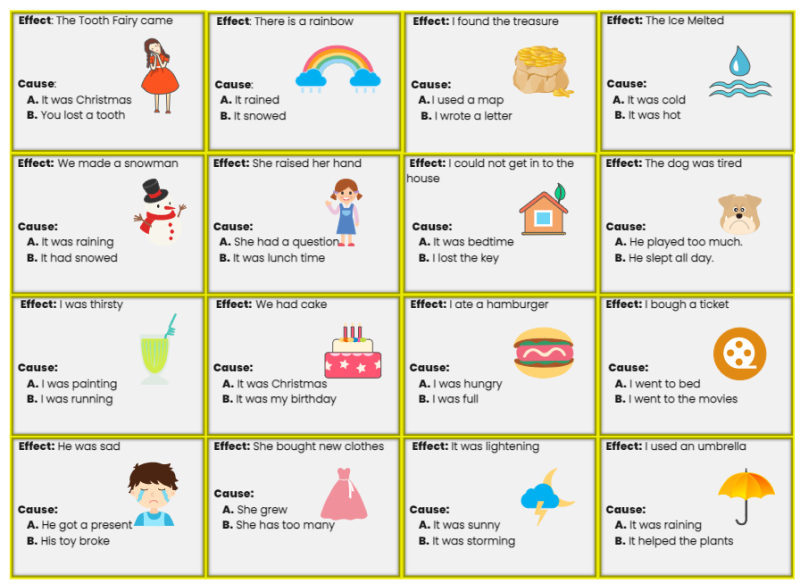
Example 9: Cause and Effect Graphic for Kid
AI Diagram Generator
Enter your prompt. Upload files if needed. Generate diagrams, charts, or slides instantly.

 Start free trial for unlimited edit
Create a file
anyway
Free & Easy
Powered ChatGPT, Gemini, Nano Banana Pro2
Upload files
Start free trial for unlimited edit
Create a file
anyway
Free & Easy
Powered ChatGPT, Gemini, Nano Banana Pro2
Upload files
What is a cause and effect graphic organizer?
A cause and effect graphic organizer is a visual worksheet that helps learners organize ideas, relationships, events, details, or evidence before reading, writing, or presenting.
How do I choose the right cause and effect graphic organizer example?
Choose the organizer by learning task. Use sequence-based layouts for events, category-based layouts for classification, and cause-effect layouts when students need to explain relationships.
Can I edit cause and effect graphic organizer templates in EdrawMax?
Yes. EdrawMax lets you customize labels, symbols, connectors, colors, notes, and layouts, then export or share the finished cause and effect graphic organizer diagram.
 Recent Articles
AI Diagram Generator
Enter your prompt. Upload files if needed. Generate diagrams, charts, or slides instantly.
What is a cause and effect graphic organizer?
A cause and effect graphic organizer is a visual worksheet that helps learners organize ideas, relationships, events, details, or evidence before reading, writing, or presenting.
How do I choose the right cause and effect graphic organizer example?
Choose the organizer by learning task. Use sequence-based layouts for events, category-based layouts for classification, and cause-effect layouts when students need to explain relationships.
Can I edit cause and effect graphic organizer templates in EdrawMax?
Yes. EdrawMax lets you customize labels, symbols, connectors, colors, notes, and layouts, then export or share the finished cause and effect graphic organizer diagram.

 (AI & Web)