

An organizational chart shows roles, departments, and reporting relationships. These seven examples help you compare hierarchical, matrix, circular, functional, and flat layouts before adapting a template for onboarding or organizational planning.
HR teams, managers, founders, and consultants can use these examples to explain reporting lines or plan a proposed structure.
Choose a hierarchical layout for clear reporting lines, a matrix for shared reporting, a functional layout for departments, and a flat layout for a team with fewer management layers.
Key takeaways:
- Org charts should clarify roles and reporting lines, not simply list employee names.
- Different structures work for different organizations, so choose the format before styling the chart.
- Keep titles, departments, and connectors consistent to avoid confusion.
- EdrawMax lets you edit templates, add photos or roles, and export the chart for onboarding or planning.
Before editing a template, prepare current role titles, department names, reporting relationships, and the date of the information. Company-named examples are illustrations, not verified current corporate structures.
Part 1: What is an Organizational Chart?
An organizational chart places roles or people in boxes and connects them to show reporting relationships. A hierarchy answers who reports to whom; a functional chart emphasizes departments. Use consistent connectors and distinguish direct reporting from advisory or project relationships.
Part 2: 7 Examples of Organizational Charts
1. Apple's Organizational Chart
Use this Apple-named example as an illustration of a company hierarchy. Replace the sample roles and names with verified information for your organization, then check each reporting line. Do not treat the template as a current official Apple organization chart.

 below.
 below.


2. Google's Organizational Chart
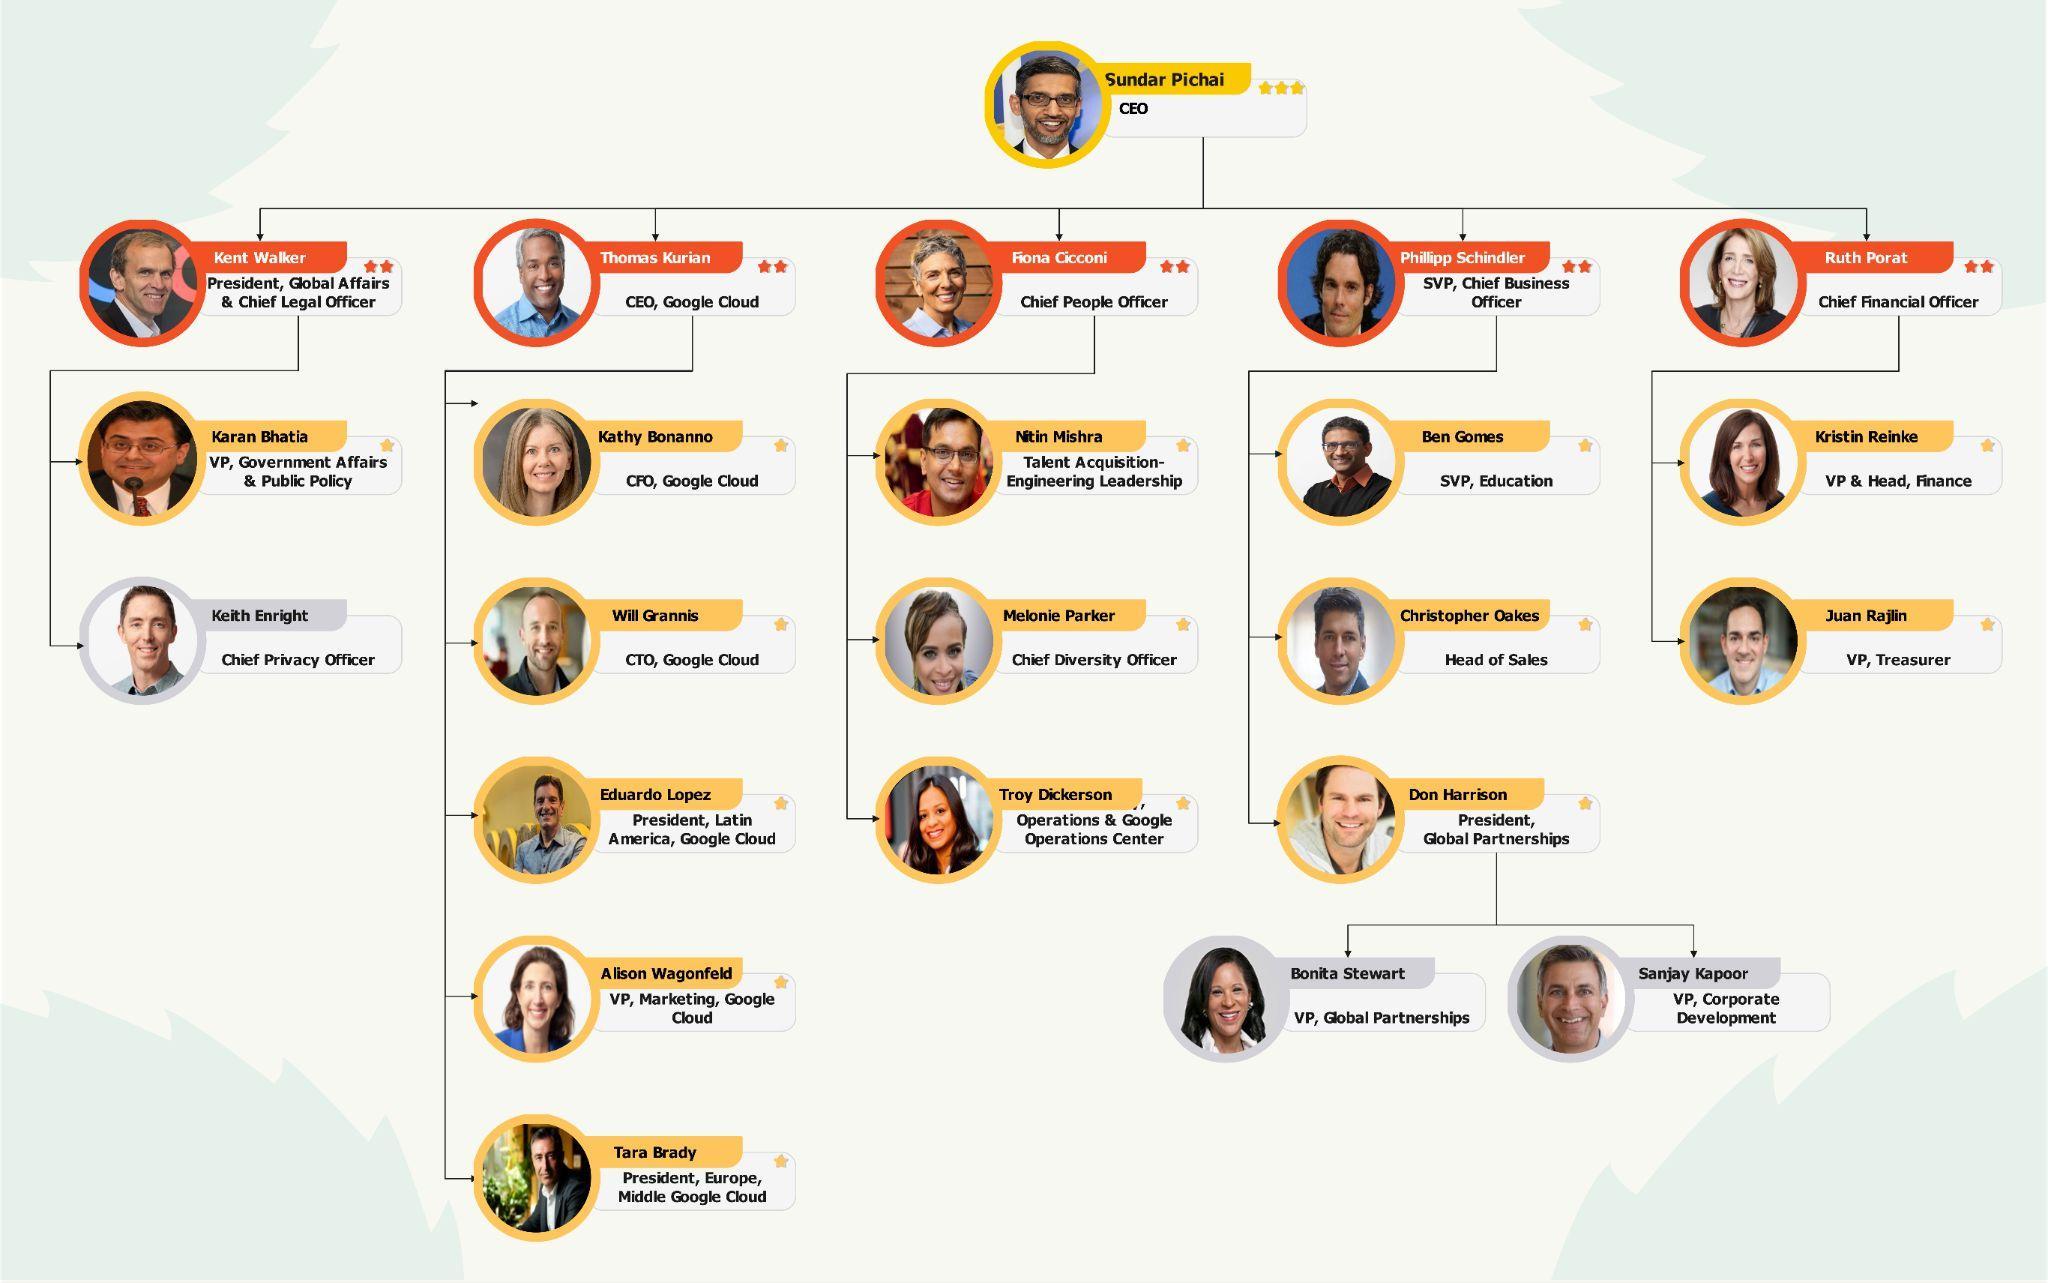
Use this Google-named example to discuss how teams and leadership roles can be grouped. Confirm the structure you need before editing labels, and mark any proposed reporting lines clearly. The example does not establish Google’s current corporate structure.
3. Matrix Organizational Chart
A matrix chart is useful when a role reports to both a functional manager and a project or product lead. Label the two relationship types and use distinct connector styles so readers can tell operational reporting from project accountability.

4. Circular Organizational Chart
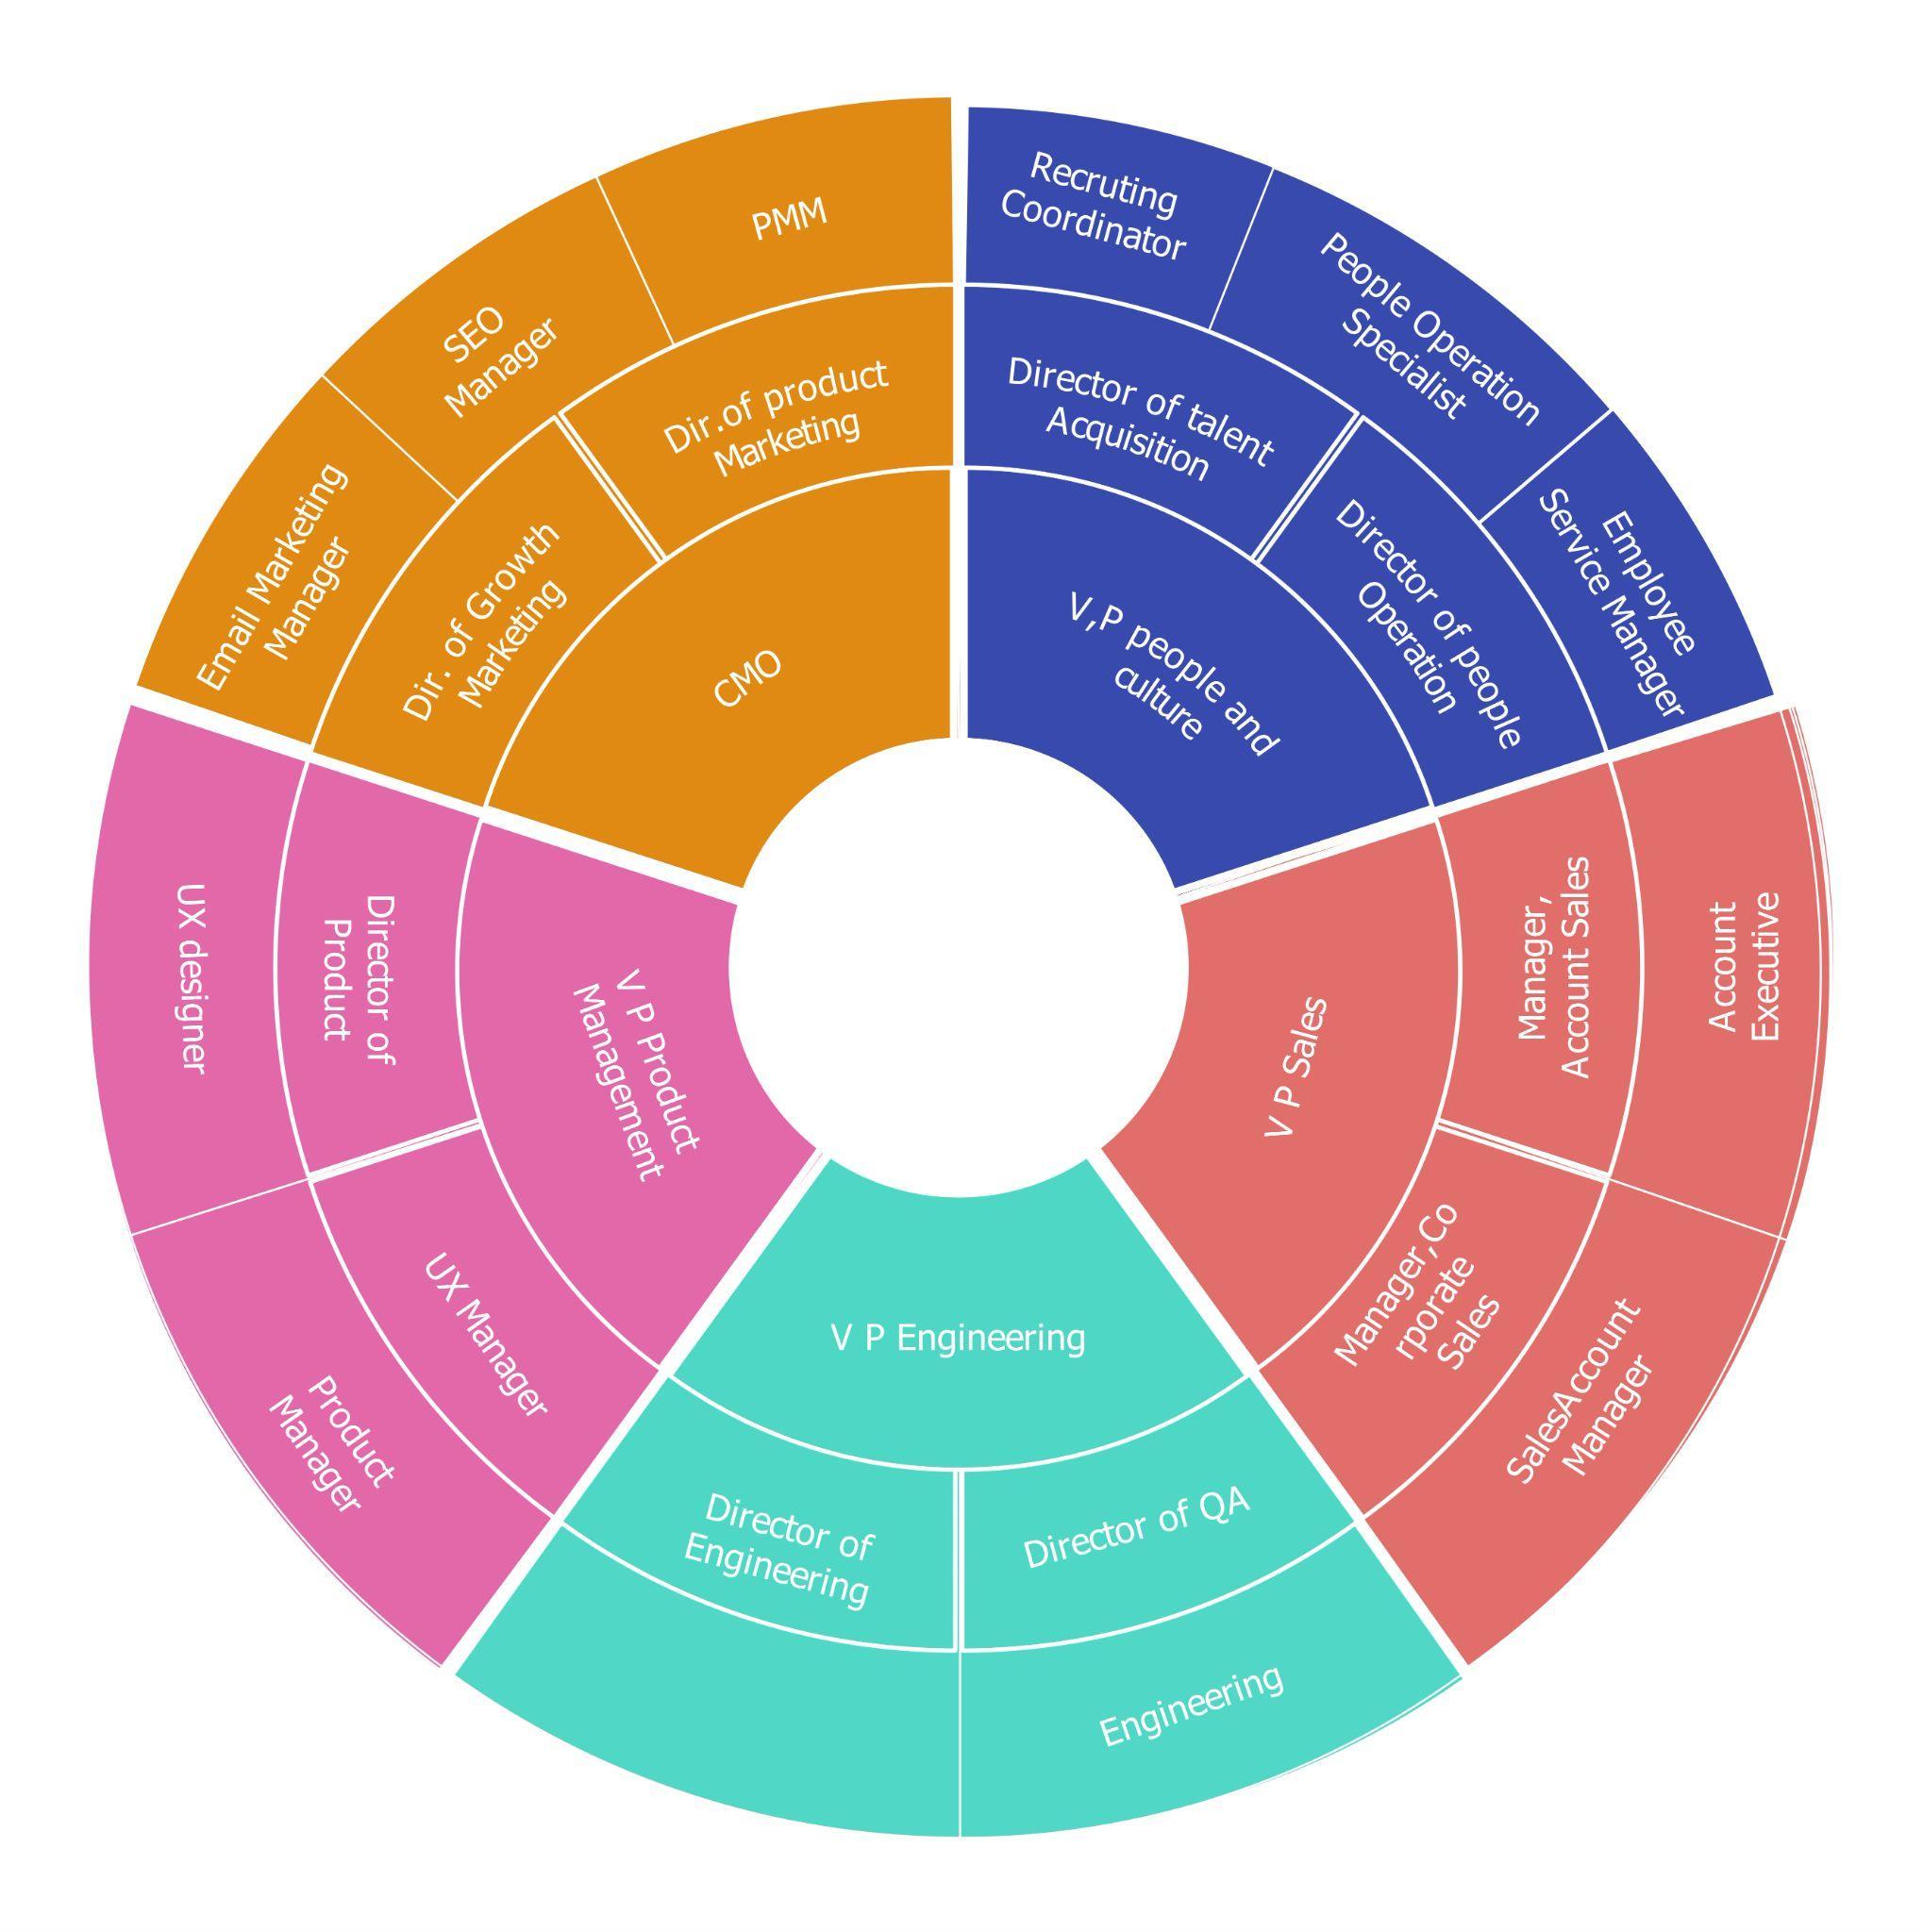
A circular layout emphasizes the relationship between central leadership and surrounding teams. Use it for an overview or presentation, but label the rings and connectors so the visual arrangement does not obscure formal reporting lines.
5. Functional Organization Chart
A functional chart groups roles into departments such as finance, operations, and marketing. Use it for departmental planning and onboarding. Replace each sample function with your actual department and confirm its manager and reporting path.

6. Starbucks Organizational Chart
This Starbucks-named template is an illustrative company example. Use it to plan the relationship between corporate functions and operational teams, replacing sample labels with verified roles. It is not a verified current Starbucks reporting chart.

7. Flat Organizational Chart

AI Diagram Generator
Enter your prompt. Upload files if needed. Generate diagrams, charts, or slides instantly.


What is the best way to use 7 org chart examples for better organization?
An organizational chart maps roles, teams, reporting relationships, and sometimes communication paths. This page helps you compare common org chart structures and decide which one fits your company size, management style, and planning task.
Who should use 7 org chart examples for better organization?
Best for HR teams, managers, founders, consultants, and students who need to explain how people and departments are organized.
Can I customize these examples in EdrawMax?
Yes. You can open an editable template in EdrawMax, adjust text, symbols, layout, colors, and dimensions, then export it for documents, presentations, or sharing.