




- What is A Data Flow Diagram
- The Data Flow Diagram Examples
- Online Data Flow Diagram Maker
- Key Takeaways
1. What is A Data Flow Diagram
A data flow diagram (DFD) shows how data moves between external entities, processes, and data stores. The examples below cover student registration, car rental, order processing, a bookstore, and DVD borrowing, with guidance on choosing and adapting each view.
Use four consistent elements: external entities, processes, data stores, and labeled data flows. A process should have meaningful inputs and outputs. Data should pass through a process when moving between a store and an external entity; not every process must connect directly to an external entity.
2. The Data Flow Diagram Examples
Choose a context diagram to show the whole system as one process, or a decomposed DFD to show the processes inside it. Some sources call a context diagram Level 0 while others reserve Level 0 for its first decomposition, so name the view and state your numbering convention.
A DFD models information movement rather than network topology or the timed sequence of actions in a flowchart. For a logical DFD, describe what the business does; for a physical DFD, show how people, software, or storage implement it. Balance the external inputs and outputs when expanding a process into a lower-level view.
 |
 |
 |
| Data Flow Diagram Example | Level 1 Data Flow Diagram | Level 0 Data Flow Diagram |
 |
 |
 |
| Physical Data Flow Diagram | Context Data Flow Diagram | Logical Data Flow Diagram |
 |
 |
 |
| Data Flow Diagram Online | Network Data Flow Diagram | Simple Data Flow Diagram |
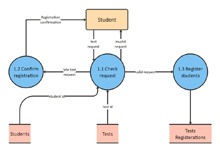
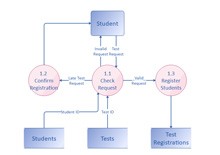
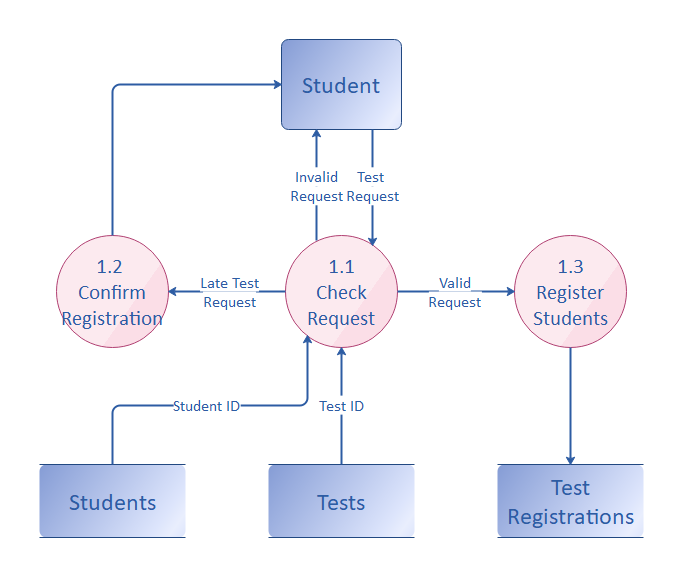
Example 1: Student Test Registration DFD
This decomposed student-registration example separates checking a request, confirming registration, and registering students. Students, tests, and registrations are represented as stored data. When adapting it, label each request and confirmation and check which process reads or updates each store.
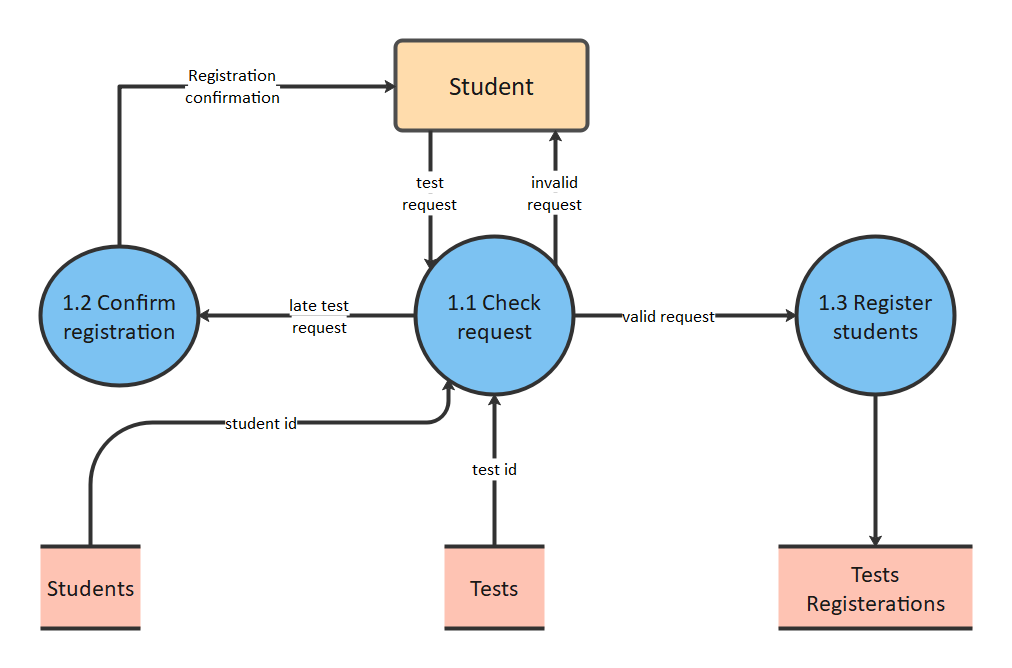 Source:EdrawMax Online
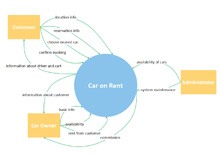
Example 2: Car Rental Context Diagram
This car-rental context diagram represents the service as one process interacting with Customer, Car Owner, and Administrator. Use this view to agree on the system boundary and external exchanges before drawing the internal booking, payment, or vehicle-management processes.
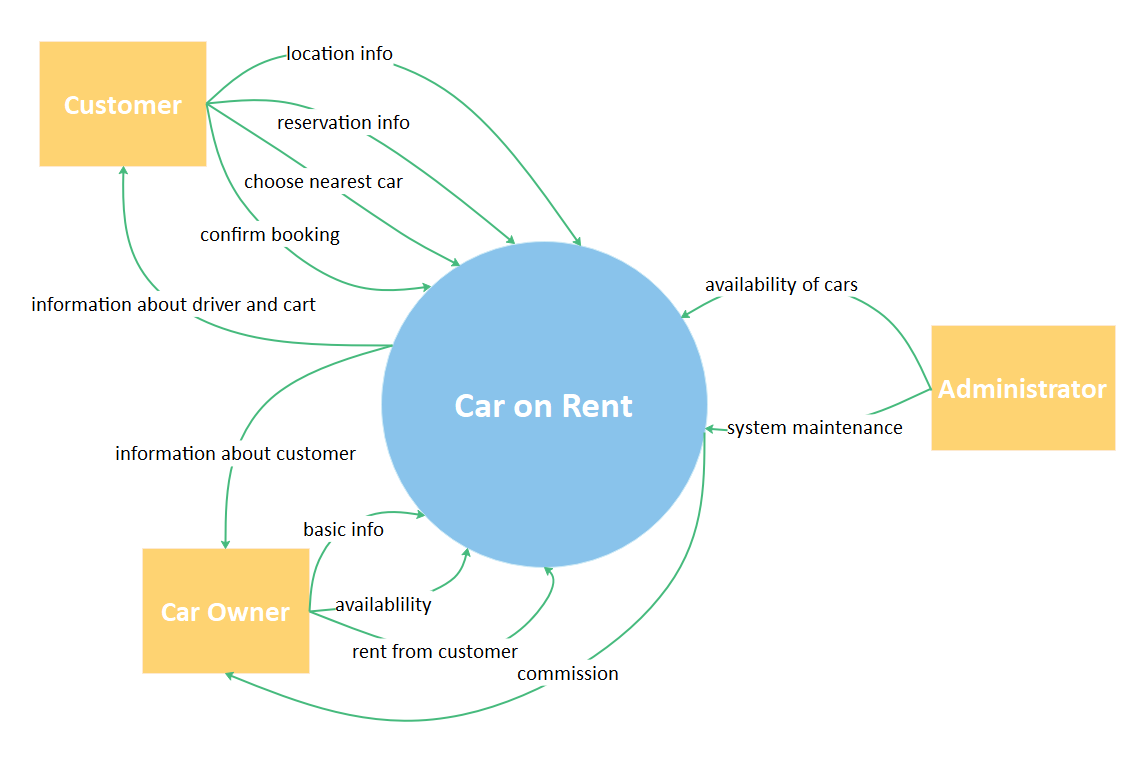 Source:EdrawMax Online
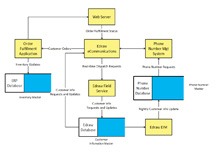
Example 3: Order Fulfillment and Communication DFD
This example connects order-fulfillment and communication functions with supporting databases and ERP information. Use it to review how requests and operational data move between application components. Replace the sample labels with the actual data exchanged by your own system.
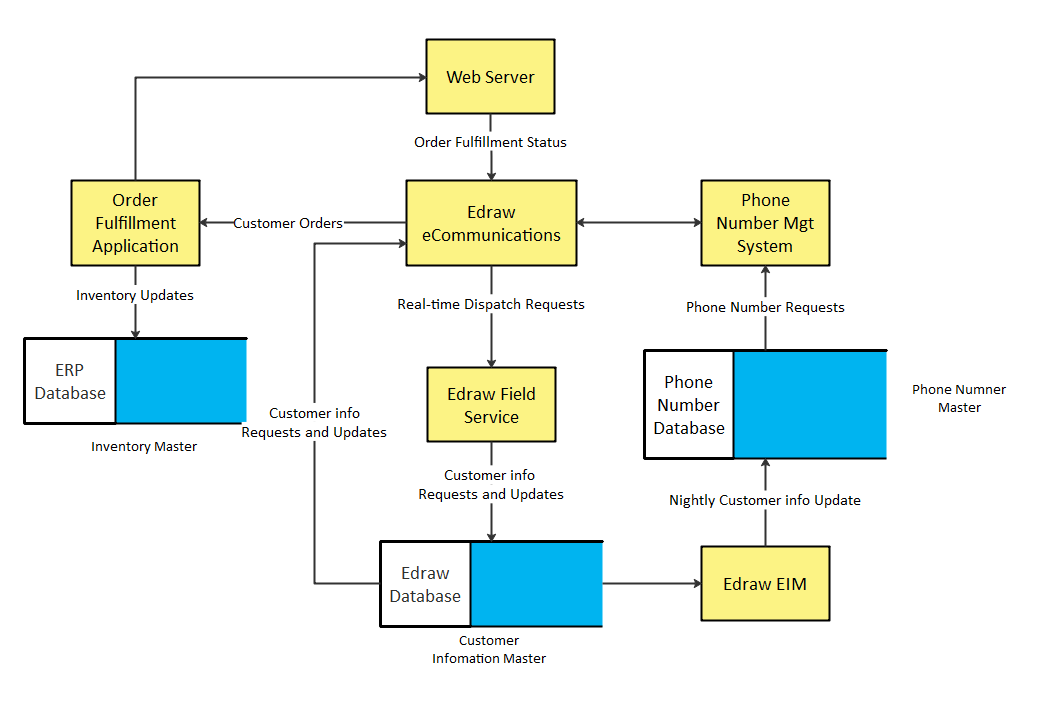 Source:EdrawMax Online
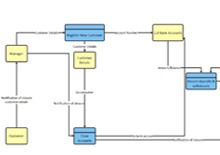
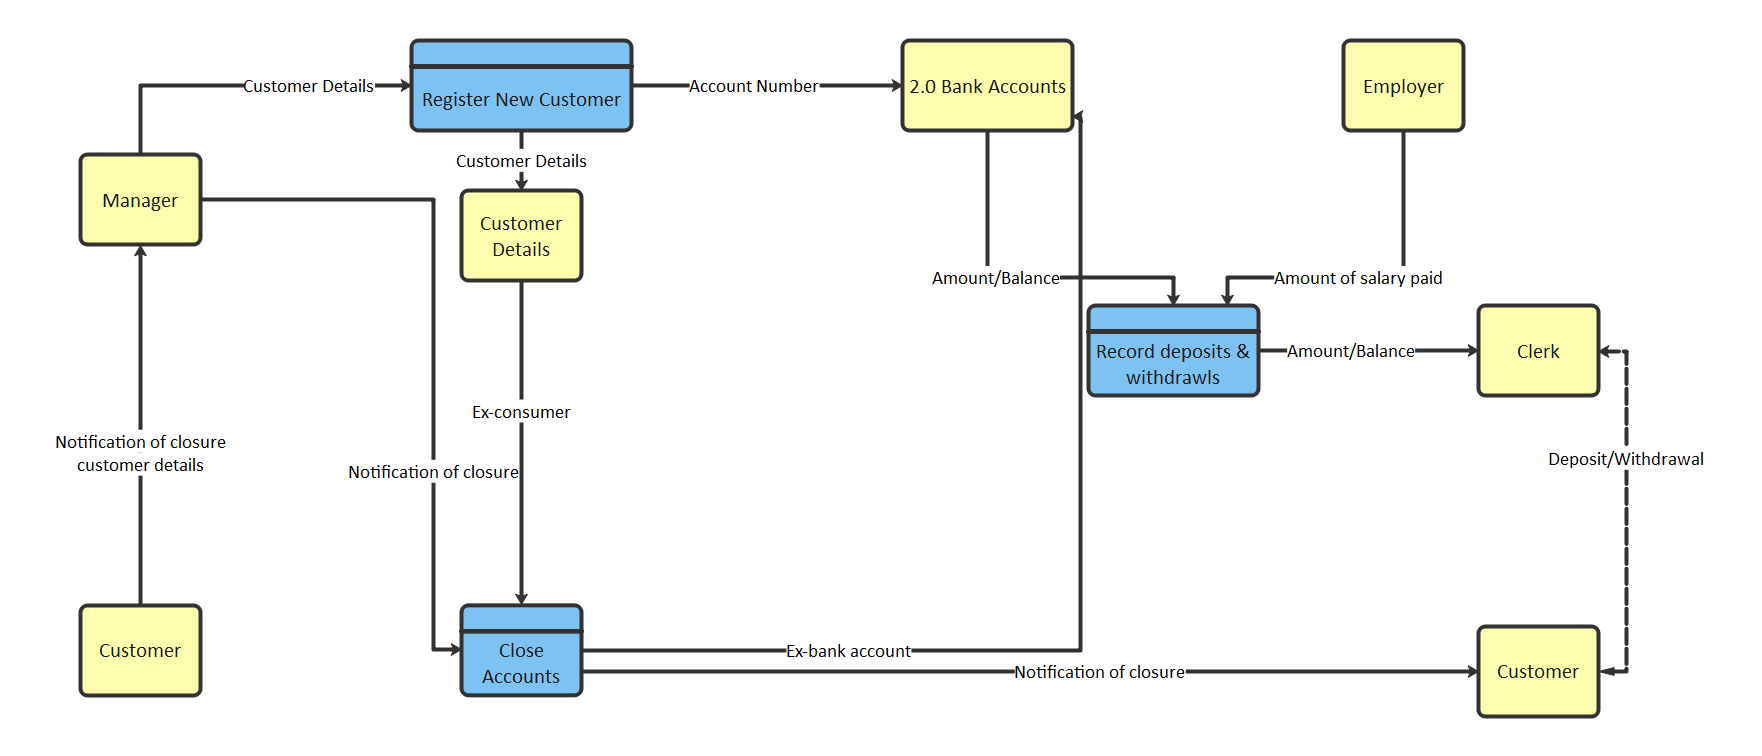
Example 4: Order Processing and Shipping DFD
This order-processing example includes registering a customer, selecting items, recording dispatch, and arranging shipping. It distinguishes participants such as customers and suppliers from the processes and stores handling their information. Trace an order through the labeled flows to check for missing inputs or outputs.
 Source:EdrawMax Online
Example 5: Decomposed Student Registration DFD
This student-test registration view contains multiple internal processes and data stores, so it is a decomposed DFD rather than a single-process context diagram.
Use the example to check how student requests become confirmed registrations. When adapting the template in EdrawMax, keep the external exchanges consistent with your higher-level diagram.
 Source:EdrawMax Online
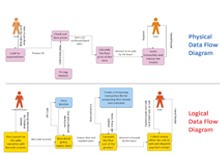
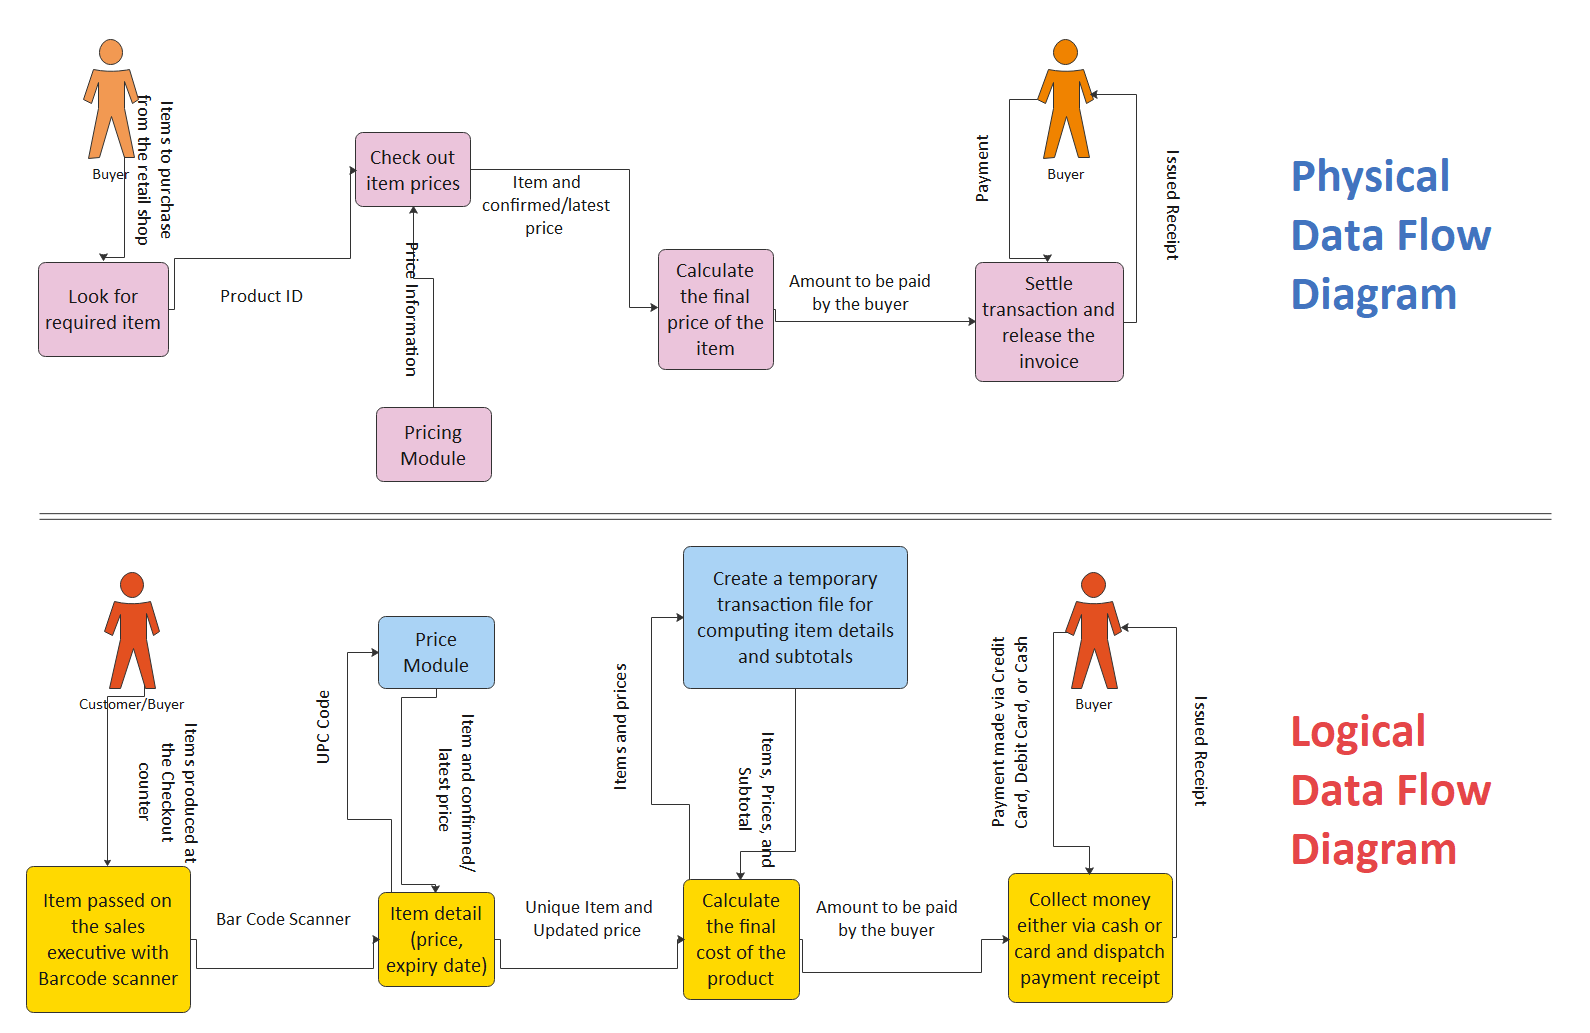
Example 6: Logical vs. Physical Data Flow Diagrams
The paired diagrams compare a logical view of what processing occurs with a physical view of how it is implemented. Use the logical view to agree on business requirements, then refine the physical view with actual roles, systems, and storage. Keep their data inputs and outputs consistent.
 Source:EdrawMax Online
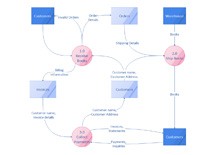
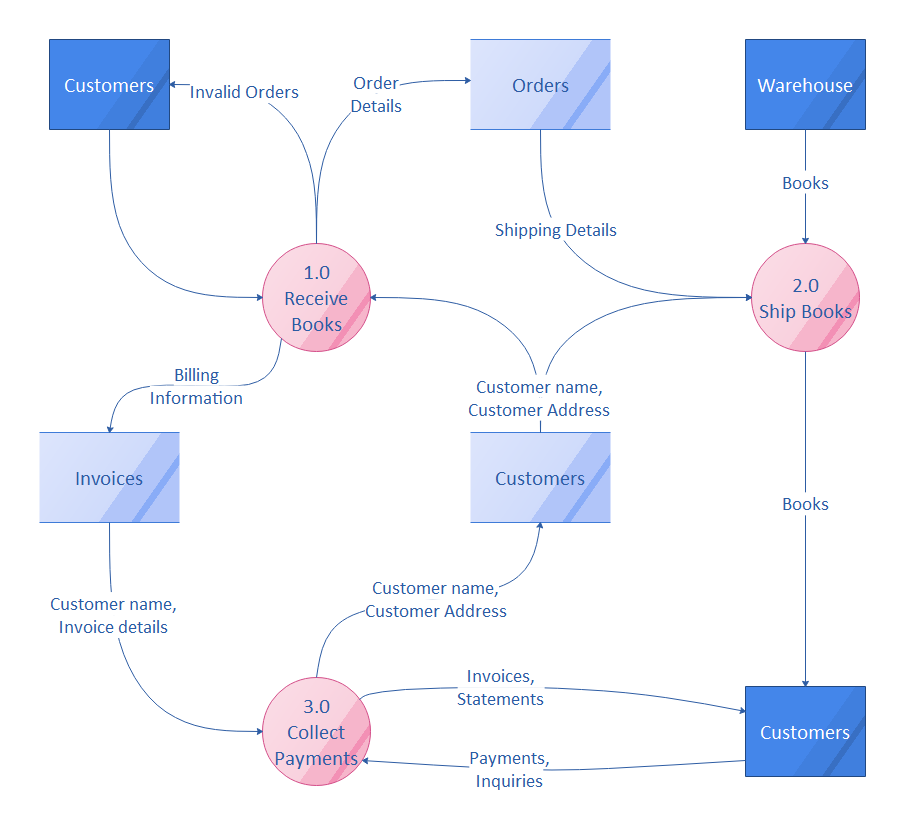
Example 7: Bookstore Data Flow Diagram
This bookstore example shows information associated with receiving books, shipping books, and collecting payments. Orders, invoices, customers, and warehouse information connect the activities. Adapt the stores and flow labels to your sales and inventory rules rather than using the diagram as a step-by-step shipping schedule.
 Source:EdrawMax Online
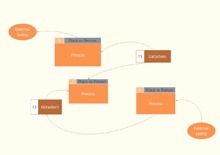
Example 8: SSADM Data Flow Notation
This generic example illustrates SSADM-style external entities, processes, data stores, and data-flow arrows. Use it as a notation reference, then replace generic labels with verb phrases for processes and specific names for data. Apply one symbol convention consistently.
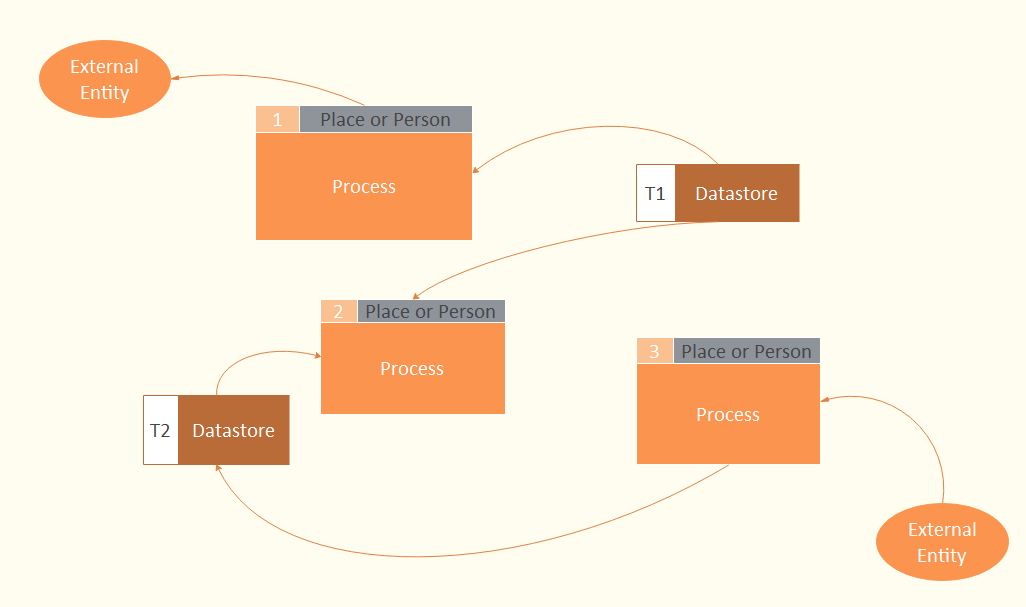 Source:EdrawMax Online
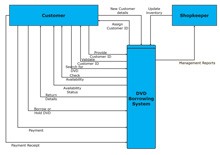
Example 9: DVD Borrowing Context Diagram
This single-process context diagram shows exchanges between a DVD-borrowing system, a Customer, and a Shopkeeper, including borrowing, returns, payments, and receipts. Use it to define scope; create a separate decomposed view if you need to show stock checks or loan-record updates.
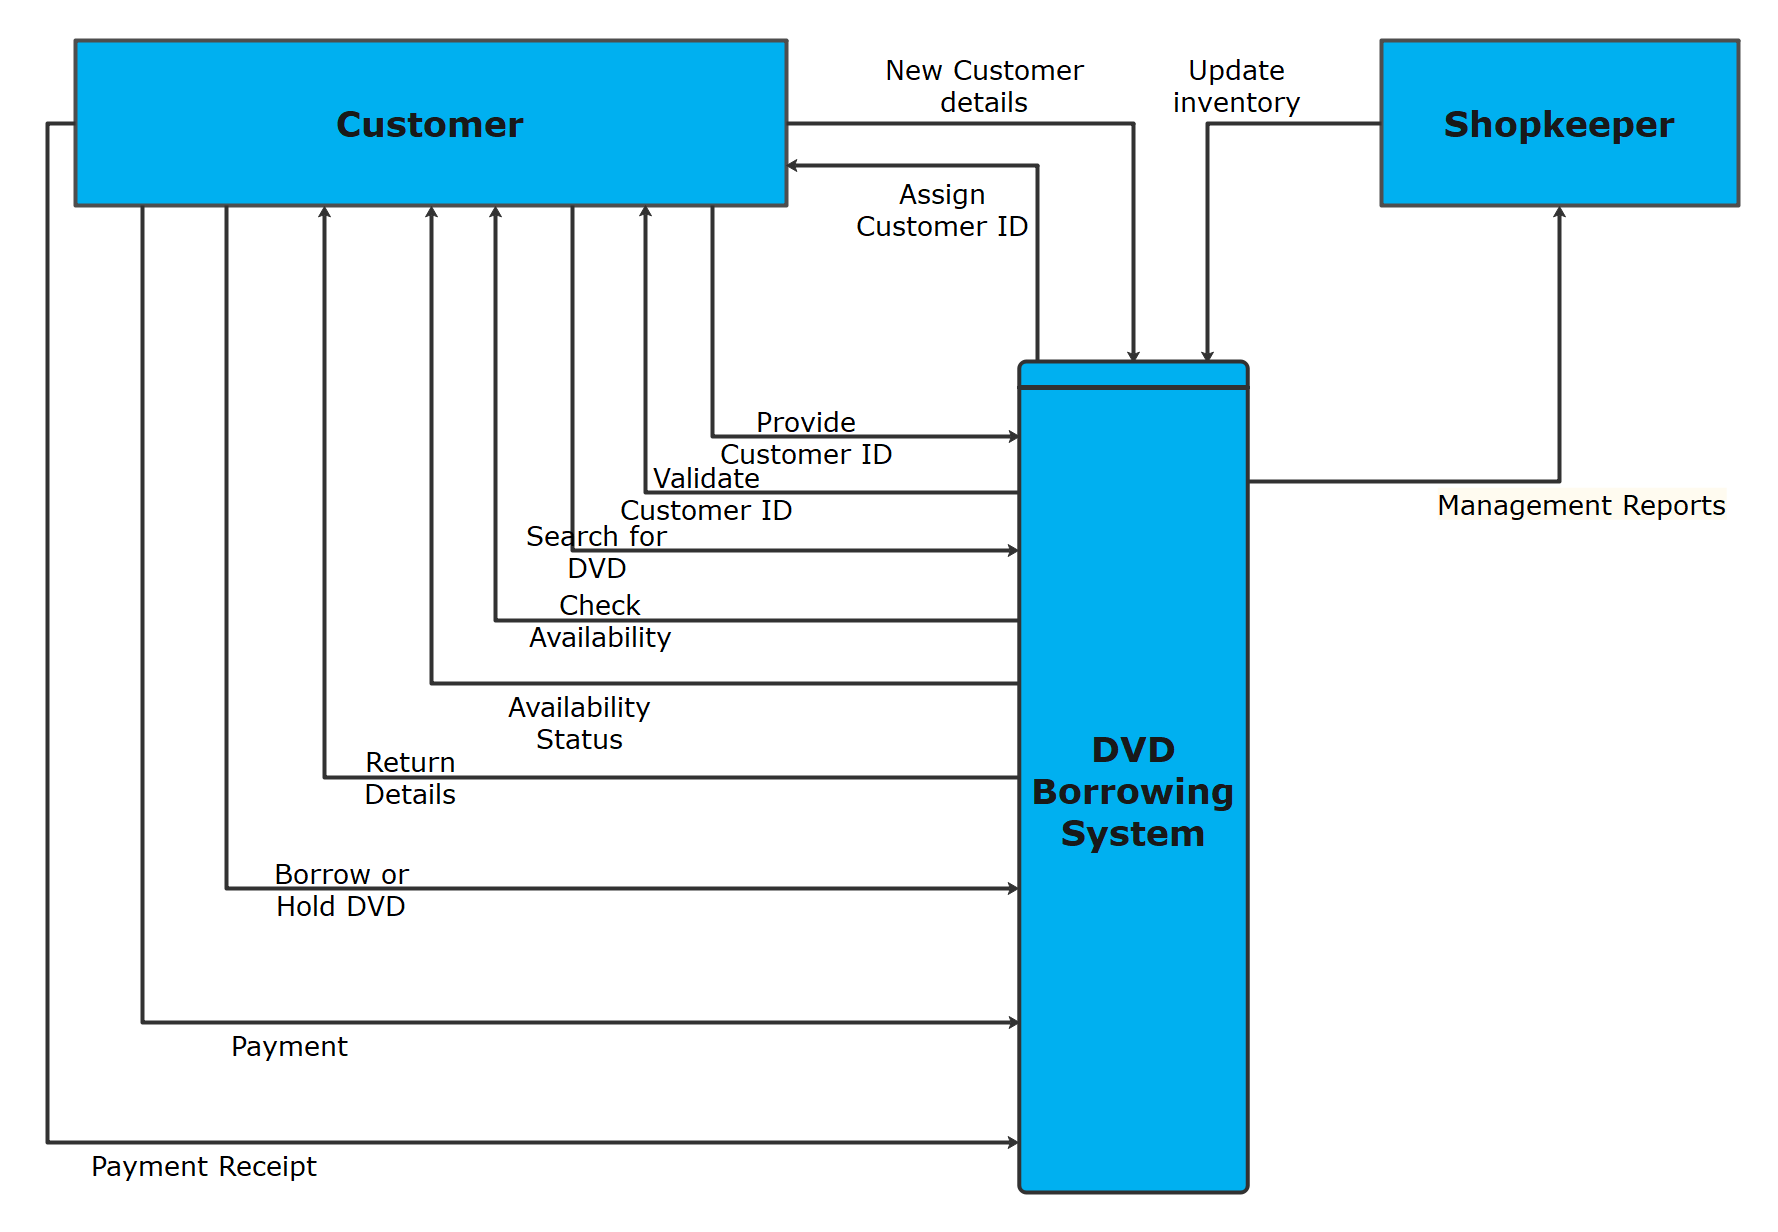 Source:EdrawMax Online
3. Online Data Flow Diagram Maker
Use EdrawMax Online to customize a data flow diagram template or build a DFD from shapes. Start with the system boundary, add external entities and processes, then connect data stores with labeled flows.
Choose a template at the appropriate level of detail, rename the sample elements, and review every arrow with stakeholders. Keep context and decomposed diagrams consistent before sharing the final version. EdrawMax Online. EdrawMax Template Gallery.
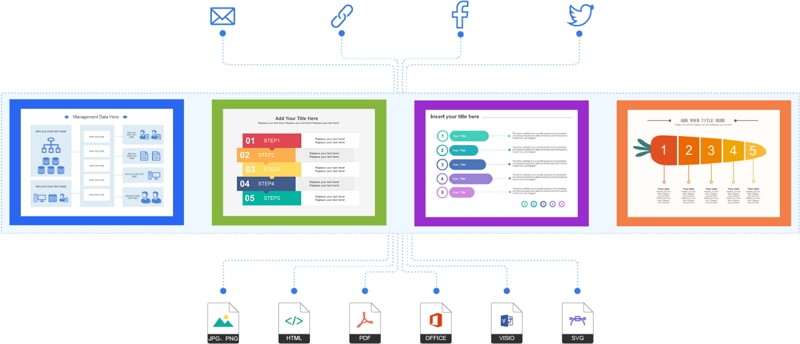
Why Choose EdrawMax Online
- Create over 280 diagram types
- Supports team collaboration
- Personal cloud & data protection
- Print, share and download
- Powerful template community
 Get 500 free AI tokens
4. Key Takeaways
A useful DFD makes information movement explicit. Choose a context or decomposed view, apply consistent notation, and check that processes have meaningful inputs and outputs. A DFD supports requirements analysis; it does not generate code or validate a system by itself. Use the data flow diagram guide for the drawing workflow.
AI Diagram Generator
Enter your prompt. Upload files if needed. Generate diagrams, charts, or slides instantly.





 (AI & Web)