About Taxonomy Chart Template
This taxonomy chart template makes a complex topic easier to explain by showing its structure, relationships, and key labels in a cleaner visual format.
What the diagram explains
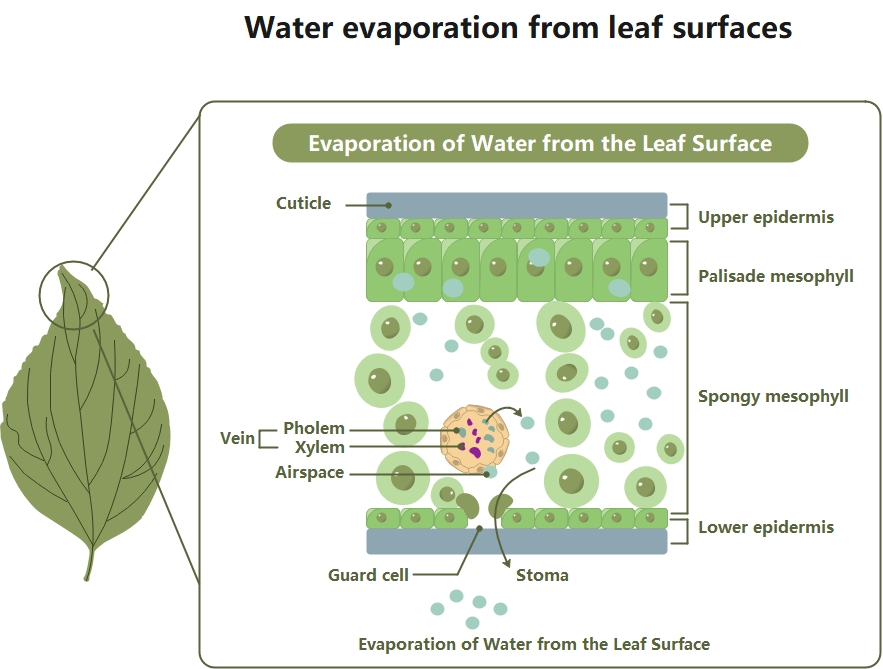
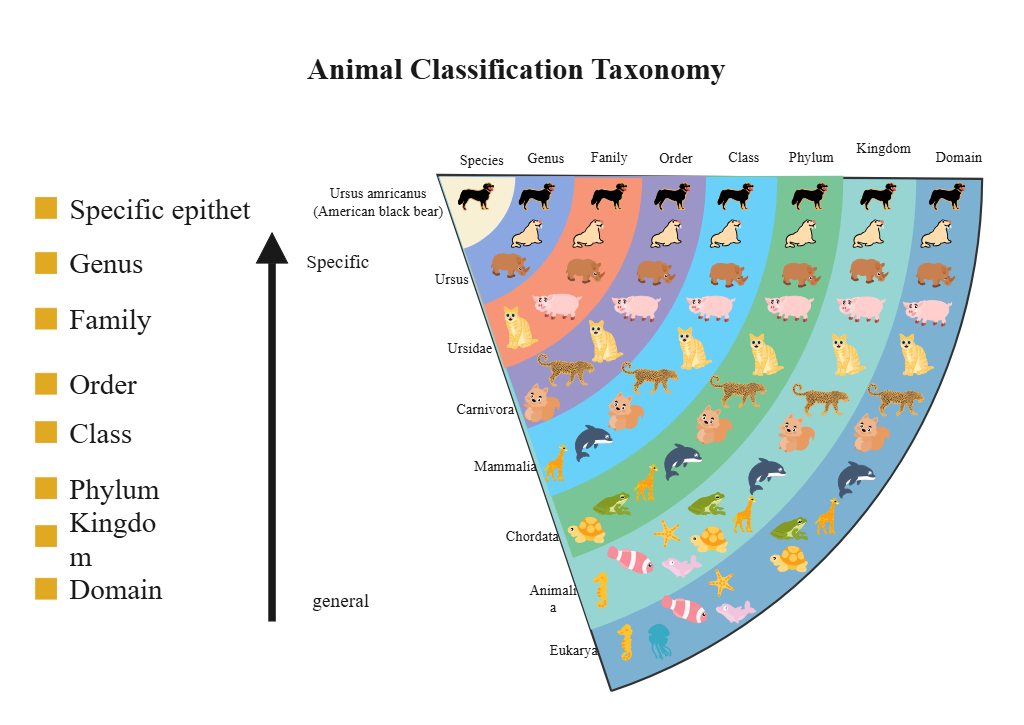
The template presents the topic through labeled parts, visual relationships, and supporting structure so readers can understand it more quickly.
- It is a visual diagram template that explains a topic through labeled parts, structural relationships, and organized information that is easier to study
- Students, teachers, trainers, and presenters can use it when they need a clearer way to explain scientific or technical content
- It helps readers understand the topic faster by turning complex relationships into a visual structure that is easier to follow and remember
How the visual improves learning
A diagram makes complex information easier to review because users can see how parts connect instead of reading dense explanation only.
- Supports clearer explanation of the main topic
- Makes the structure easier to scan and discuss
- Can be edited for teaching, planning, or presentation
Where this template is useful
It works well for teaching, revision, presentations, and science communication that needs both accuracy and readability.
- Useful for visual communication
- Easy to adapt to different scenarios
- Helps turn complex content into a cleaner page asset
FAQs about this Template
-
What is a taxonomy chart?
A taxonomy chart is a structured visual or planning reference used to organize a topic more clearly. It helps readers understand the main idea, relationships, or steps involved without relying only on long-form text explanation.
-
What should a taxonomy chart include?
A taxonomy chart should include the most important sections, labels, relationships, or checkpoints needed to explain the topic properly. The right content depends on the use case, but the structure should always improve clarity and make the subject easier to follow.
-
How do you create a taxonomy chart?
To create a taxonomy chart, define the purpose first, identify the main sections, and arrange them in a logical order. A good result should make the topic easier to explain, review, or present rather than simply filling space with generic blocks.
-
Why is a taxonomy chart important?
A taxonomy chart is important because it improves communication and understanding around a specific subject. A clear structure makes information easier to explain, compare, and apply, especially when the topic includes multiple parts or decision points.