


Data visualization plays a critical role in enabling businesses to interpret, analyze, and communicate complex data effectively. Visio is one of the best tools for data visualization. Here, we will discuss the importance of data visualization in business, the benefits of using Visio for data visualization, best practices for data visualization Visio and more.
In this article
Part 1. The Importance of Data Visualization in Business
Data visualization refers to the graphical representation of information and data. It is a powerful tool that allows businesses to interpret and understand complex data sets, identify patterns, trends, and more. Data visualization plays a crucial role in enabling decision-makers to make informed decisions, identify opportunities, and address challenges.
Part 2. Creating Data Visualizations in Visio
Microsoft Visio is a powerful tool for creating data visualizations. Visio provides a wide range of features and functionalities that support the creation of diverse visualizations.
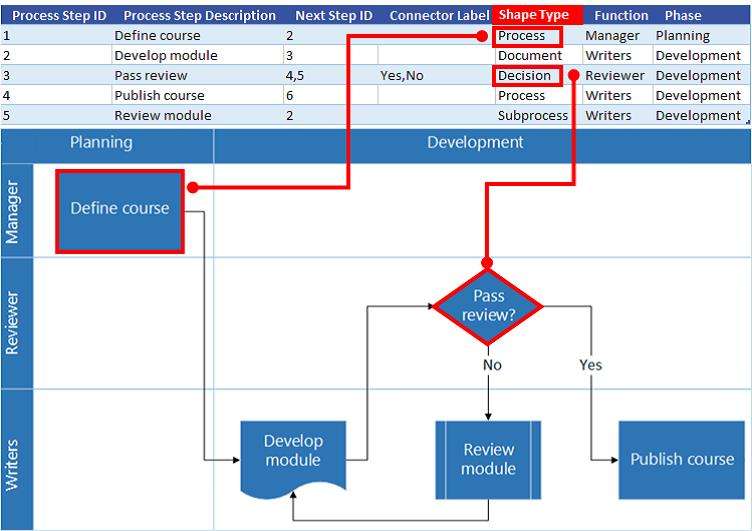
- Selecting the Appropriate Visualization Type: The first step in creating data visualization Visiois to determine the most suitable visualization type for the data at hand. Visio offers a variety of templates and shapes that can be used to create different types of visualizations, such as process flowcharts, network diagrams, and organizational charts.
- Importing Data into Visio:Visio allows users to import data from external sources, such as Excel spreadsheets, databases, and other data sources. This feature enables users to leverage existing data sets and create visualizations based on real-time or historical data.
- Customizing Visual Elements:Visio provides a range of customization options for visual elements, including colors, shapes, and styles. Users can tailor the appearance of their visualizations to align with their brand guidelines or to enhance visual clarity and impact.
Part 3. Best Practices for Data Visualization in Visio
The use of Microsoft Visio for data visualization offers a range of benefits for businesses seeking to communicate complex information. Visio's features and capabilities enable users to create compelling visualizations.
- Versatility:Visio is a versatile tool that supports the creation of diverse visualizations, including flowcharts, diagrams, floor plans, and organizational charts. Its flexibility makes it suitable for a wide range of data visualization needs across different industries and business functions.
- Integration with Microsoft Office Suite:Visio seamlessly integrates with other Microsoft Office applications, such as Excel, PowerPoint, and Word. This integration enables users to import data from Excel, embed visualizations in PowerPoint presentations, and export visualizations to Word documents, enhancing the overall workflow and productivity.
- Ease of Use:Visio offers a user-friendly interface and intuitive tools that make it easy for users to create and customize visualizations. Its drag-and-drop functionality, pre-built templates, and smart shapes streamline the visualization creation process, even for users with minimal design or technical expertise.
When creating data visualization Visio, it is essential to adhere to best practices that ensure the clarity, accuracy, and effectiveness of the visualizations.
- Define Clear Objectives:Before creating a data visualization in Visio, it is important to define the objectives and key messages that the visualization should convey. Understanding the purpose of the visualization will guide the selection of the appropriate visualization type and the inclusion of relevant data.
- Choose the Right Visualization Type:Different types of data lend themselves to different visualization formats. It is crucial to select the most suitable visualization type in Visio that effectively represents the data and aligns with the intended message.
- Simplify and Focus:Effective data visualizations are clear, concise, and focused on conveying specific insights. In Visio, it is important to simplify the visual elements and avoid cluttering the visualization with unnecessary details.
Part 4. Making a Diagram Using Wondershare EdrawMax
Wondershare EdrawMax stands out as the best diagramming tool due to its extensive range of features and user-friendly interface. With its vast library of templates, shapes, and symbols, users can easily create professional diagrams for any purpose. Its versatility, ease of use, and powerful editing capabilities make it a top choice for professional diagramming needs. Here are the steps to create a flowchart using the tool:
Step 1: To access all of the tool's features and templates, including the flowchart templates, start by logging into your EdrawMax account.
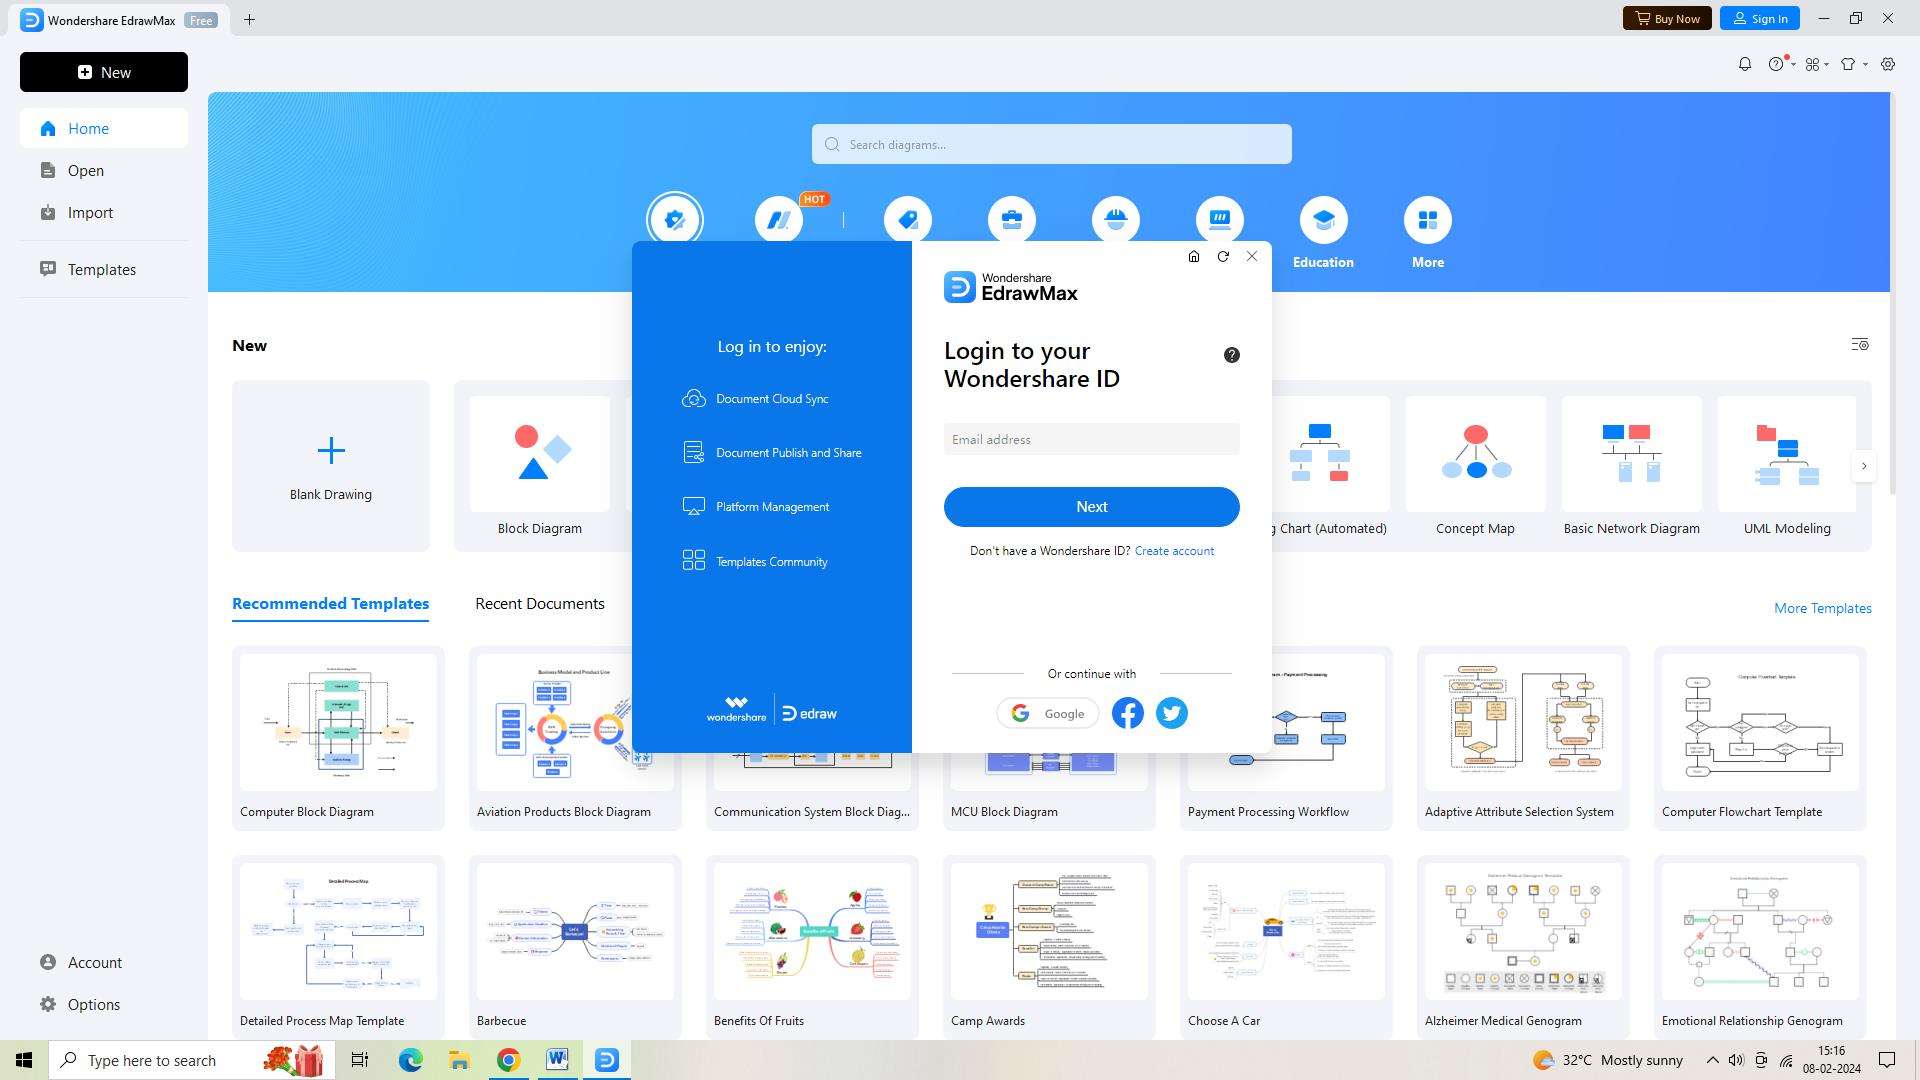
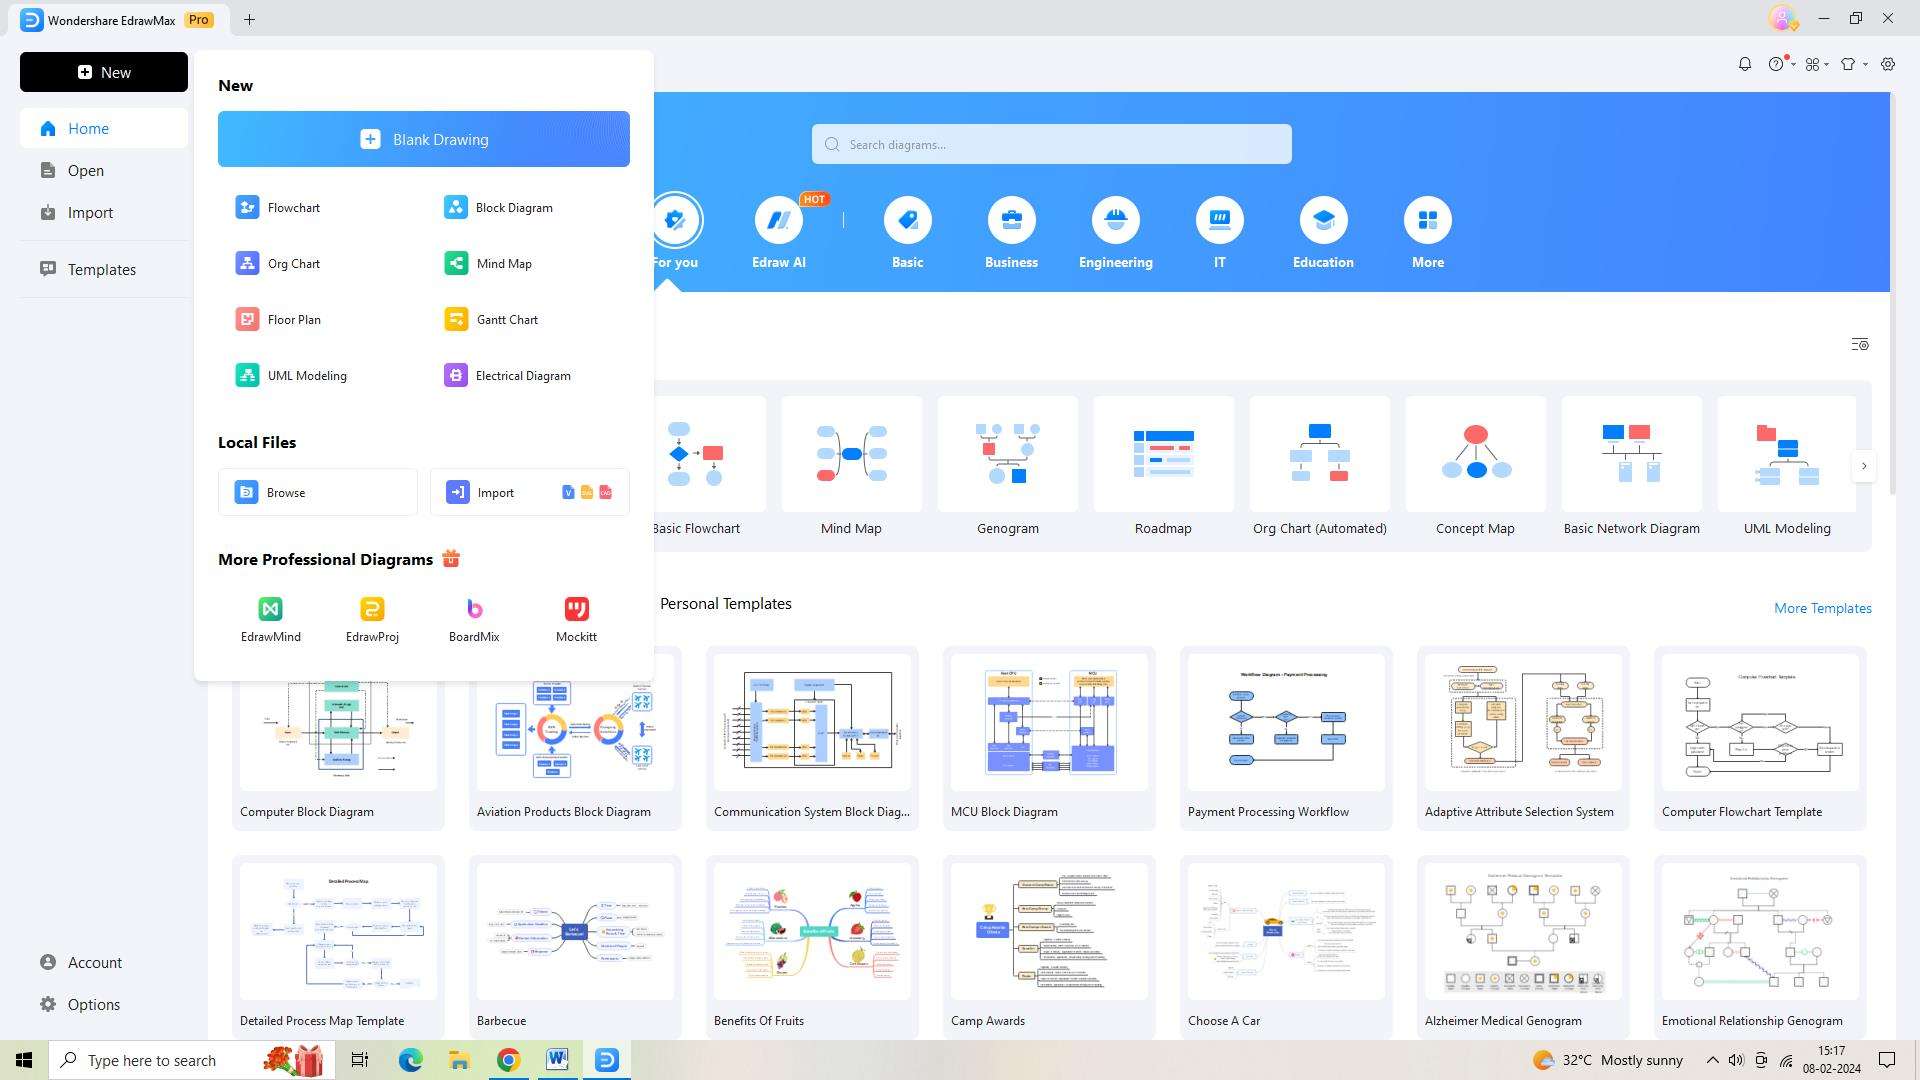
Step 2: The tool's dashboard will appear when you log in. To start a new document, click the "New" button located in the upper left corner of the screen.
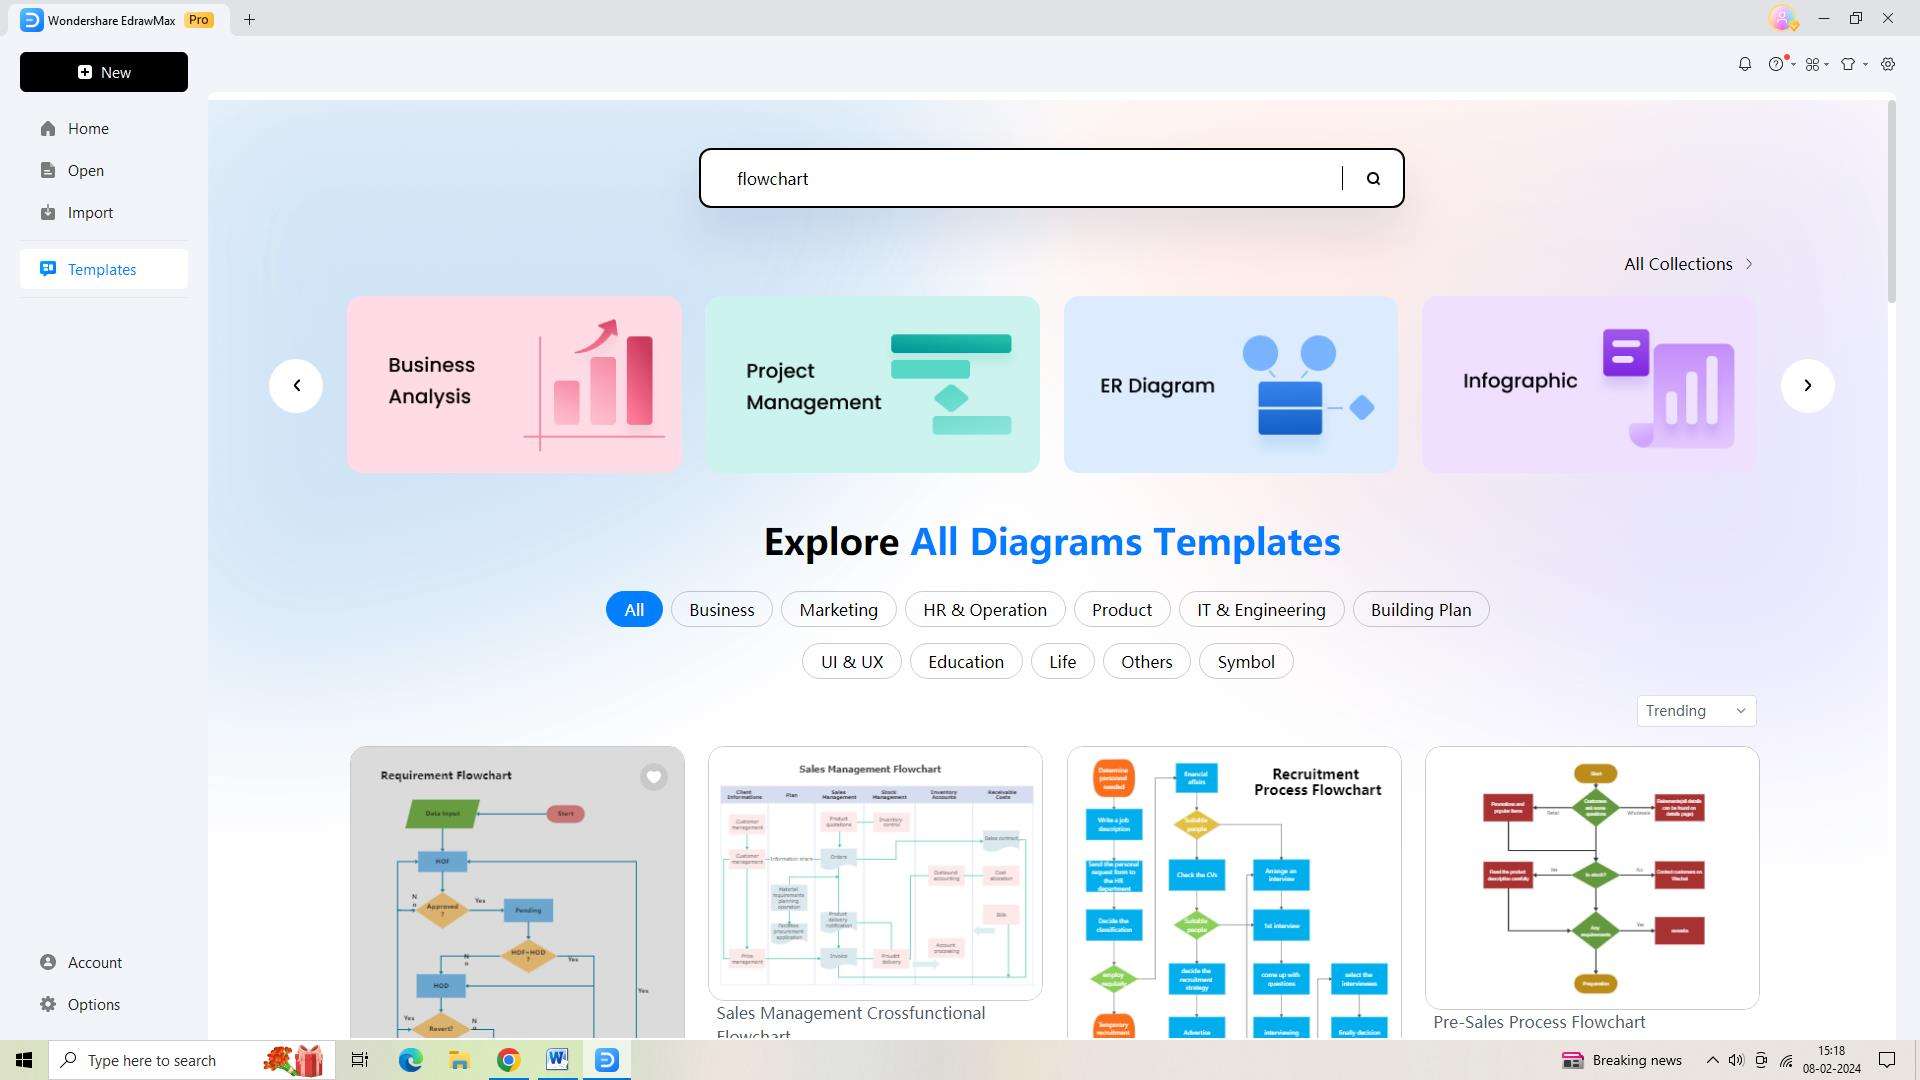
Step 3: Look for a flowchart template by navigating to the "Templates" section of the tool. Click on "Use Immediately" to open the best template.
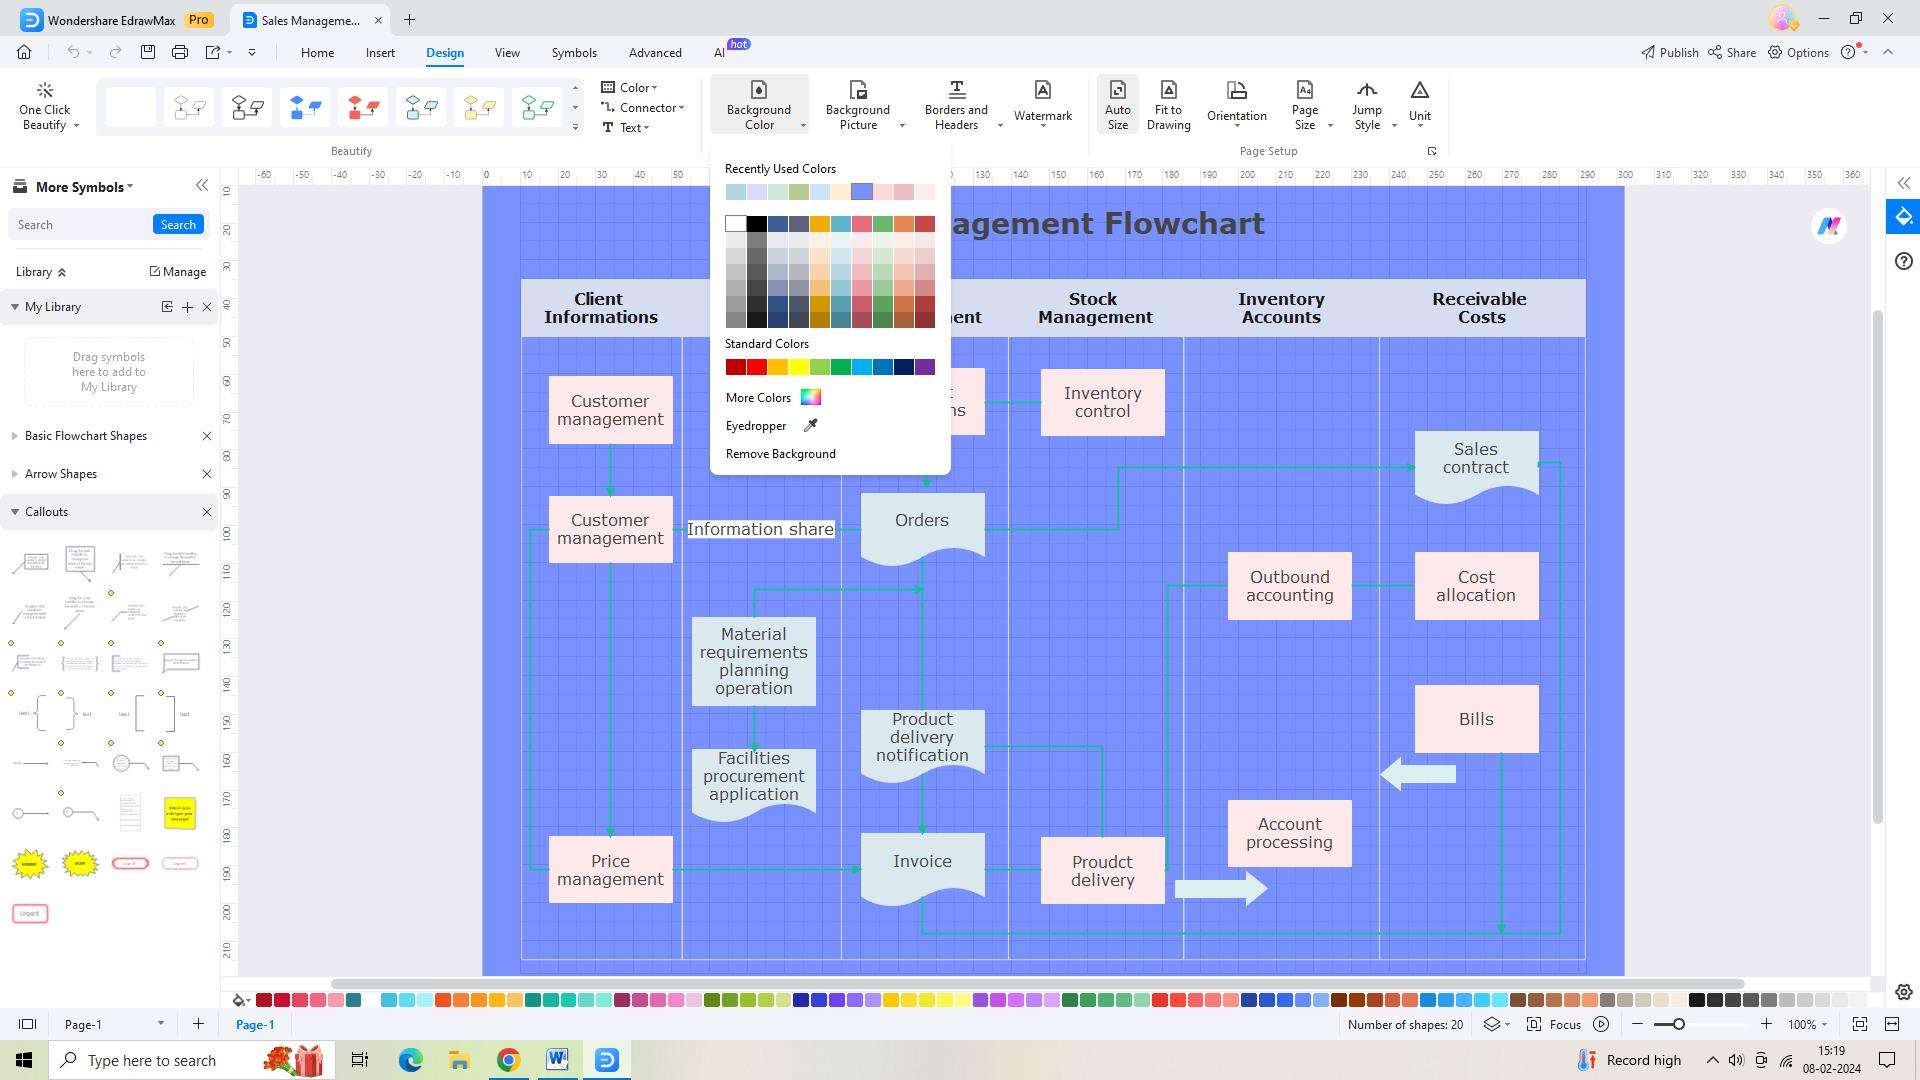
Step 4: Tailor the flowchart to your own needs and specifications. To improve your flowchart's aesthetic appeal, you may change the text size, color, and font.
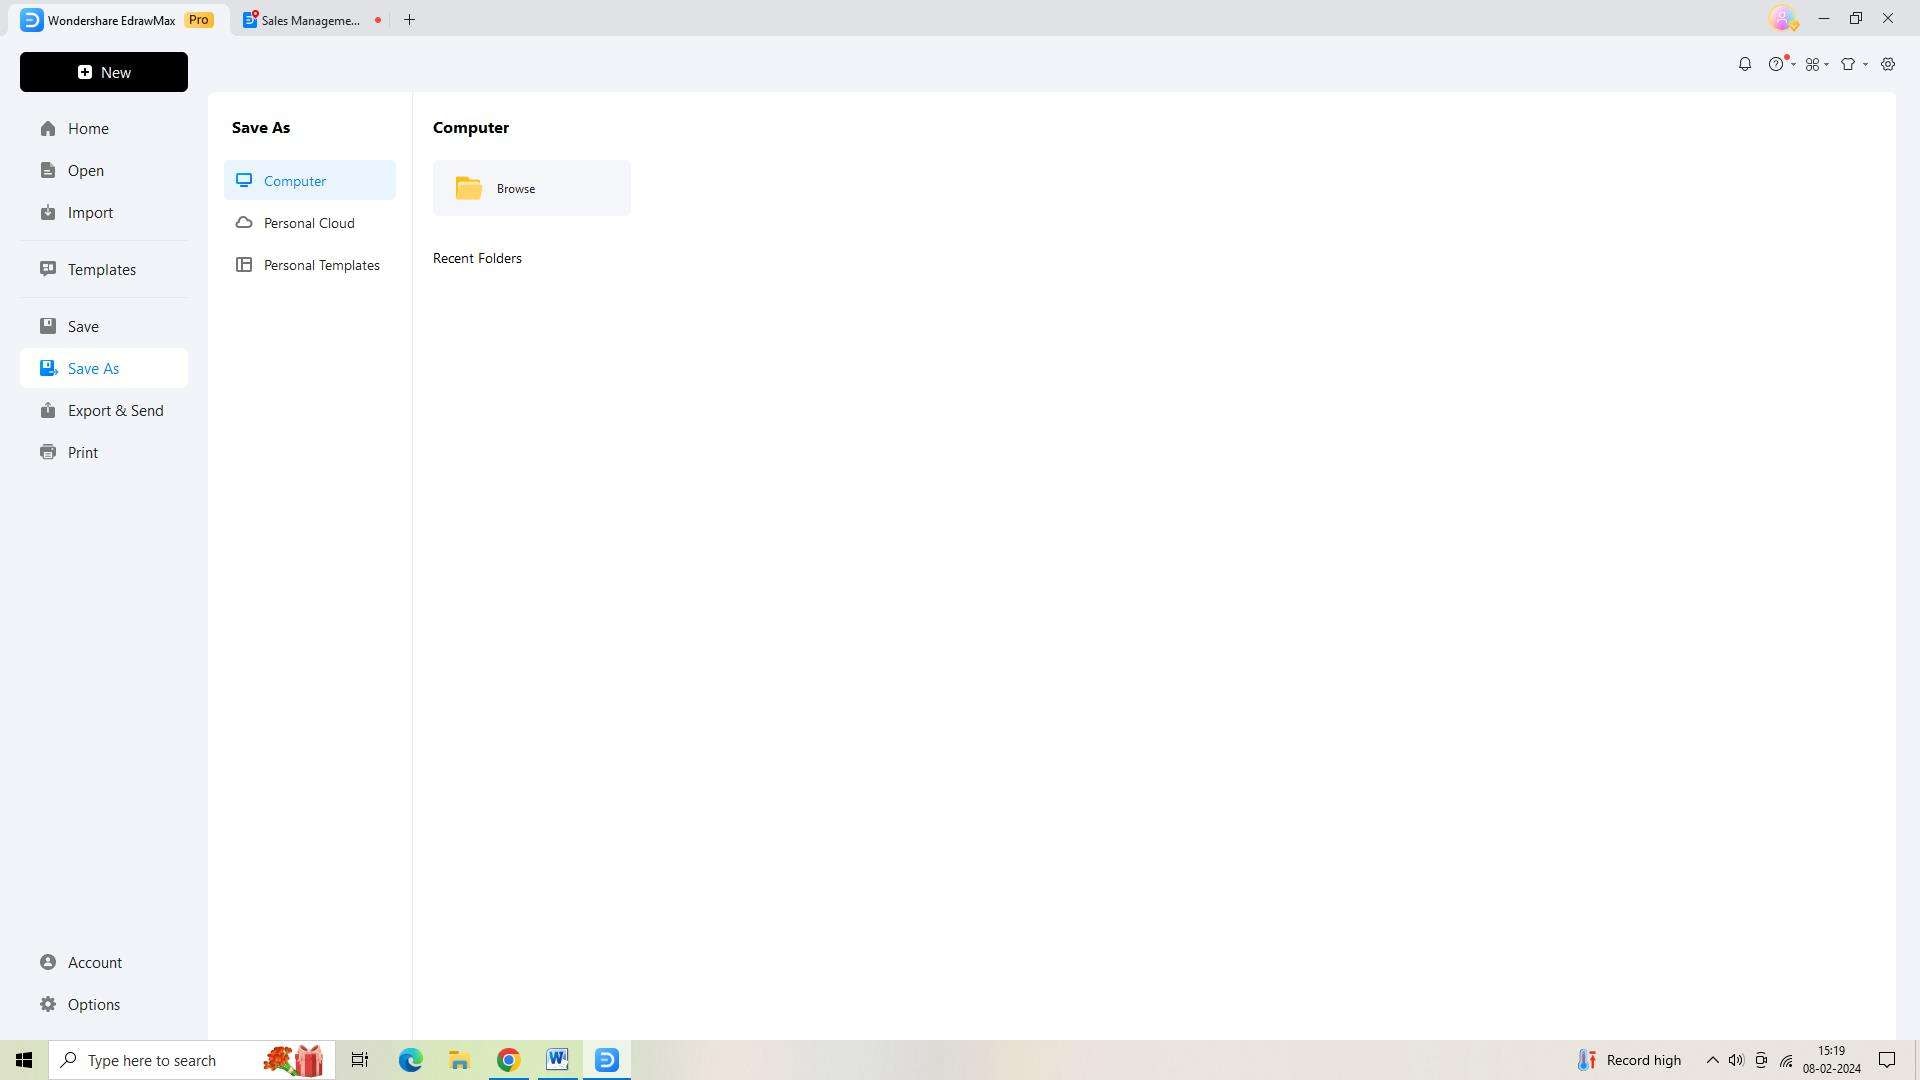
Step 5: Don't forget to save your work when you've finished customizing. To save your flowchart, look for the "Save As" option in the left navigation bar and click on it. As an alternative, you can utilize the shortcut key Ctrl+S.
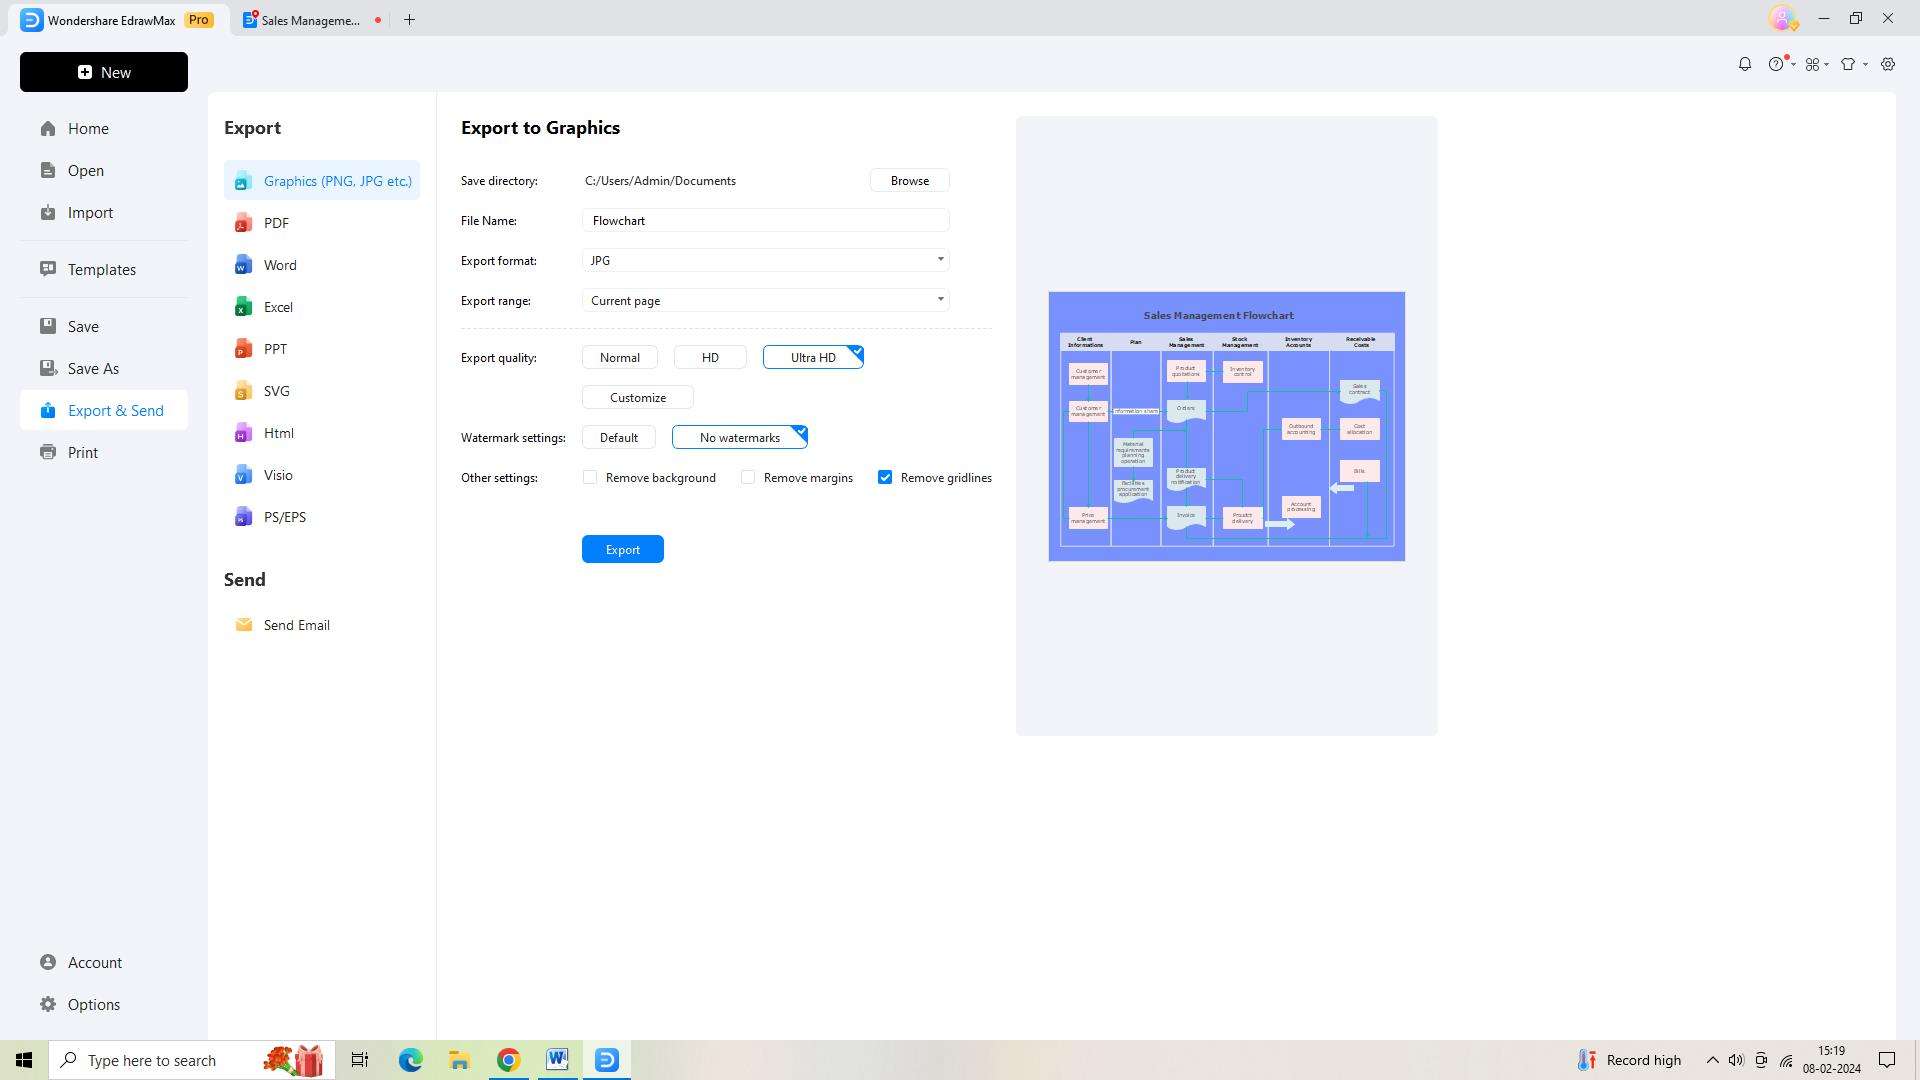
Step 6: Export your flowchart at last so that you may share it with others. Select from a variety of formats, including PDF, JPEG, and more, by clicking on "Export and Send" in the left navigation pane.
Conclusion
Microsoft Visio offers a comprehensive platform for creating data visualizations that support decision-making, analysis, and communication. By utilizing the features and best practices discussed here, businesses can harness the power of data visualization Visio to gain valuable insights, drive informed decisions, and achieve their strategic objectives.

