


Value stream mapping is a lean management technique used to analyze, design, and manage the flow of materials and information required in bringing a product or service to a customer. It helps to identify waste and opportunities for improvement in workflow processes. Visio is a popular software tool often used to create visual value stream maps.
This article provides an overview of Visio mapping, considerations when choosing mapping software, the mapping process, benefits, EdrawMax as a Visio alternative, and how to use EdrawMax to create a process map.
In this article
Part 1. Overview of Visio Mapping
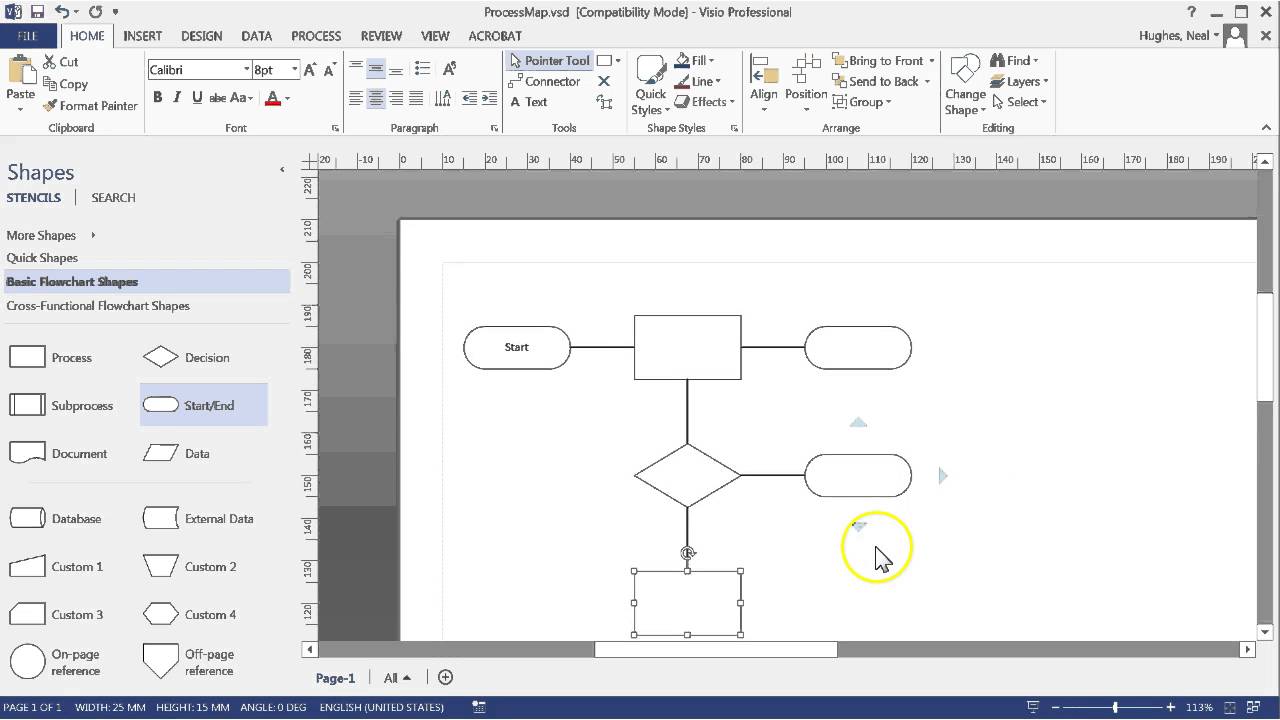
Microsoft Visio is a diagramming and vector graphics application that allows users to visualize, create, and share workflow and process diagrams. It includes built-in templates for creating value stream maps, making it a convenient option.
While Visio offers useful features for process mapping, it also has limitations. It lacks built-in support for calculating metrics or performing value stream analysis. The software focuses more on documentation than analysis. Users need add-ons, formulas, or manual calculations to gain deeper insights from their maps. It’s also one of the more expensive options for process mapping and improvement teams may require multiple licenses.
Part 2. Choosing a Value Stream Mapping Software Visio
When selecting a value stream mapping and analysis software, here are some key factors to consider:
- Ease of use: The interface should be intuitive, with drag-and-drop shapes and connectors. Minimal training should be required.
- Process analysis tools: Look for built-in features like flow metrics, bottleneck identification, and lean metrics calculations. The ability to simulate and compare current and future states is beneficial.
- Collaboration capabilities: Opt for a cloud-based or web-based platform over desktop-only. Choose one with role-based permissions and a tool for gathering team feedback on maps.
- Customization options: Pick a tool that offers industry-specific mapping templates and shape libraries for tailoring maps to your workflows. The ability to create custom shapes and templates boosts flexibility.
The most basic Visio mapping process includes these key steps:
Form an improvement team. Engage frontline employees who know the process best.
- Agree on a process to be mapped. Outline the scope and set mapping goals.
- Gather data. Interview team members and observe the process to collect information. Take measurements.
- Create a current state map. Add process steps, inventory icons, data boxes, and timeline.
- Analyze the current state map. Identify value-added vs. non-value-added steps, waste, and bottlenecks.
- Design an ideal future state map. Streamline the flow, eliminate waste, and balance workflow.
- Implement changes to achieve the future state.
- Review progress and revise maps to drive continuous improvement.
An effective Current State Map in Visio displays process activities, cycle times, inventory levels, and information flows. The Future State Map incorporates changes to address issues, streamline the workflow, and meet targets.
Part 3. Benefits of Visio Mapping
When used strategically, Visio process mapping offers many benefits:
- Visualize workflows: Provides an easy-to-understand diagram of complex processes, interactions, and relationships.
- Identify waste: Highlights non-value-added steps, allowing teams to recognize and eliminate waste.
- Streamline processes: Creates opportunities to simplify process flows and remove inefficiencies.
- Improve flow: Balances workloads, reduce bottlenecks, and improves workflow.
- Enhance communication: Allows for greater input, visibility, and shared understanding across the organization.
- Prioritize improvement efforts: This makes it easy to focus on kaizen events and process redesigns where they will have the most impact.
- Support data-driven decisions: Incorporates measurable process metrics into maps.
Part 4. Creating a Process Mapping Diagram Using EdrawMax
While Microsoft Visio has benefits, it also has limitations for process mapping and analysis. Many lean teams find it worthwhile to evaluate alternatives like EdrawMax.
EdrawMax is an affordable, user-friendly option suitable for both basic and advanced process mapping applications. Key advantages include:
- Works across devices: Windows, Mac, web, iPad
- Has a Visio-like interface with drag-and-drop shapes and connectors
- Contains built-in value stream mapping and flowcharting templates
- Allows for easy customization of maps with different shapes and theme libraries
- Offers shape search and auto-alignment for faster diagramming
- Provides a range of lean management and analysis tools for metrics, waste identification, and more
- Enables real-time collaboration for gathering feedback on maps
- Integrates with Visio and other external data sources
- Is more budget-friendly than Visio with affordable pricing
With robust features and superior price points, EdrawMax emerges as the best Visio alternative for complete value stream mapping and analysis. The software provides the flexibility and tools needed to map processes, uncover waste, redesign workflow, and drive continuous improvement.
EdrawMax makes it simple for lean teams to map out and analyze processes. Follow these steps to get started:
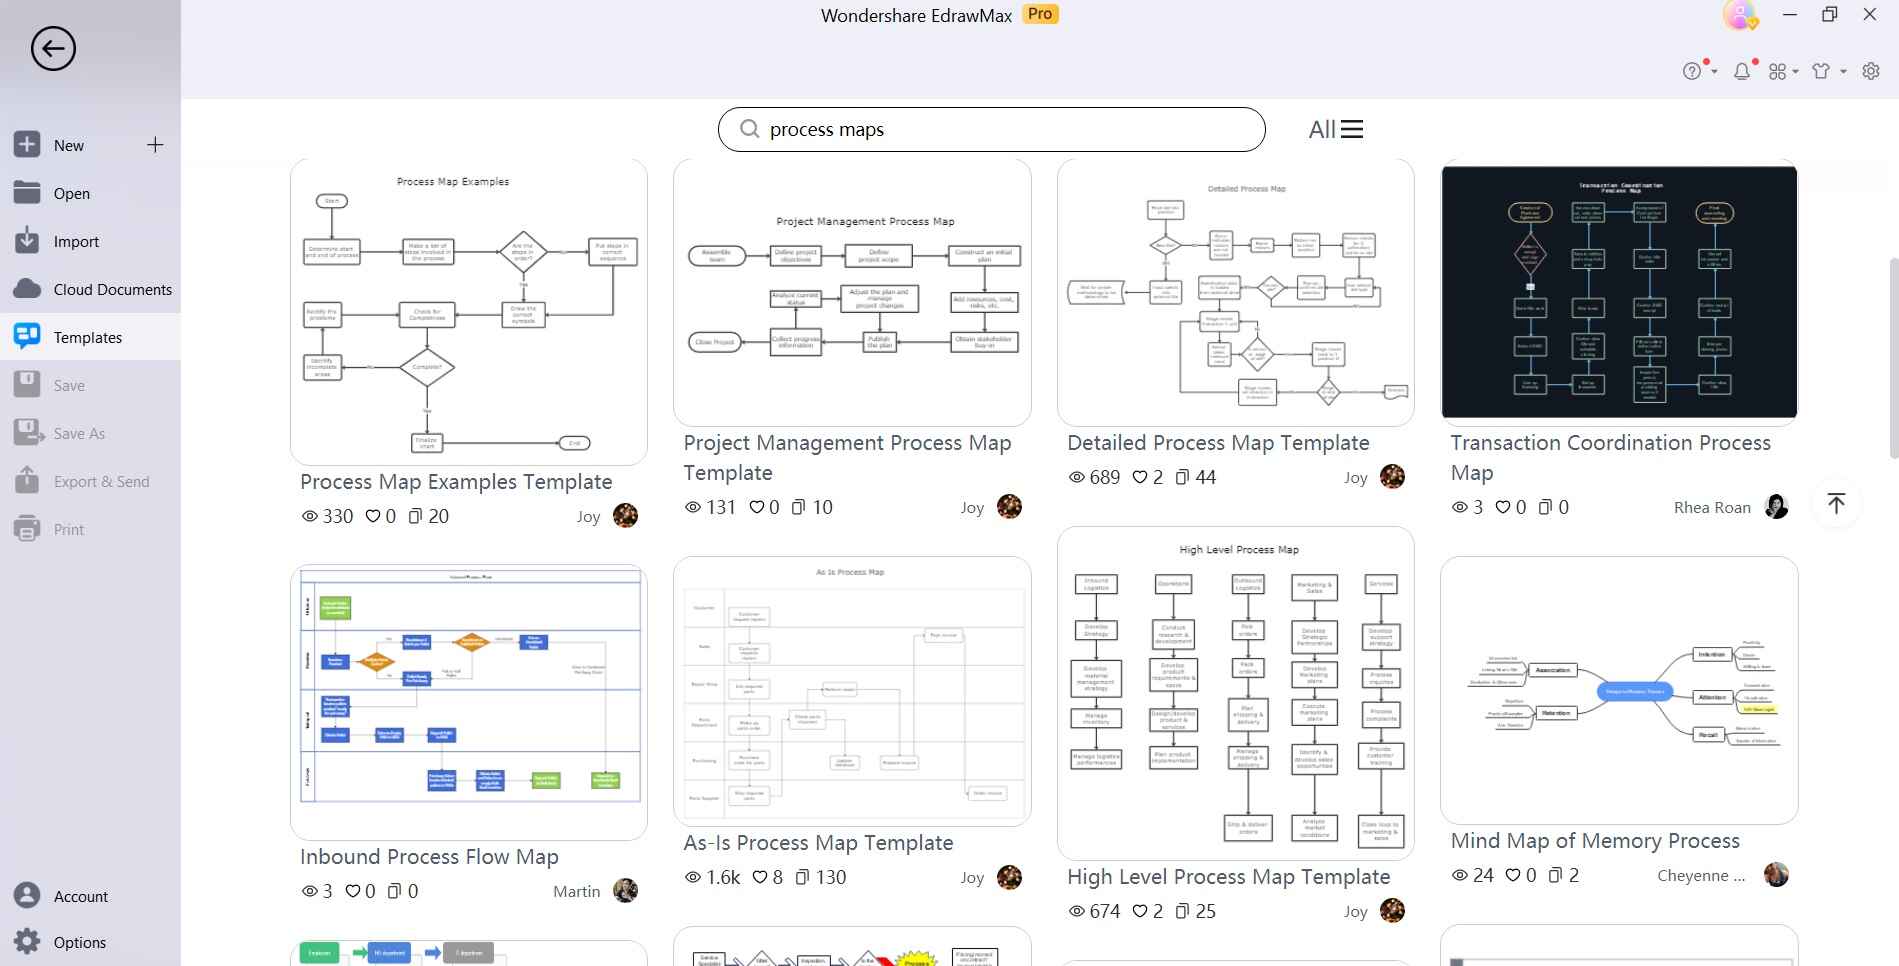
Step 1: Download and install EdrawMax on your PC. Open EdrawMax and select the Value Stream Map template. This loads the ribbon with relevant tools.
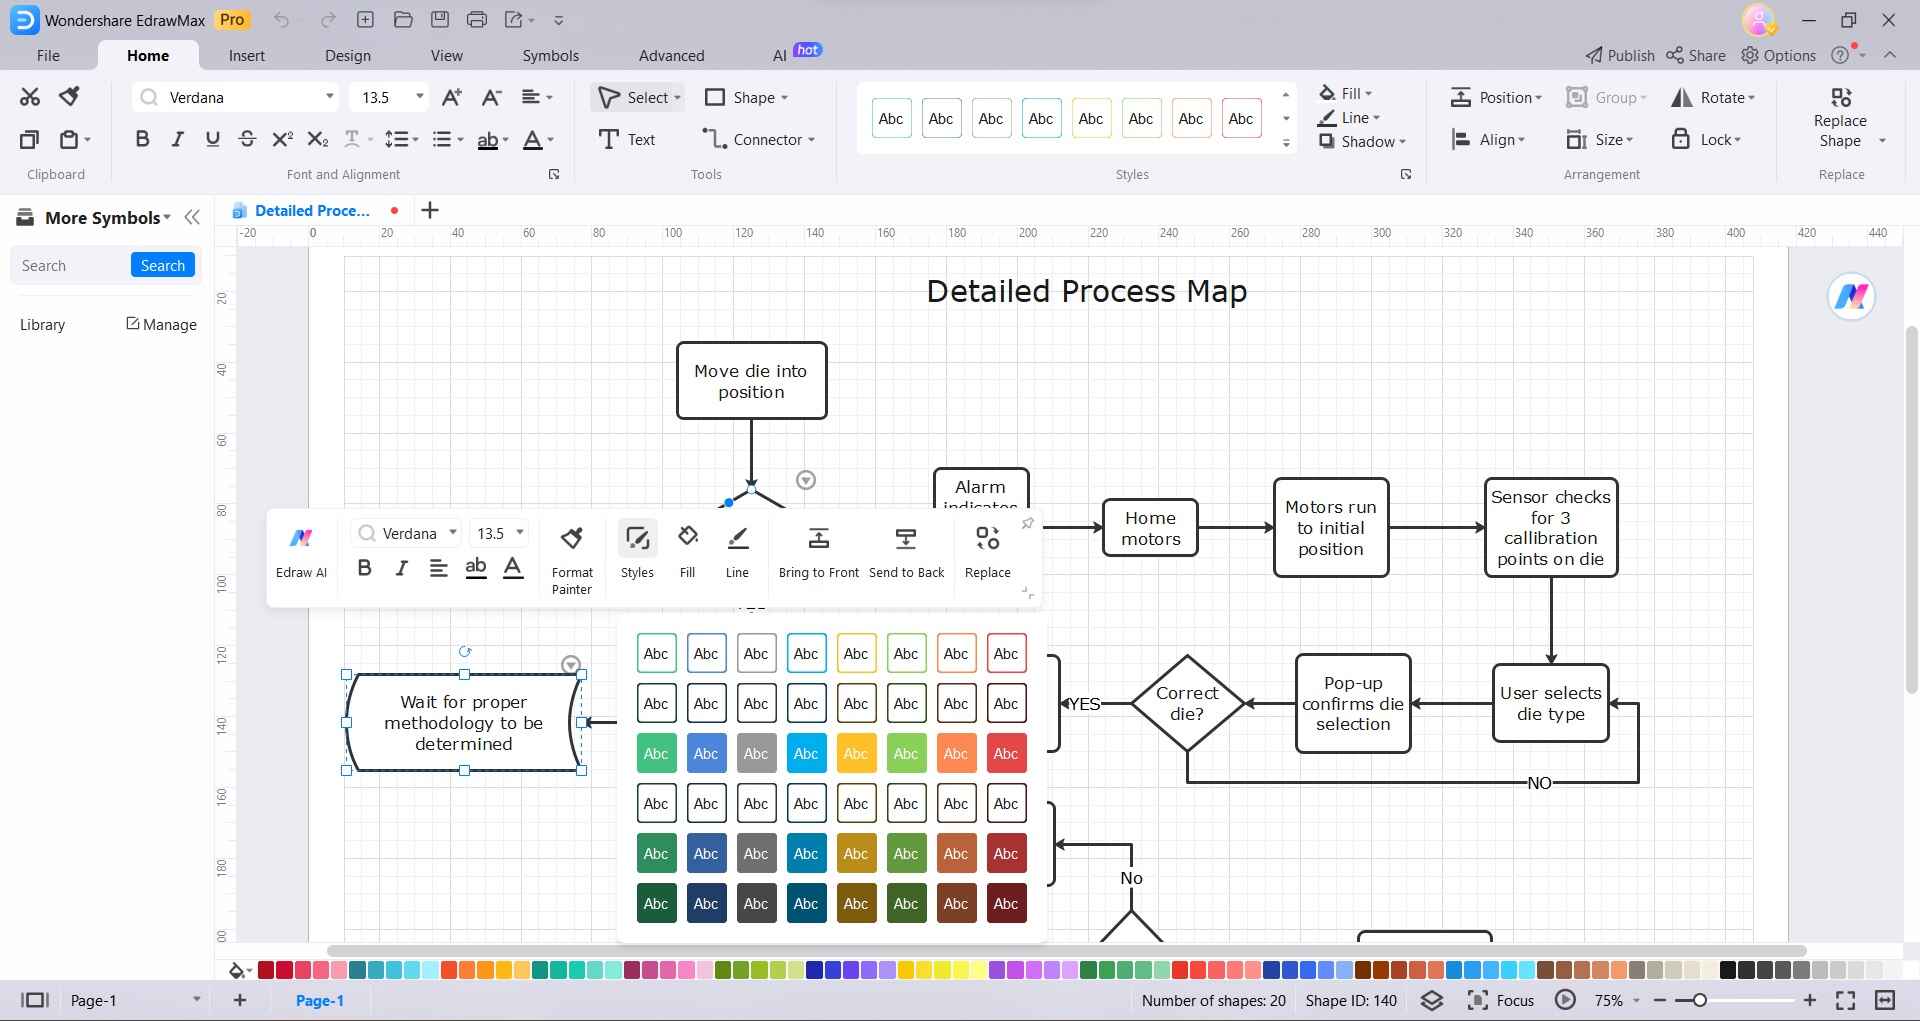
Step 2: Drag and drop activity, inventory, and information icons onto the canvas. Use connectors to illustrate flow.
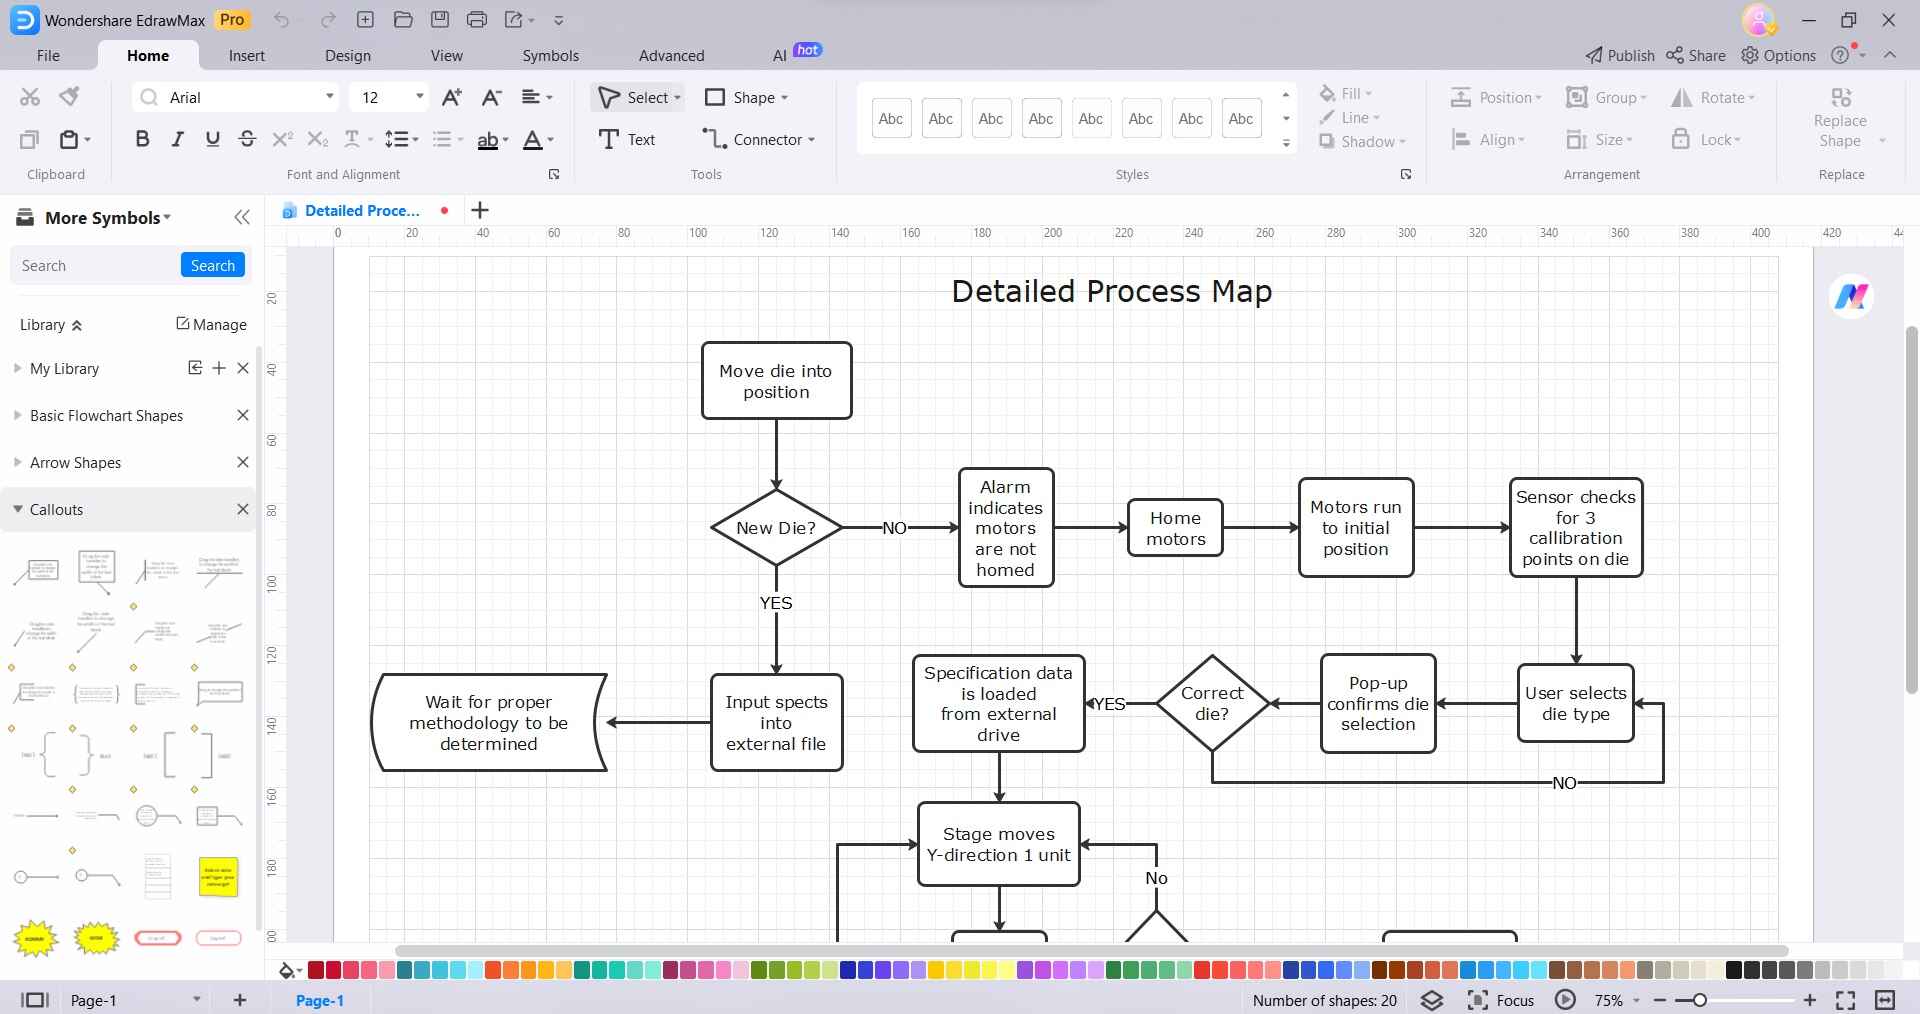
Step 3: Enter text to describe process steps and metrics for cycle time, uptime, etc. Modify icon colors to highlight waste.
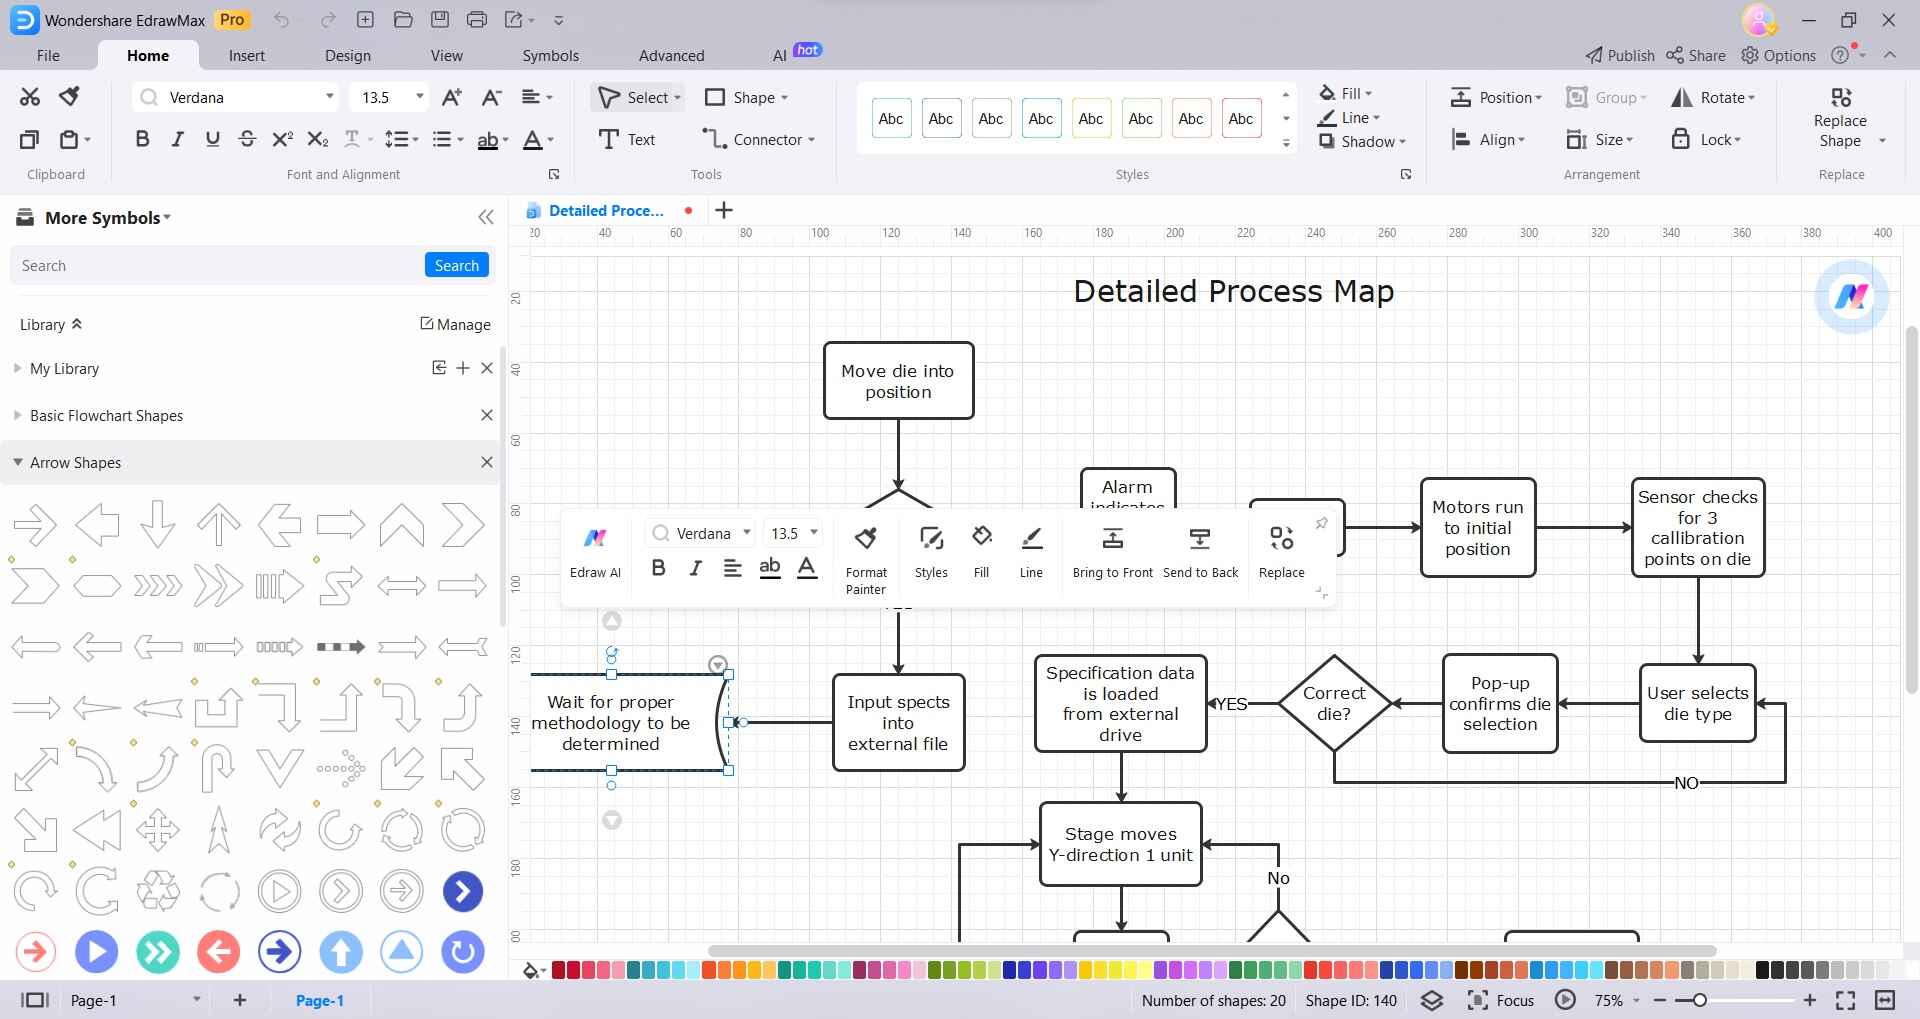
Step 4: When complete, click the Connection icon to link shapes automatically. Click on any entity and select “Styles” to customize color and appearance.
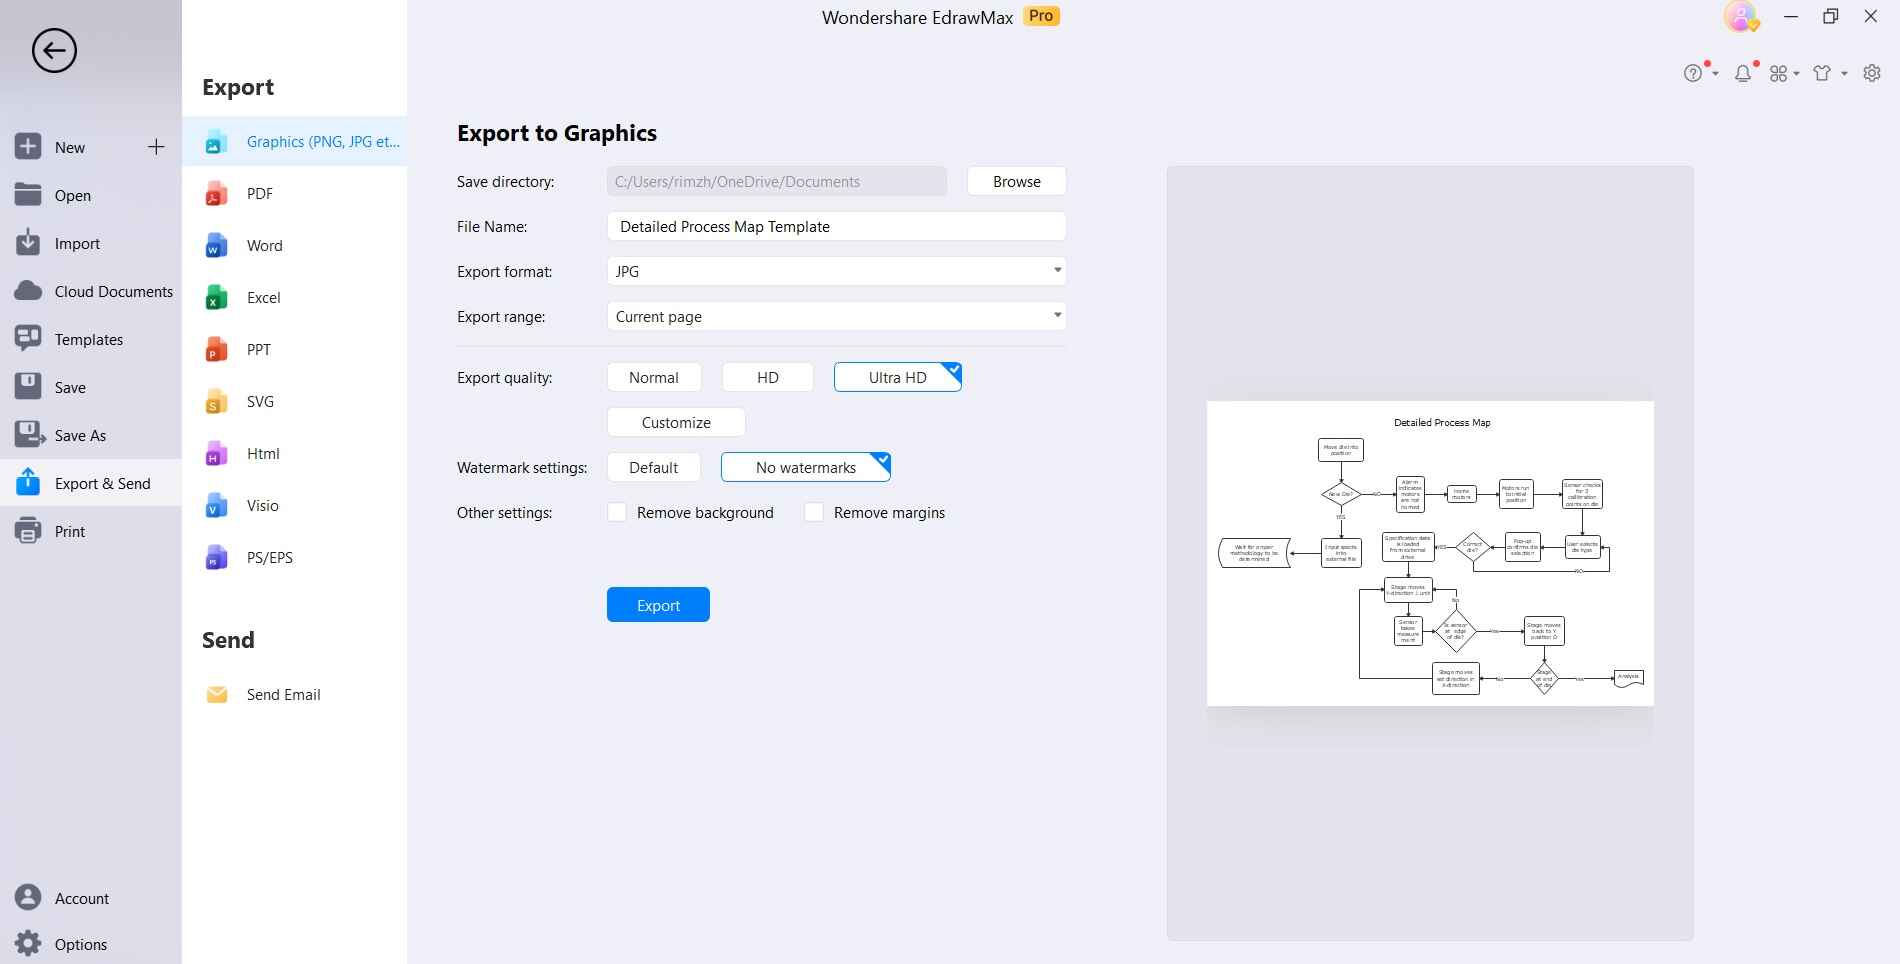
Step 5: Export the diagram in multiple formats like PDF, image files, or PowerPoint.
Conclusion
Value stream mapping using Microsoft Visio offers an accessible starting point for diagramming and documenting processes. However, the software has limitations around simulation and analysis. EdrawMax provides a Visio alternative that is affordable and highly functional for creating detailed process maps.
With built-in tools for value stream analysis, easy collaboration, and superior customization, EdrawMax gives lean teams the power to map, analyze, and optimize workflows. Organizations looking to scale up process improvement initiatives would benefit from evaluating this Visio alternative.

