


In the world of visual representation, line charts emerge as dynamic storytellers. They're more than just lines on a graph; they're a visual language that simplifies trends, patterns, and insights. Line charts are pivotal in transforming data into comprehensible narratives, whether tracking stock prices, analyzing trends, or showcasing progress over time.
In this article, we will show how to create a line chartonline with Wondershare EdrawMax. From the significance of line charts to a step-by-step guide on creating them, you'll explore the depths of visualizing data seamlessly with this free online line chart maker. Prepare to embark on a journey where data meets creativity, all at your fingertips.
In this article
Part 1. How To Draw a Line Chart on EdrawMax Online
In today's data-centric world, the ability to create visually compelling line charts is a valuable skill. EdrawMax simplifies this process, offering a user-friendly online platform that caters to both novices and seasoned data enthusiasts. In this guide, you'll explore two methods for drawing line charts using EdrawMax: creating from scratch and editing templates.
Start by accessing EdrawMax Online. Then, proceed to the steps
Method 1: Creating Line Charts From Scratch
Creating a line chart from scratch provides unparalleled flexibility. This method is ideal when specific design preferences or unique data requirements demand a customized approach. Begin your line chart journey with a blank canvas and turn your data into a visual narrative. Here's a step-by-step guide:
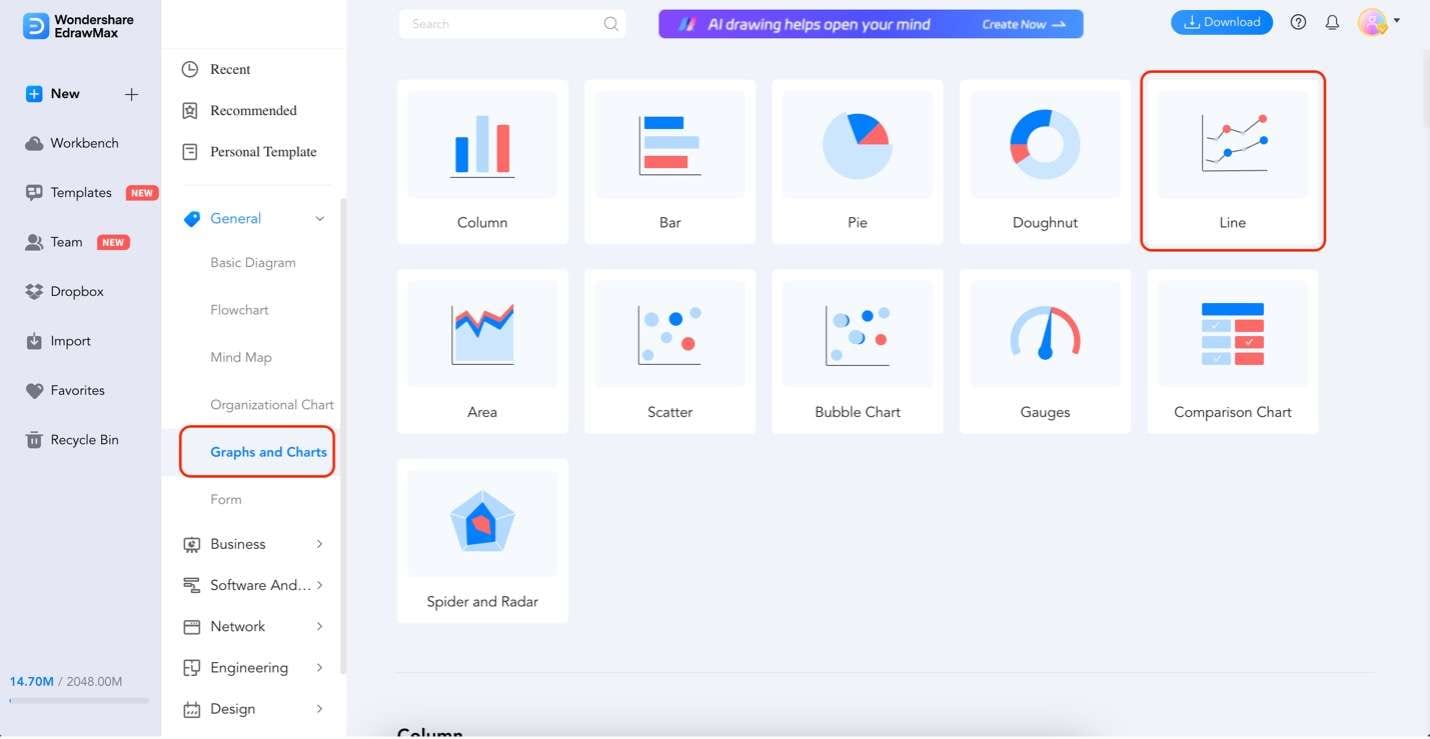
Step 1: Under Graphs and Charts, click Line.
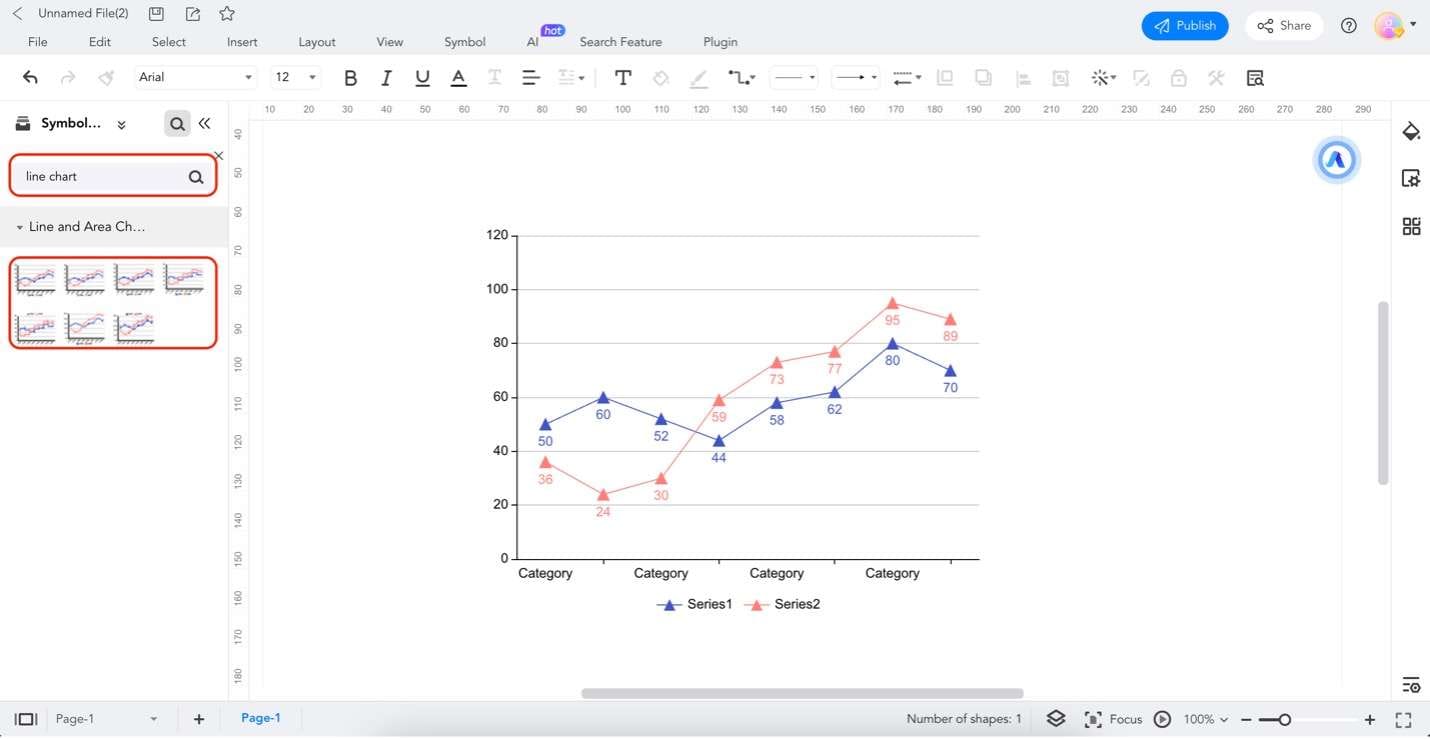
Step 2: Search for "Line Chart" templates in the elements panel. Then, drag and drop any of the basic layouts to the canvas.
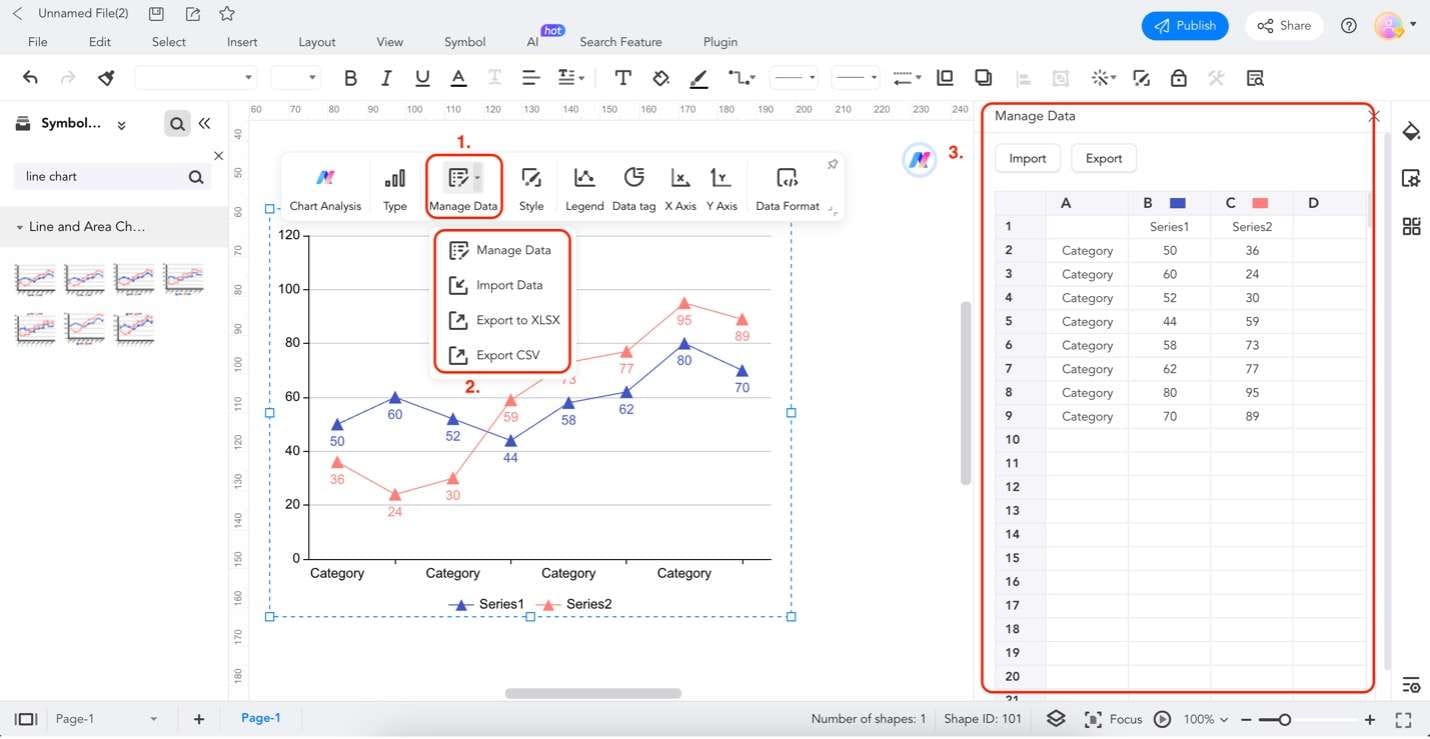
Step 3: Click Manage Data. Then, import or add your data by clicking Manage Data. On the appearing datasheet, add in your data accordingly.
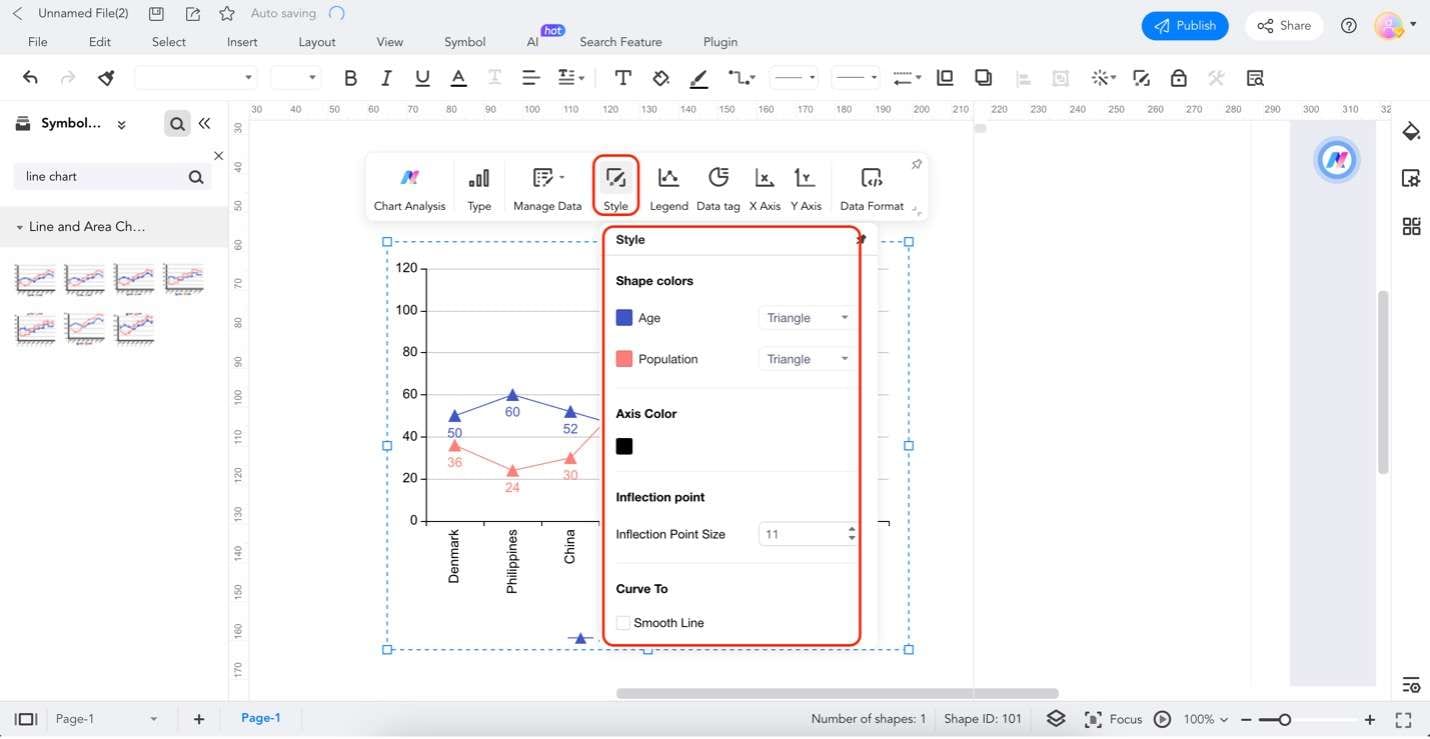
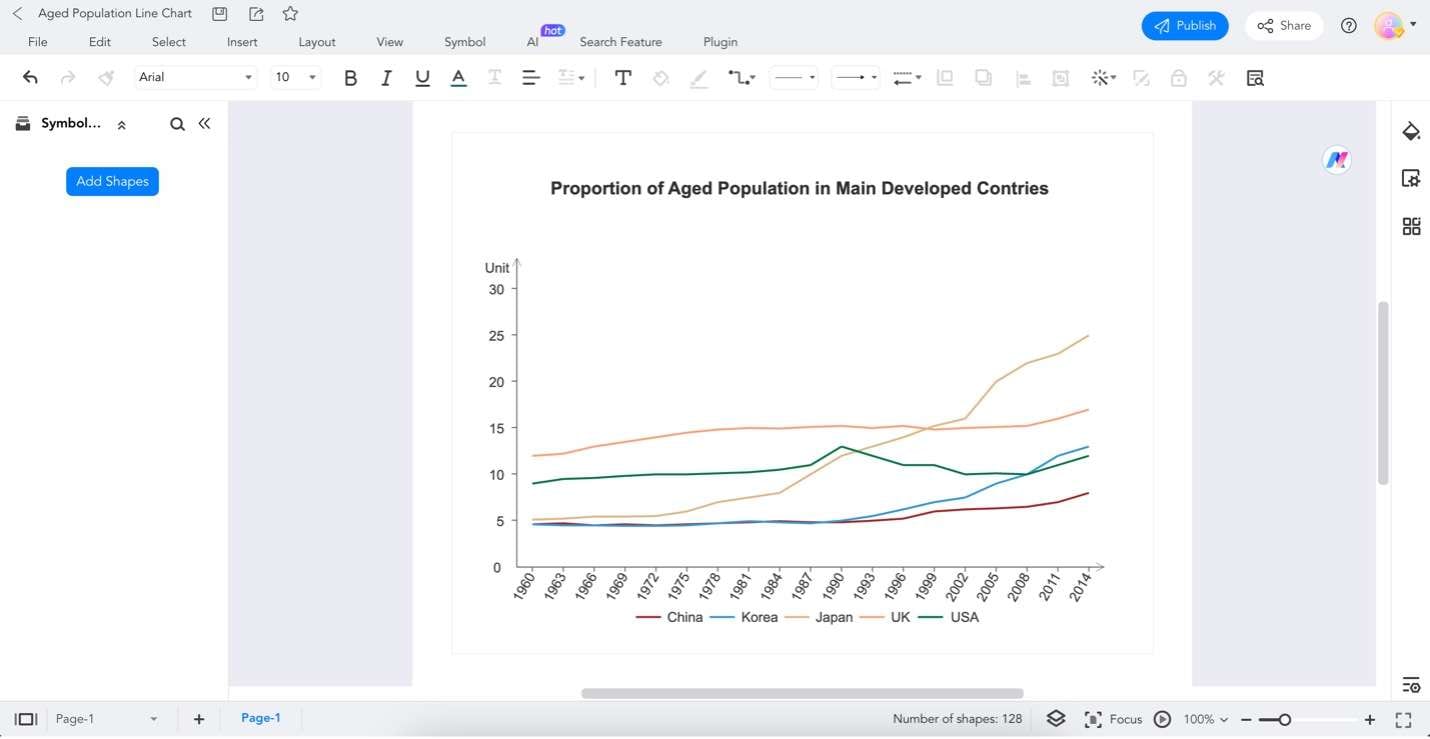
Step 4: Edit the line chart style by clicking on it. Then, click Style. Use the editing options there.
Method 2: Editing Line Chart Templates
Editing templates streamline the process, offering a head start while allowing room for customization. This method is perfect when you want to benefit from pre-existing design concepts while maintaining the flexibility to adapt them to your specific needs. Leverage the creativity of the EdrawMax community with pre-made templates. Customize existing templates to suit your data and messaging needs:
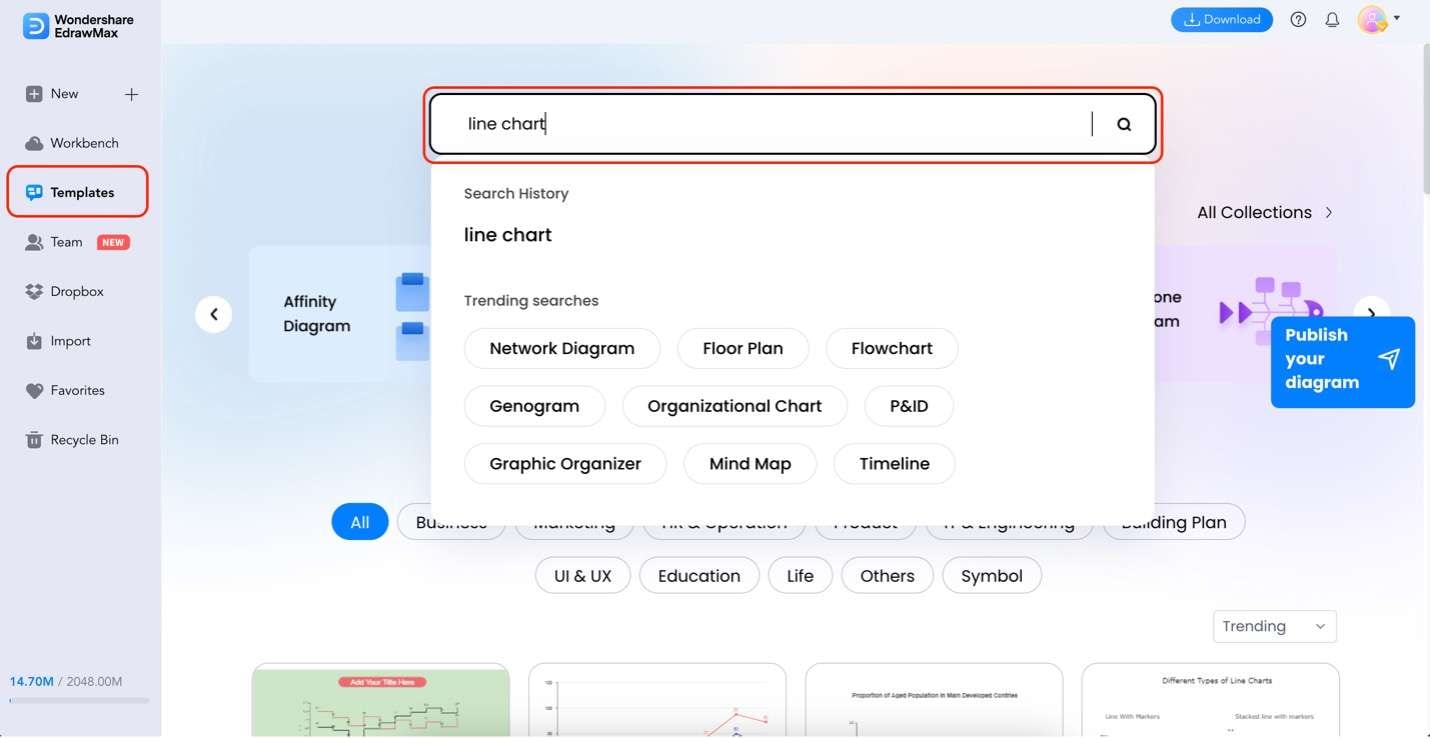
Step 1: Under Templates, search for "Line Charts" in the search bar provided. Choose any of the templates by clicking Use immediately.
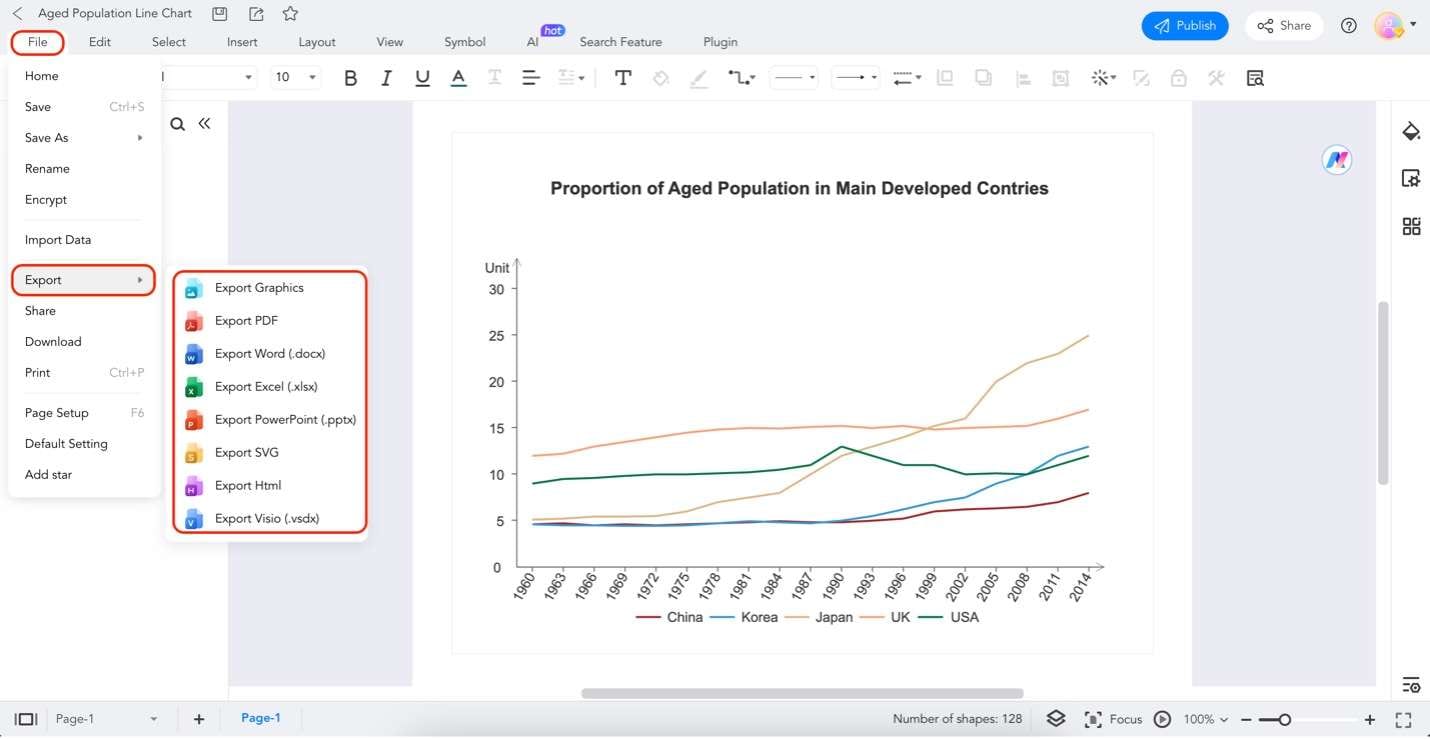
Step 3: To export or share your work, click File, then Export. Choose any of the export options available.
Part 2. Why Choose EdrawMax as Your Online Line Chart Maker
EdrawMax is more than just a line chart maker; it's a versatile diagramming tool for individuals of all skill levels. Whether you're a seasoned professional or a novice exploring the world of data visualization, EdrawMax has the tools to meet your needs. Here are some of its key features:
- AI chart analysis. EdrawMax’s built-in assitant, EdrawMax AI can analyze charts by comparing data, identifying anomalies, summarizing content, and predicting trends.
- User-friendly design. The intuitive interface ensures that creating line charts is seamless, even for those with limited design experience.
- Import data to make a chart. You can import data from a sheet to make a chart inside EdrawMax.
- Flexible export formats. Export your charts in PDF or graphics for sharing or Excel, Word and PowerPoint for further editing.
- Presentation maker. Make an infinite number of charts on the same canvas and create slides by circling areas on the canvas and export it.
- User-friendly design. The intuitive interface ensures that creating line charts is seamless, even for those with limited design experience.
- Abundant templates. EdrawMax offers an extensive library of templates, providing a head start for your line chart projects. These templates cater to various needs, from basic trends to complex data .
Part 3. Three Templates From EdrawMax's Templates Community
Dive into the expansive world of EdrawMax's template community – a treasure trove of inspiration for your line charts. If the default templates don't quite match your vision, or you're looking to explore diverse styles, these user-created templates are your gateway to creativity.
Simple Line Chart
Sometimes, simplicity speaks volumes. The Simple Line Chart template is a minimalist's dream, offering a clean and straightforward way to represent data trends. Perfect for those who prefer clarity and elegance in their visualizations.

 below.
  below.
 Wildlife Population Line Chart
Explore the delicate balance of ecosystems with this template. The Wildlife Population Line Chart offers a visual journey into the fluctuations of various species, providing a captivating depiction of nature's intricate dynamics.

Line Chart of GDP Growth Rate
Delve into economic landscapes with the GDP Growth Rate Line Chart template. This template visually narrates the economic journey, accurately portraying growth rates and fluctuations. It is ideal for business professionals and students studying economic trends.

Your line charts can stand out with these templates from EdrawMax's Template Community. Explore, customize, and unleash your creativity to bring data to life in ways that uniquely resonate with your audience.
Part 4. Tips for Making Line Charts
Creating impactful line charts requires attention to detail and thoughtful consideration of your data. Here are some tips to enhance your line chart-making skills:
- Simplify your message. Focus on the core message you want to convey with your line chart. Avoid clutter and unnecessary details.
- Choose the correct data. Select data that directly supports your narrative. Be mindful of outliers that might skew your visual representation.
- Clear labeling. Ensure your axes and data points are clearly labeled. A well-labeled chart is more accessible and user-friendly.
- Use consistent colors. Assign consistent and easily distinguishable colors if you have multiple lines. This aids comprehension, especially in complex charts.
- Mind your scale. Pay attention to the scale on your axes. More than incorrect scaling can mislead your audience.
- Highlight trends. Emphasize significant trends or points in your data by using markers or annotations.
- Consider your audience. Tailor your line chart to your audience. Present complex data differently for experts than you would for a general audience.
- Experiment with line styles. Dotted, solid, or dashed lines convey different meanings. Experiment to find the style that best suits your message.
By incorporating these tips, you'll create line charts that accurately showcase your data and effectively engage and inform your audience.
Conclusion
In conclusion, we've navigated the realm of line charts, understanding their significance as dynamic visual storytellers. From deciphering trends to clearly presenting data, line charts are invaluable tools in our data-driven world.
On the key points, you've explored the importance of line charts. You've also learned about their role in data communication and why EdrawMax stands out as a premier online line chart maker. EdrawMax's AI Chart Analysis, user-friendly design, and many templates empower users to create and analyze compelling line charts effortlessly.

