
Welcome to a comprehensive guide on Venn diagrams, a powerful tool to unravel the complexities of concepts and ideas that often intertwine. Imagine grappling with two ideas that need help to differentiate. These diagrams give you an easier way to digest or outline their differences.
Venn diagrams act as visual aids, offering clarity and structure to these intricate relationships. In the following sections, you'll learn how they work, where to use them, and how to create them effectively. By the end of this guide, you will have the knowledge and skills to use Venn diagrams for various purposes.
In this article
What Is a Venn Diagram?
A Venn diagram is a visual representation that helps to illustrate the relationships and commonalities between different sets or groups of items. This graphical tool uses overlapping circles or shapes to show where these sets intersect and where they are distinct.
Venn diagrams are like organizing compartments for ideas or data. They make it easier to understand how various elements relate. As you delve deeper into this guide, you will realize how Venn diagrams work and how they can be applied in many scenarios.
History of the Venn Diagram
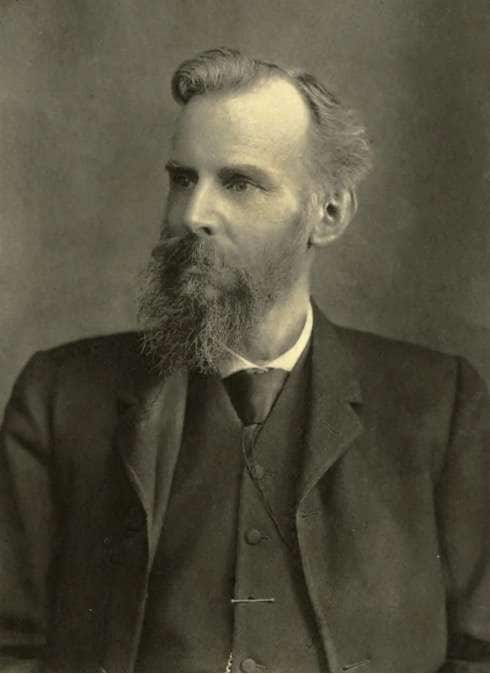
Now that you understand a Venn diagram, explore its fascinating history. Venn diagrams are named after John Venn, a British mathematician and logician who introduced them in the late 19th century. However, the concept of visualizing set intersections and relationships predates Venn's work.
Early examples of similar diagrams can be traced back to the 13th-century Persian mathematician and philosopher Shams al-Din al-Samarqandi. He used overlapping circles to represent categorical propositions in his writings. Over the years, Venn diagrams have transcended mathematics and logic to become a versatile tool for various fields, including data analysis, business, and even creative thinking.
Venn Diagram Examples
Now, dive into some practical examples of Venn diagrams that you can use to visualize relationships between different data sets or concepts. These templates provide a great starting point for your projects. While they have pre-set text, you can easily edit them for other content.
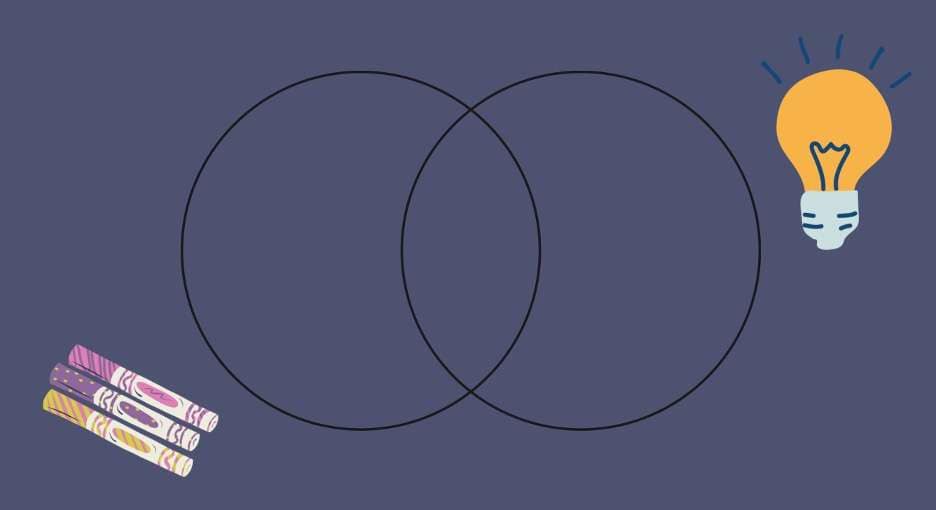
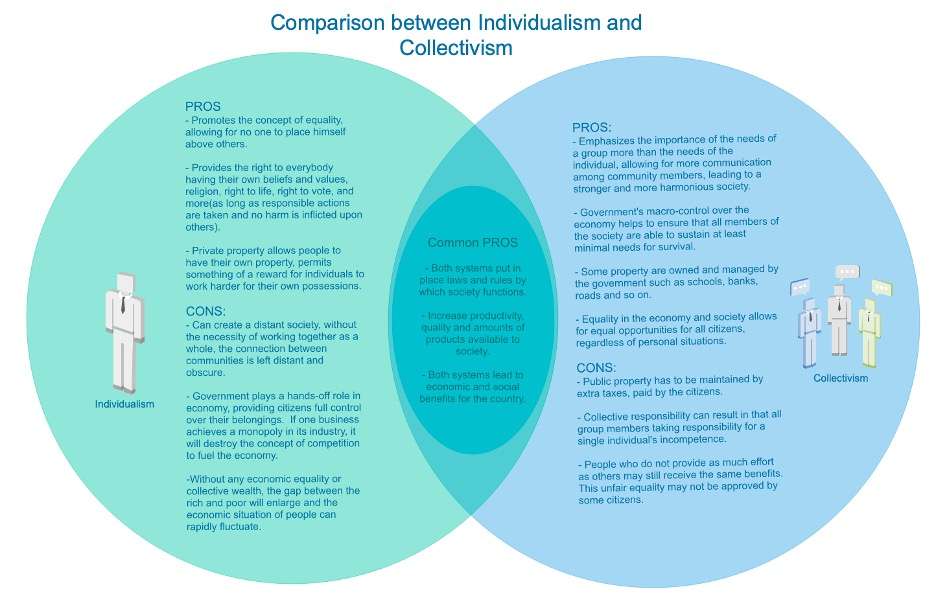
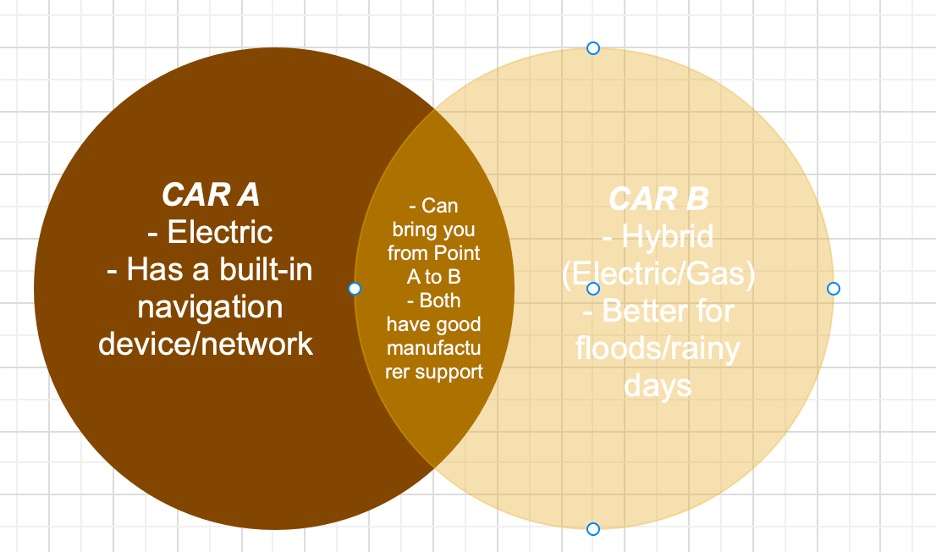
Two-Set Venn Diagram
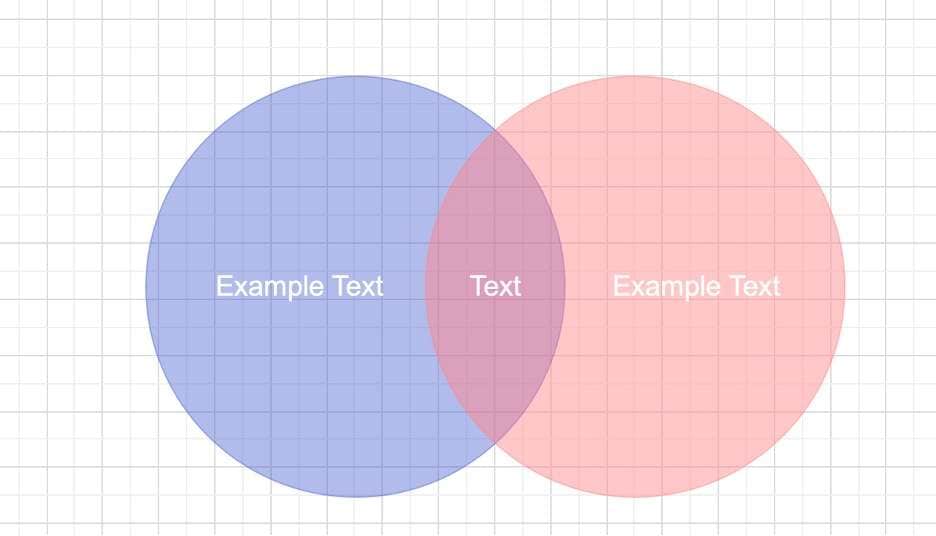
This classic Venn diagram template is essential for anyone comparing and contrasting two data sets, ideas, or concepts. When you think of a Venn diagram, this is the image you'll have in your mind. Use it for basic needs.
 below.
  below.
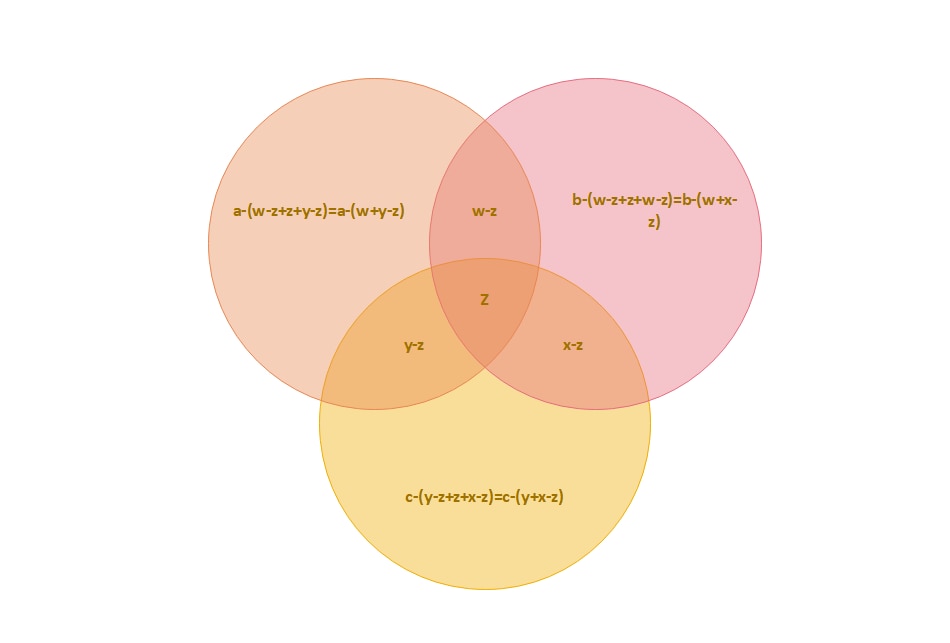
 Three-Set Venn Diagram
When your analysis involves three separate sets, this template becomes invaluable. It provides a structured and visually appealing way to identify shared elements and unique characteristics within three sets. As the ideas you understand increase, try the three-set Venn diagram.
Four-Set Venn Diagram
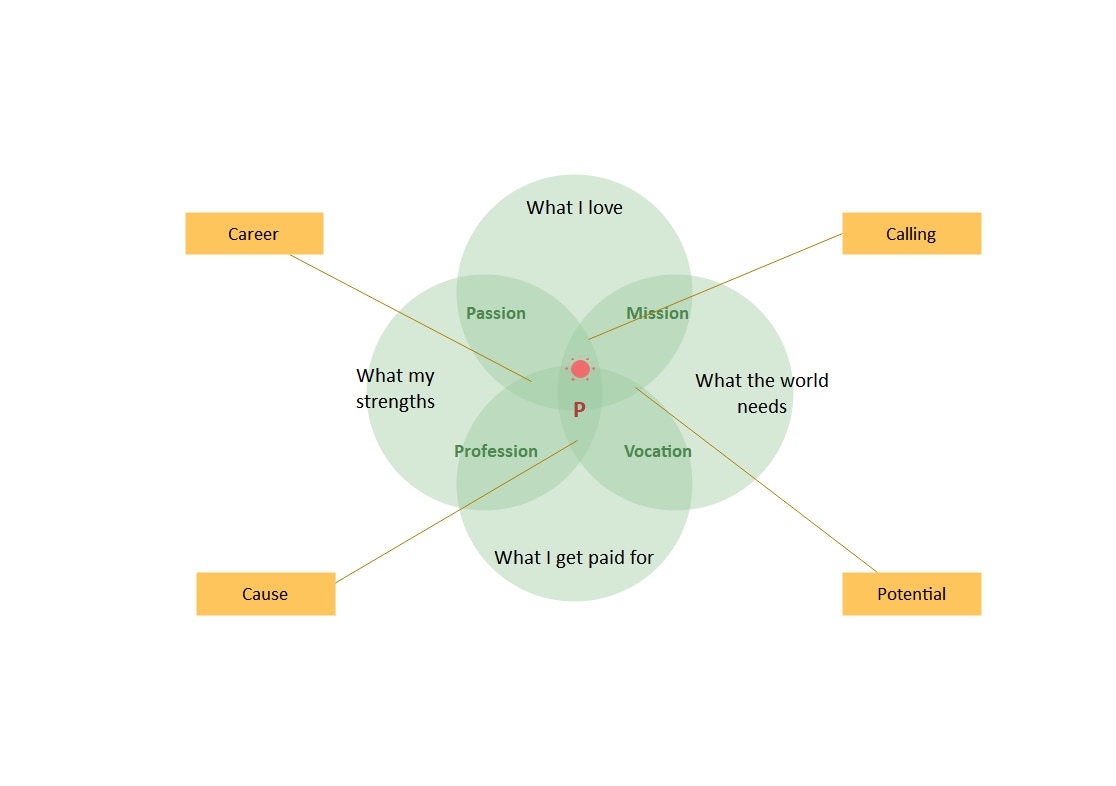
As your data or concepts become more intricate, this four-set Venn diagram template rises to the challenge. It offers a comprehensive view of the overlaps and distinctions among four sets. It can manage complex research data, explore multifaceted business strategies, or map diverse social trends.
Five-Set Venn Diagram
Sometimes, your projects require an even higher level of complexity. This template accommodates five distinct sets. Moreover, it includes a sixth, outlying circle that can be used for additional context or data, providing flexibility for various scenarios.

All of these templates are available in EdrawMax's Template Community. It is a user-powered template collection. Edrawers like you can immediately upload and share templates so others can use them.
How To Create a Venn Diagram
Now that you understand the significance of Venn diagrams and have explored various examples, it's time to create your own. This step-by-step guide will walk you through making Venn diagrams from scratch.
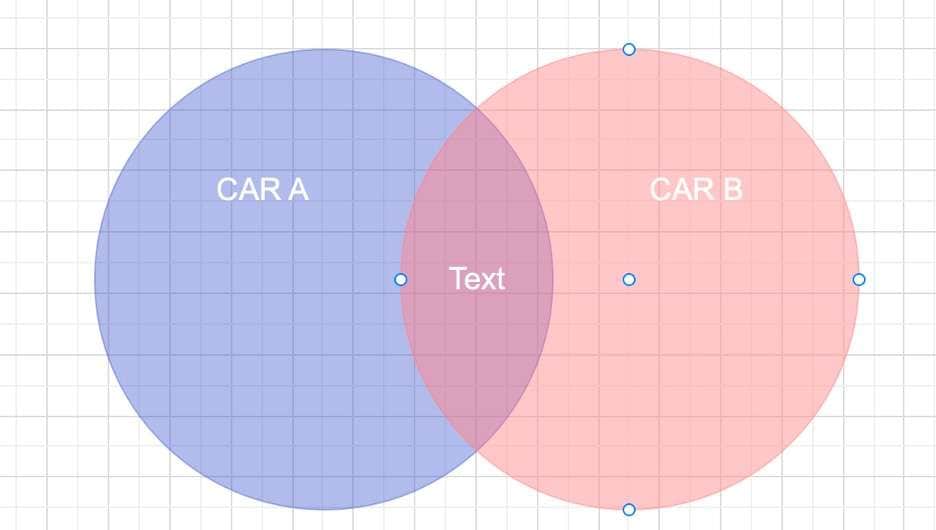
Step 1: Draw the circles or ellipses that represent your sets. Carefully draw the overlapping sections where the processes or ellipses intersect.
Step 2: Write or type the labels for your sets inside each circle or ellipse. Place the labels near or inside the appropriate process or ellipse.
Step 3: Add the content to your Venn diagram. Remember to put the similarities in the intersections and the uniqueness of each concept on the more significant part of the circles.
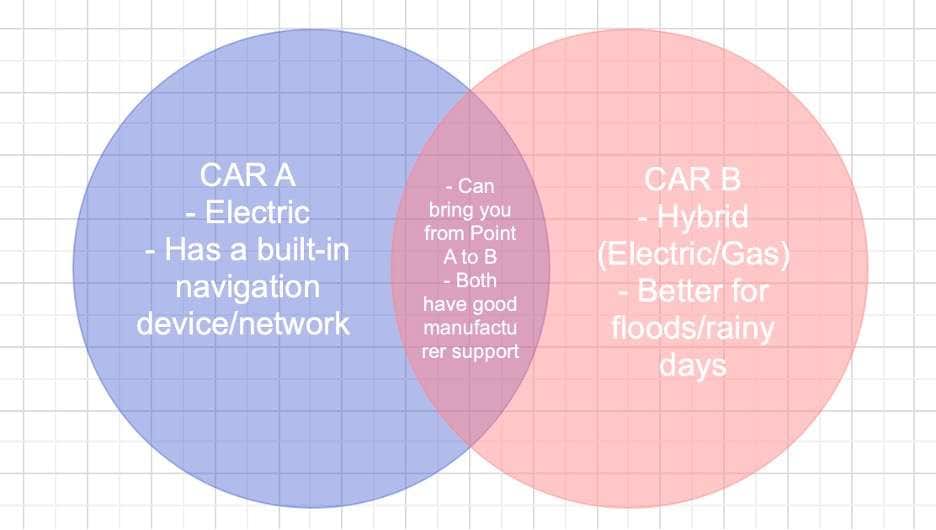
Step 4: To make your Venn diagram visually appealing and easy to understand, consider customizing it. You can use different colors for each set or intersection, add shading or patterns, and adjust line styles. Ensure that your diagram is neat and labels are legible.
Three Recommended Apps To Create Venn Diagrams
If you want to create Venn diagrams easily and professionally, several excellent tools are at your disposal. Here, we recommend three options, each catering to different preferences and requirements.
Wondershare EdrawMax
EdrawMax is a professional diagramming tool known for its versatility and user-friendly interface. It provides a range of features that make creating Venn diagrams easy. EdrawMax was used to create the Venn diagram in the previous section. Looks great? Check out its key features for more:
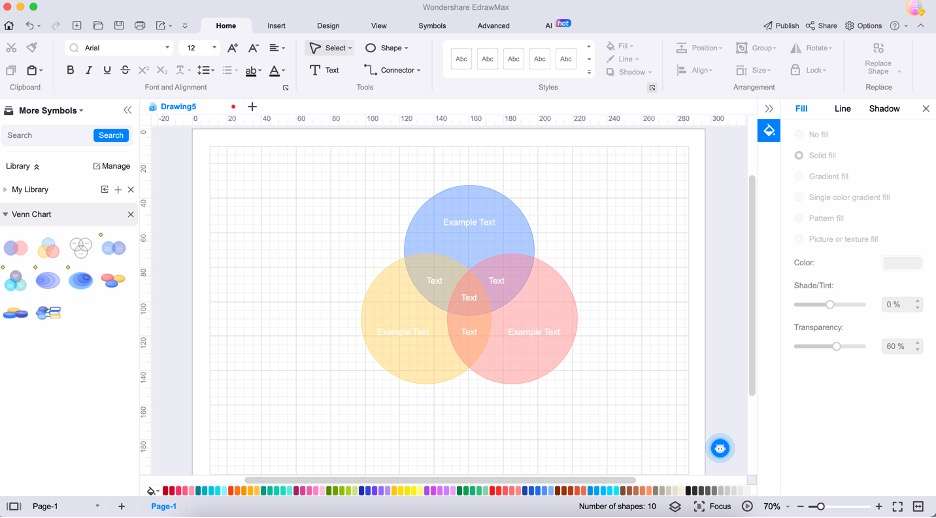
- Free and Online. EdrawMax offers free and paid versions, making it accessible to users with varying needs and budgets. Its online platform allows you to create Venn diagrams from anywhere.
- Many Templates. EdrawMax boasts an extensive library of templates, including a wide selection of Venn diagram templates. These templates provide a head start and can be easily customized to suit your specific requirements.
- Beginner-Friendly. The user-friendly interface and intuitive tools make EdrawMax an ideal choice for those new to diagram creation. You can quickly grasp the basics and start designing.
- AI Tools. EdrawMax incorporates artificial intelligence tools that can enhance your diagramming experience, helping you create accurate and visually appealing Venn diagrams.
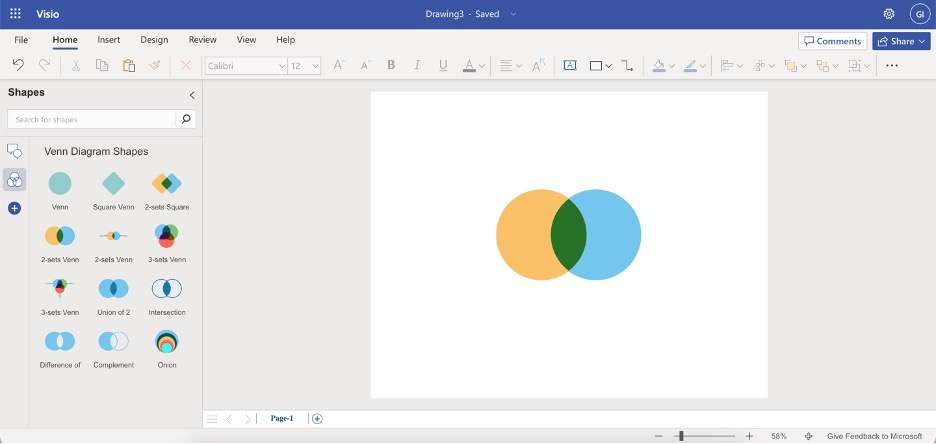
Visio
Are you familiar with Visio? It's a powerful software used by professionals worldwide for diagramming. It's part of the Microsoft Office suite and offers advanced features for creating intricate Venn and other diagrams for various purposes. As part of the Microsoft Office suite, Visio seamlessly integrates with other Microsoft applications, making it easy to share and collaborate.
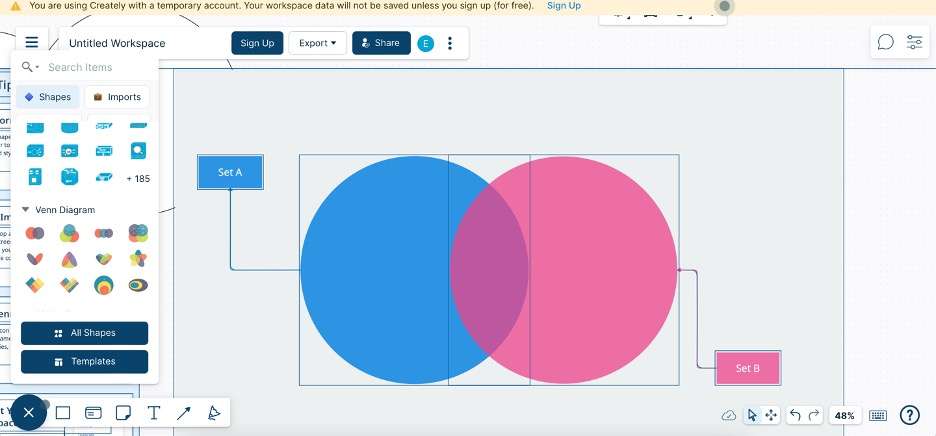
Creately
Creately is an online diagramming tool that's great for collaboration and teamwork. It has standout features like real-time collaboration and various templates to get you started quickly. Its user-friendly interface makes it accessible to all skill levels. Try it out and see how its vast workspaces streamline your next project.
Symbols Used in Making Venn Diagrams
Venn diagrams rely on universally recognized symbols and shapes to convey information effectively. Understanding these symbols is crucial for creating clear and accurate diagrams.
- Circles. Venn diagrams show groups of things using circles or ovals. The circles represent sets. However, you can easily change the shape to something else if they do the job.
- Intersections. When you see circles or ovals overlapping in a Venn diagram, those sets have things in common. The more overlap there is, the more things they share. We use words or numbers to describe what's in those overlapping areas. It helps us see how things are similar between the sets.
- Sets. Venn diagrams use sets to represent groups of related things. Each set is labeled to show what it represents. The text inside each set only belongs to that group.
Tips for Making Venn Diagrams
Creating effective Venn diagrams involves placing circles and intersections on a page. Here are some tips to ensure your Venn diagrams are clear, informative, and visually appealing.
- Proper Sizing of Spaces. When making Venn diagrams, remember to size the circles appropriately to represent the elements or concepts they stand for accurately. Overly large or small circles can distort connections.
- Using Colors and Shading. Distinct colors and shading can improve the clarity of Venn diagrams. Use them to differentiate sets and intersections and emphasize essential areas. This will help your viewers understand the chart more easily.
- Using Too Many Sets. Balance is critical in creating Venn diagrams. Too many sets can make them confusing. Simplify if necessary for clarity.
- Organizing the Sets for Intersections. Organize Venn diagram sets logically to convey intended relationships. A well-organized diagram helps the audience understand connections between elements easily.
Conclusion
In conclusion, this guide has provided a comprehensive overview of Venn diagrams, shedding light on their definition, historical roots, and practical applications. The advantages of Venn diagrams, such as their capacity to simplify complex ideas and facilitate logical analysis, are undeniable.
Consider using user-friendly diagramming tools like EdrawMax to start your Venn diagramming journey. With its templates and AI-driven capabilities, EdrawMax enables you to create stunning Venn diagrams easily.