Swim lane diagrams are a useful tool for visualizing and organizing complex processes in Excel. By dividing the process into lanes, representing different individuals or departments, and using shapes and connectors to create a flow chart, swim lane diagrams provide a clear overview of responsibilities and interactions. In this article, we will discuss the steps to prepare swim lane chart Excel, including formatting cell height and width, labeling the container, and creating a flow chart.
In this article
Components of a Swimlane Diagram
There are many components of a Swimlane diagram. Some of the main components of a swimlane diagram are discussed below.
1. Lane Divisions
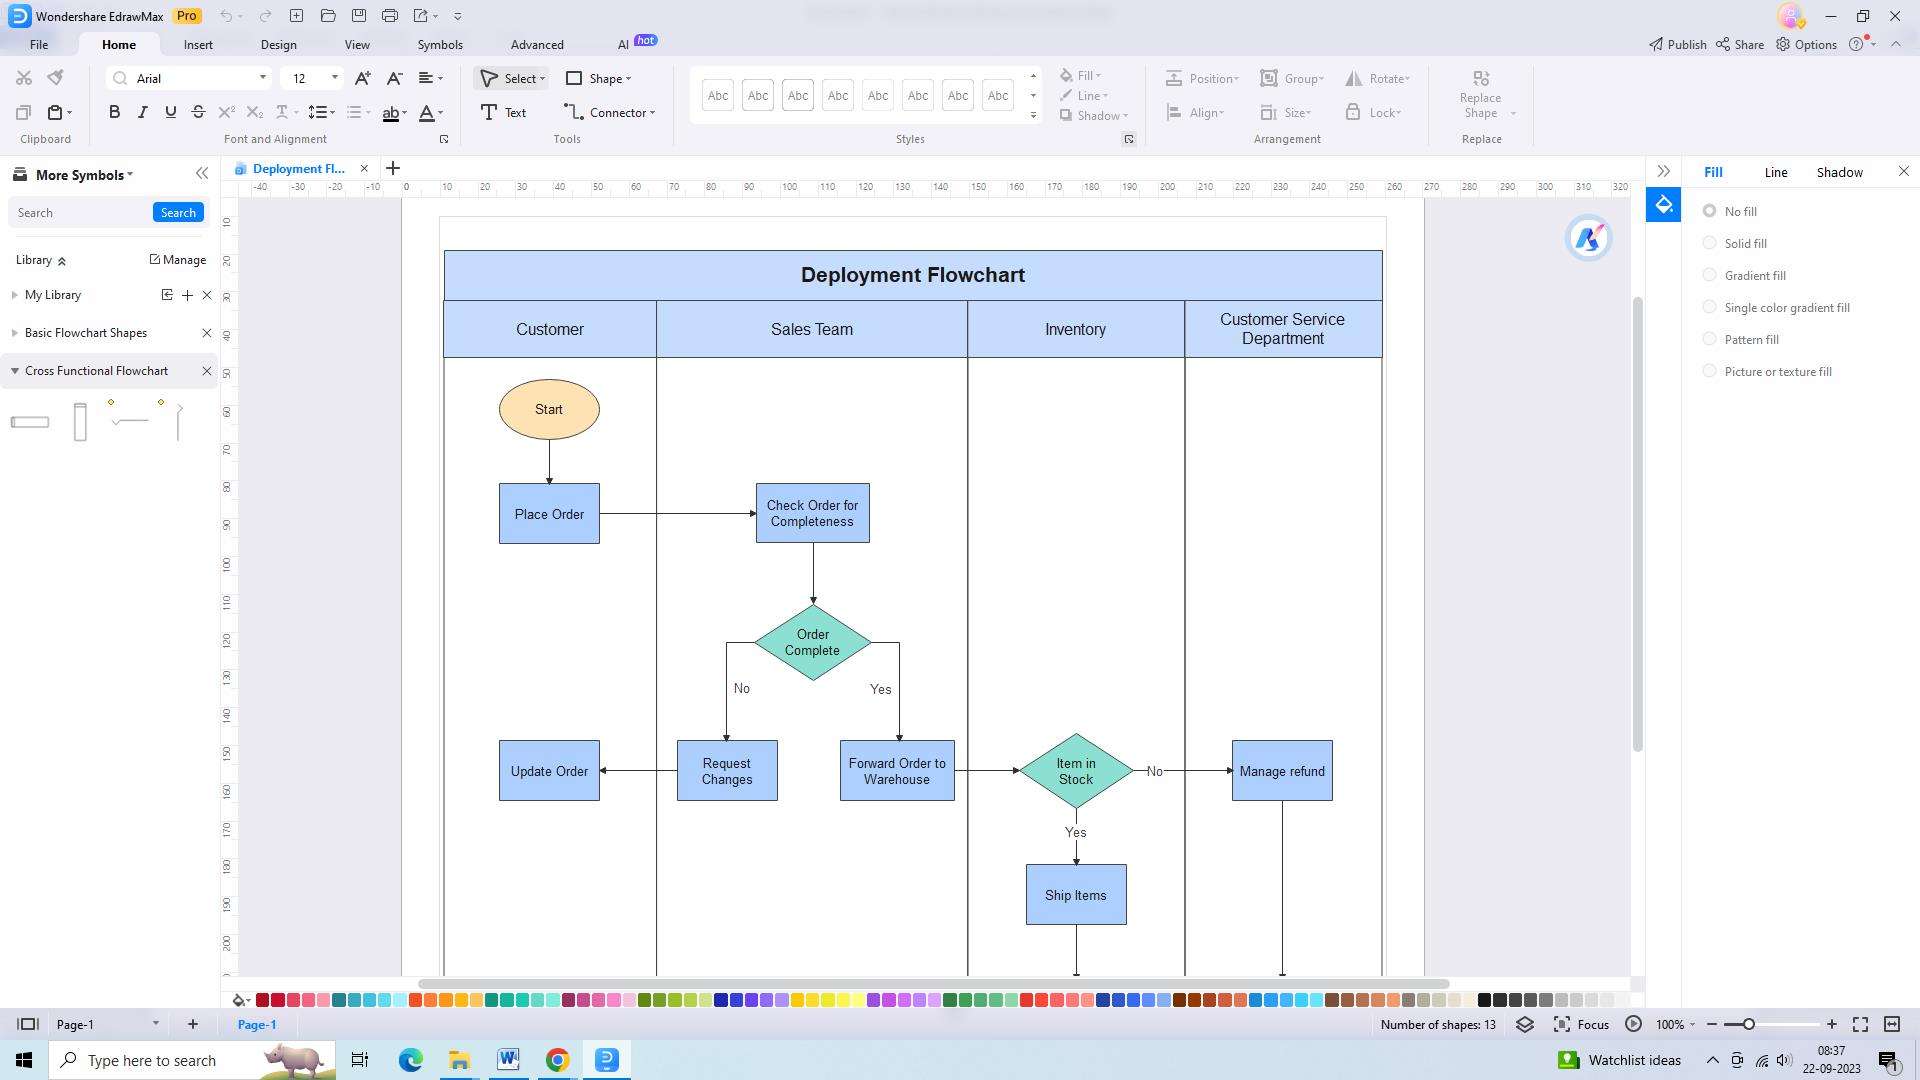
The swim lane diagram consists of vertical lanes that represent various individuals, departments, or entities involved in a process. These lanes, often referred to as "swim lanes," offer a clear visual separation, enabling a comprehensive overview of the responsibilities and interactions between different stakeholders.
2. Activities and Tasks
Within each lane, swim lane diagrams outline the specific activities or tasks that need to be accomplished to fulfill process objectives. These activities are represented by horizontal lines or bars, allowing stakeholders to easily track the sequence and duration of each task.
3. Decision Points and Branching
When processes involve decision-making points or branching paths, swim lane diagrams offer a powerful tool for capturing these complexities. By utilizing diamonds, organizations can represent decision points, indicating the alternative paths that may arise.
4. Roles and Responsibilities
One key aspect of swim lane diagrams is the inclusion of roles and responsibilities for each participant or department. By clearly outlining the tasks assigned to each lane, these diagrams not only foster accountability but also provide participants with a comprehensive understanding of their contributions to the overall process.
Common Swimlane Templates in Excel
When it comes to creating swimlane diagrams in Excel, there are several commonly used templates that can help streamline the process. By using these templates as a starting point, you can save time and effort in creating swimlaneExcel diagrams from scratch:
1. UML Swimlane
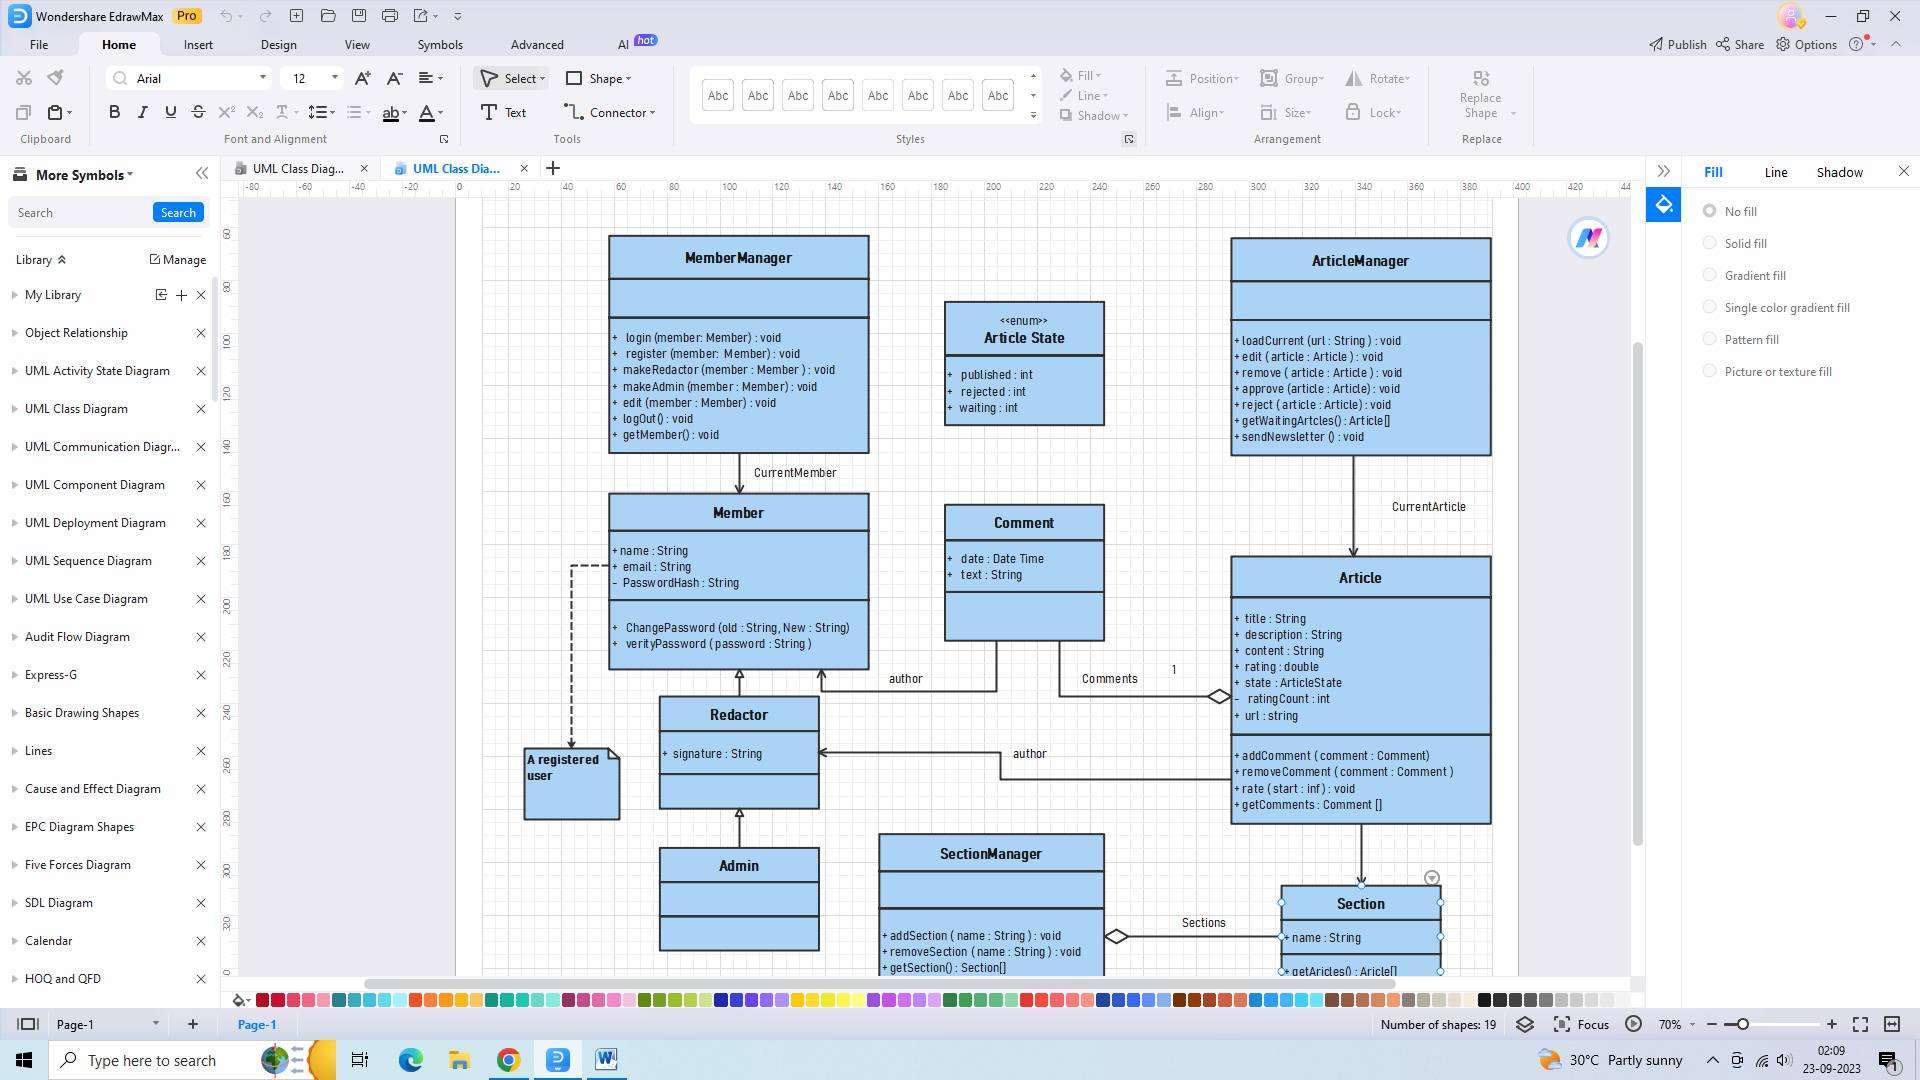
The UML swimlane diagram presents the activities involved in a content publishing house. It illustrates how the author, editor, and publisher interact to create content. The rectangular boxes represent the tasks or steps, while the lanes distinguish the functions of each role.
2. Swimlane Flowchart
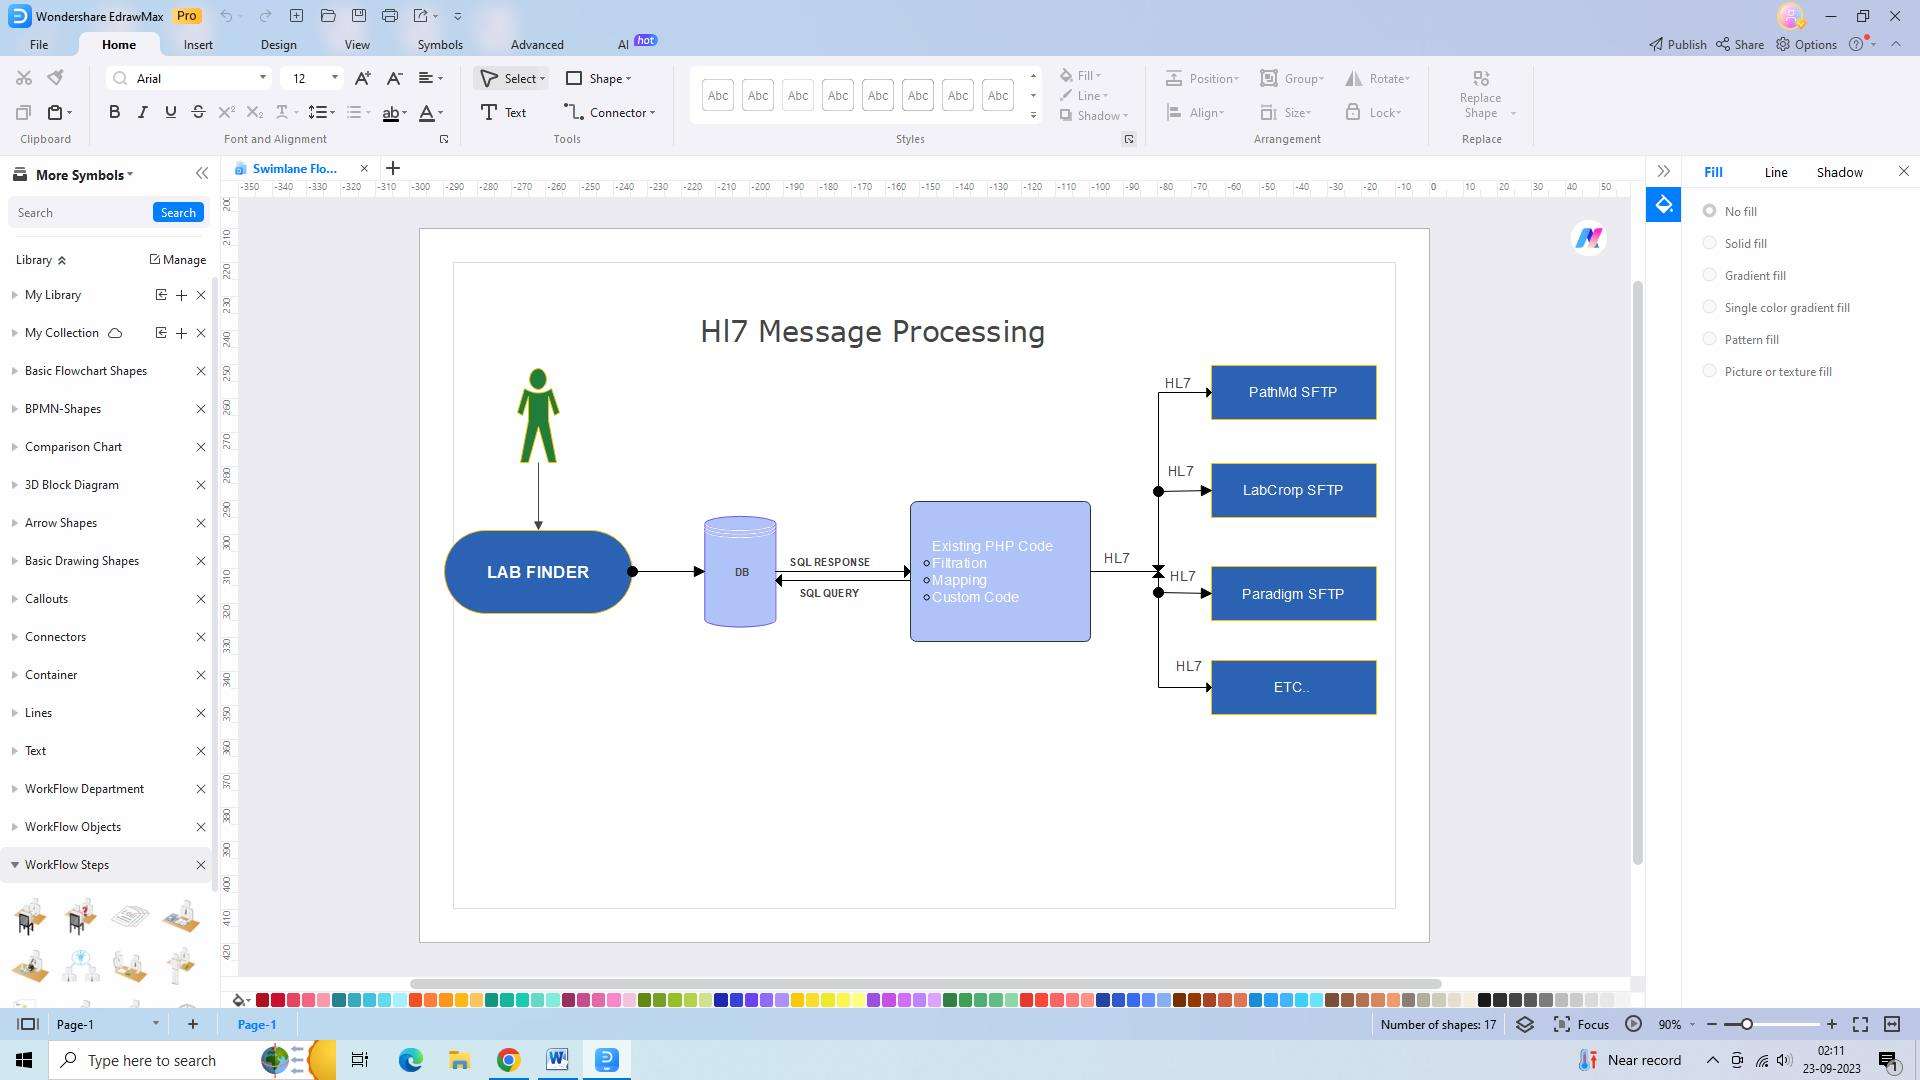
Swimlane diagrams are commonly used in manufacturing businesses. This flowchart showcases how different departments collaborate on a single page to accomplish a task. Each department understands its responsibilities and obstacles, and everyone involved is aligned toward achieving the goal.
3. Swimlane Process
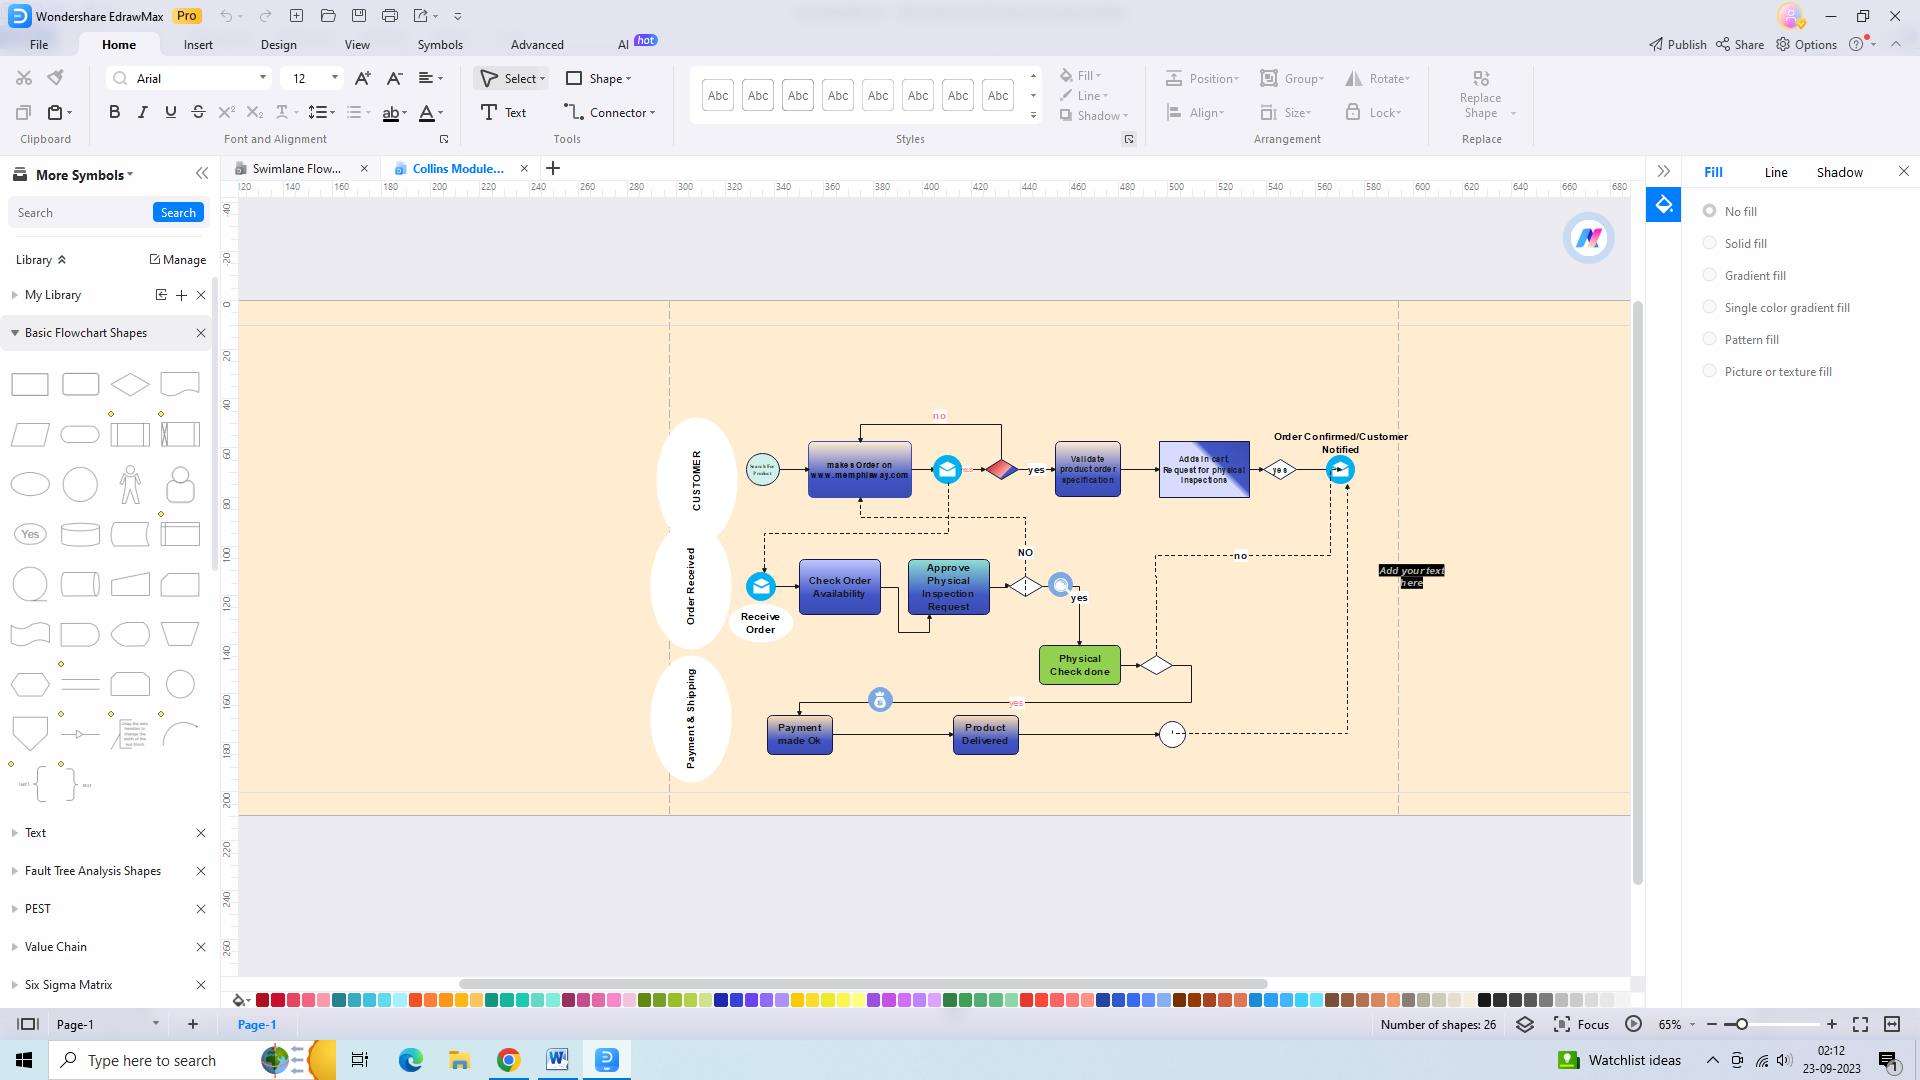
Let's explore the vertical swimlane diagram, which is a swim lane template Excel that displays a set of activities and the interaction between a Salesperson, consultant, and technician. This diagram focuses on the business process of meeting a new client. Each individual understands their role, and all three works together to achieve the desired objective.
There are many online tools for creating swimlane diagrams. Here, we will take a look at how you can create swimlane diagrams using EdrawMax and Excel.
How to use EdrawMax to create a swimlane diagram
Wondershare EdrawMax lets users create swimlane diagrams for various purposes. To create a swimlane diagram in EdrawMax, you can follow these three simple steps:
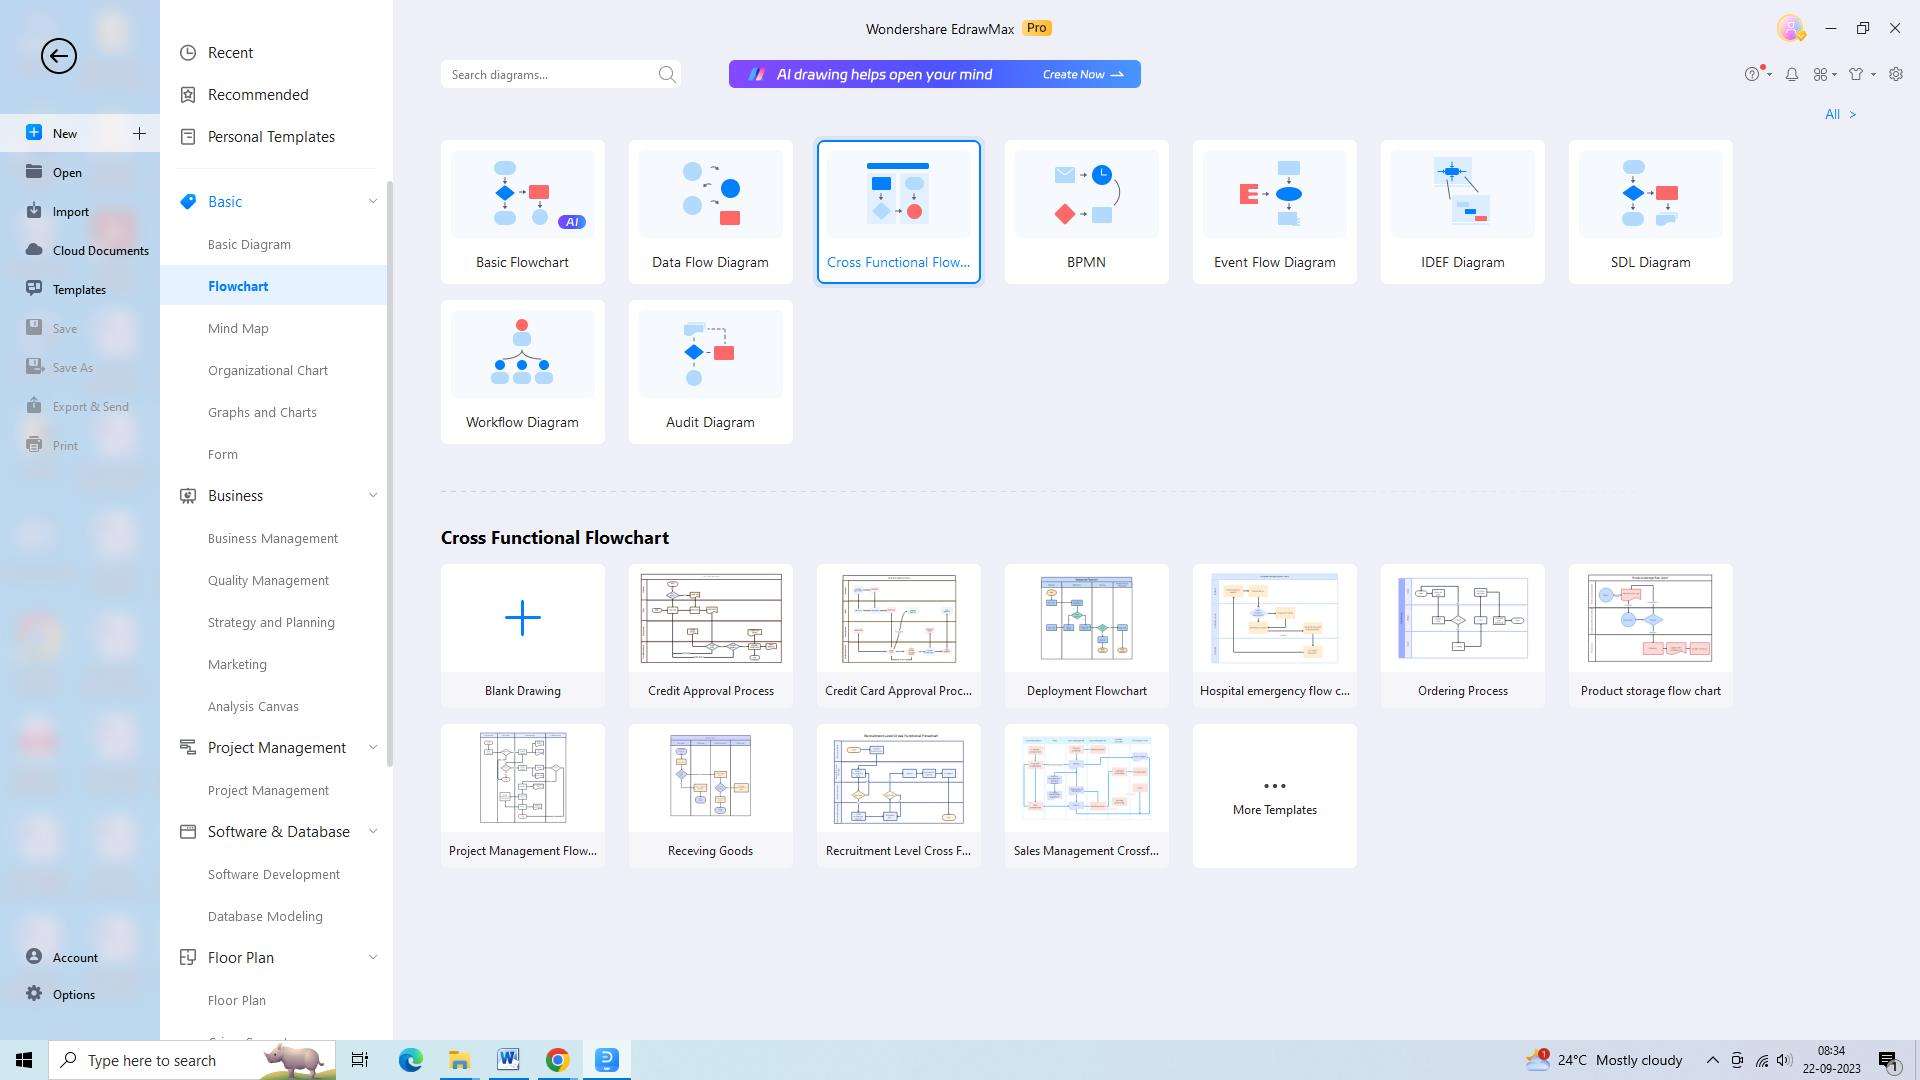
Step 1: Pick a Swimlane Diagram Template
- EdrawMax provides a variety of swimlane diagram templates to choose from. You can access these templates by clicking on the "New" button on the toolbar and selecting the "Swimlane Diagram" category.

- Browse through the available templates and choose the one that best suits your needs. Once selected, the template will open in the main workspace.
Step 2: Make Required Adjustments
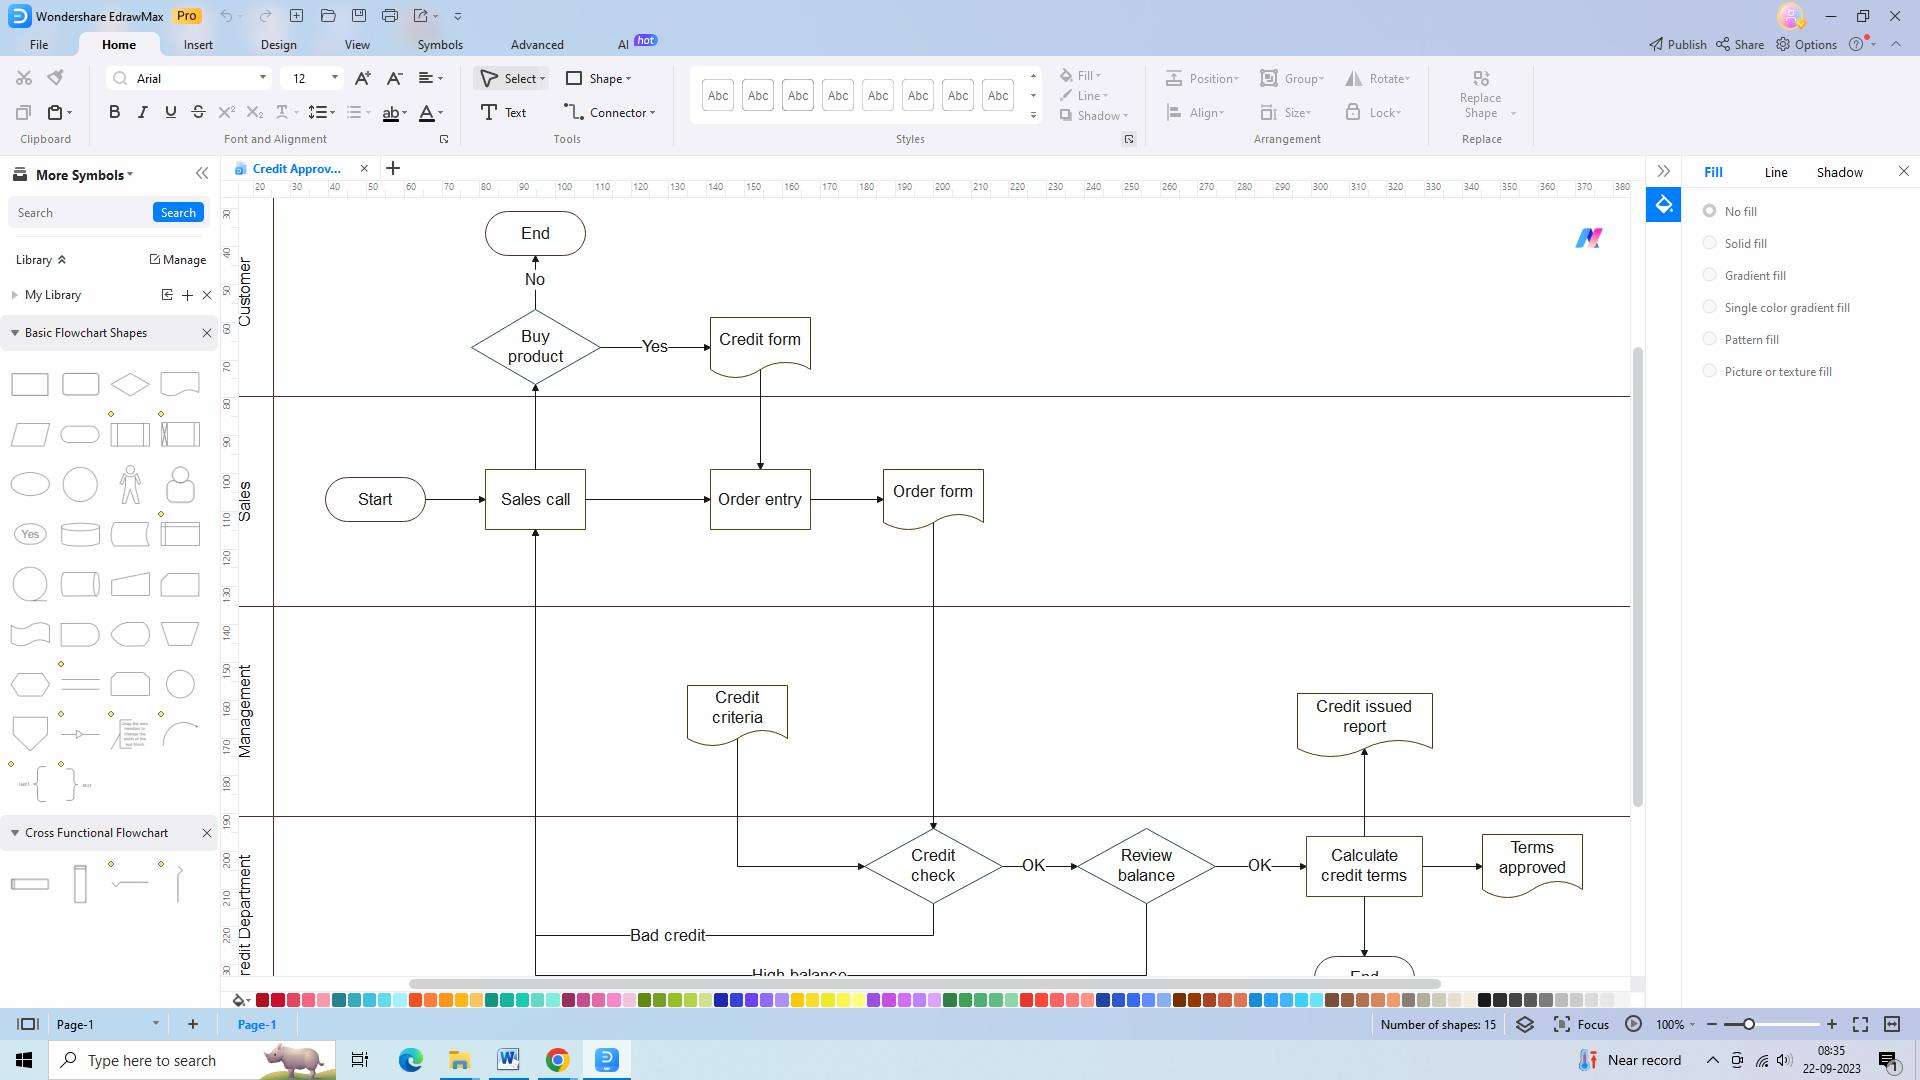
- After selecting a template, you can start customizing it to represent your specific process or workflow. You can add or remove swimlanes, rename them, and resize them to accommodate the required information. Additionally, you can add shapes, text boxes, and icons to represent the different tasks, responsibilities, or departments involved in the process.
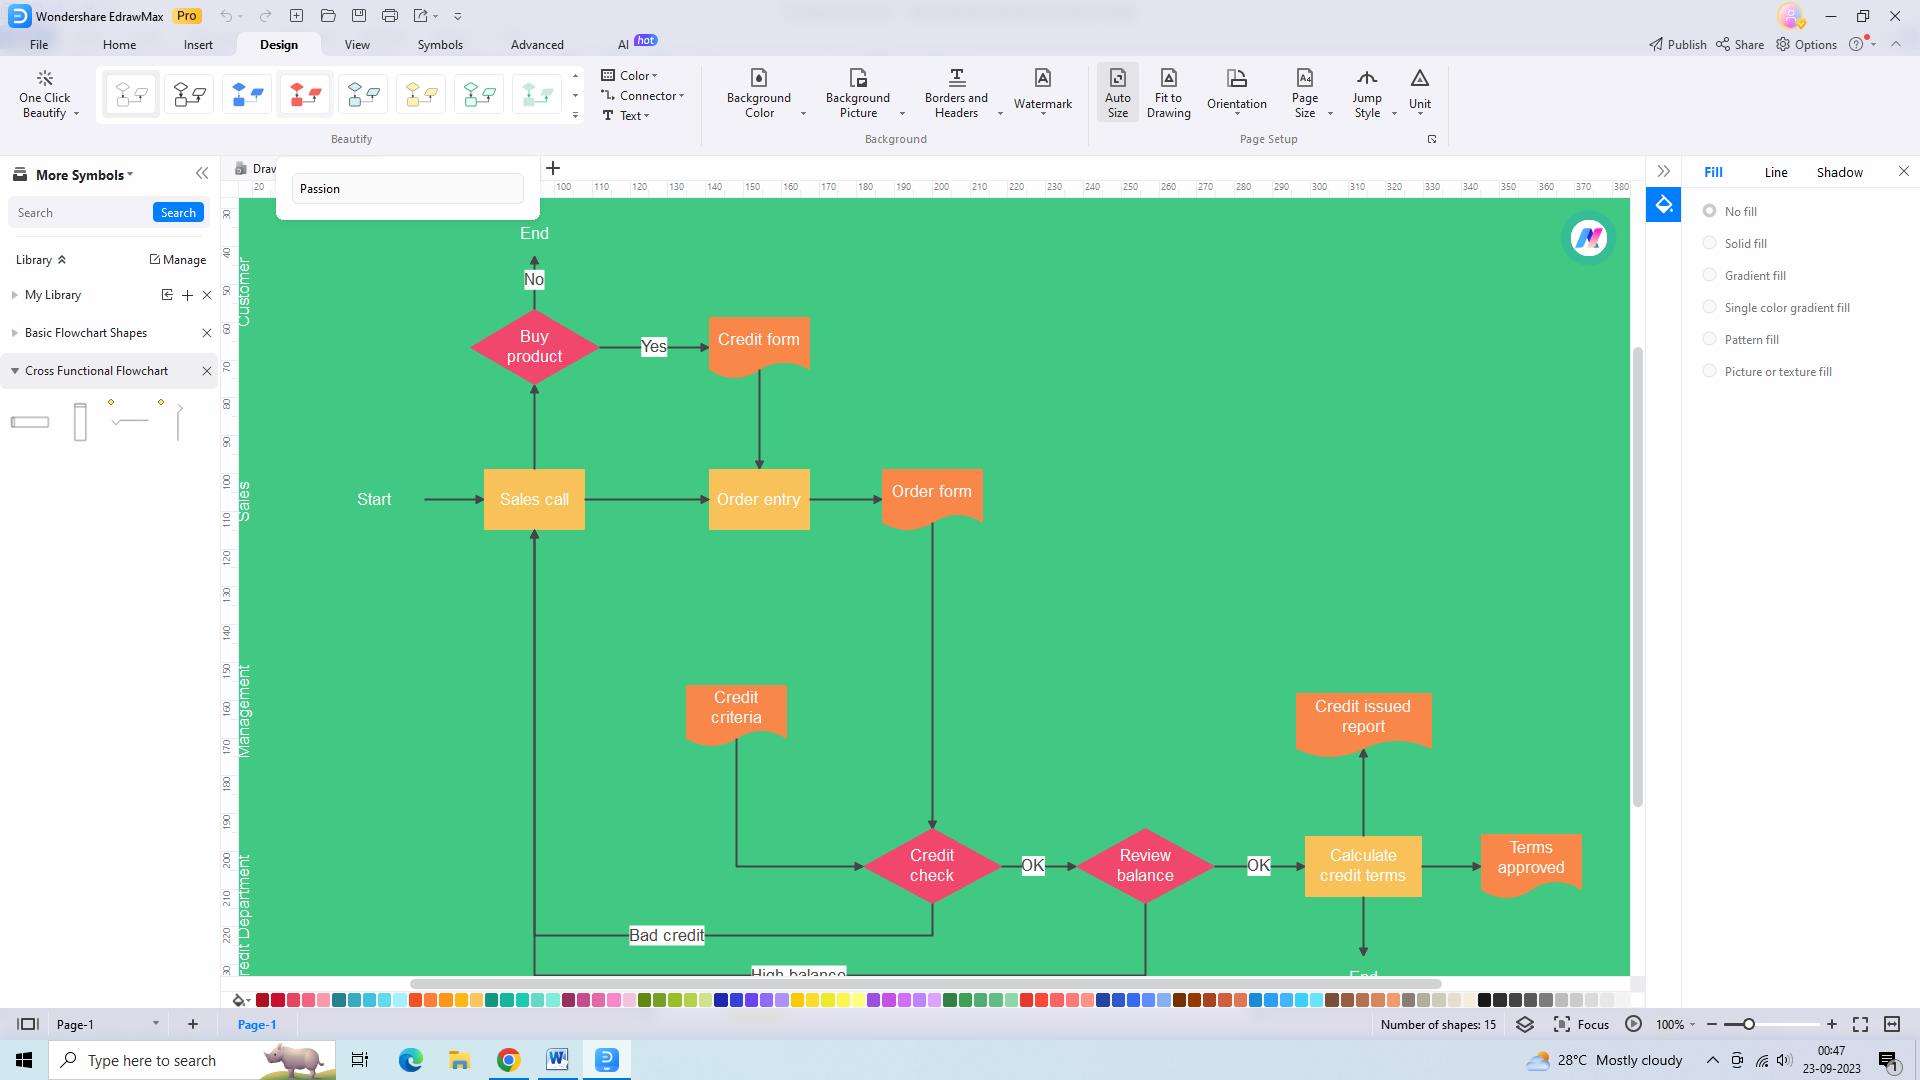
- Use the formatting options to change the color, font, and style of the elements to make the diagram visually appealing and easy to understand.
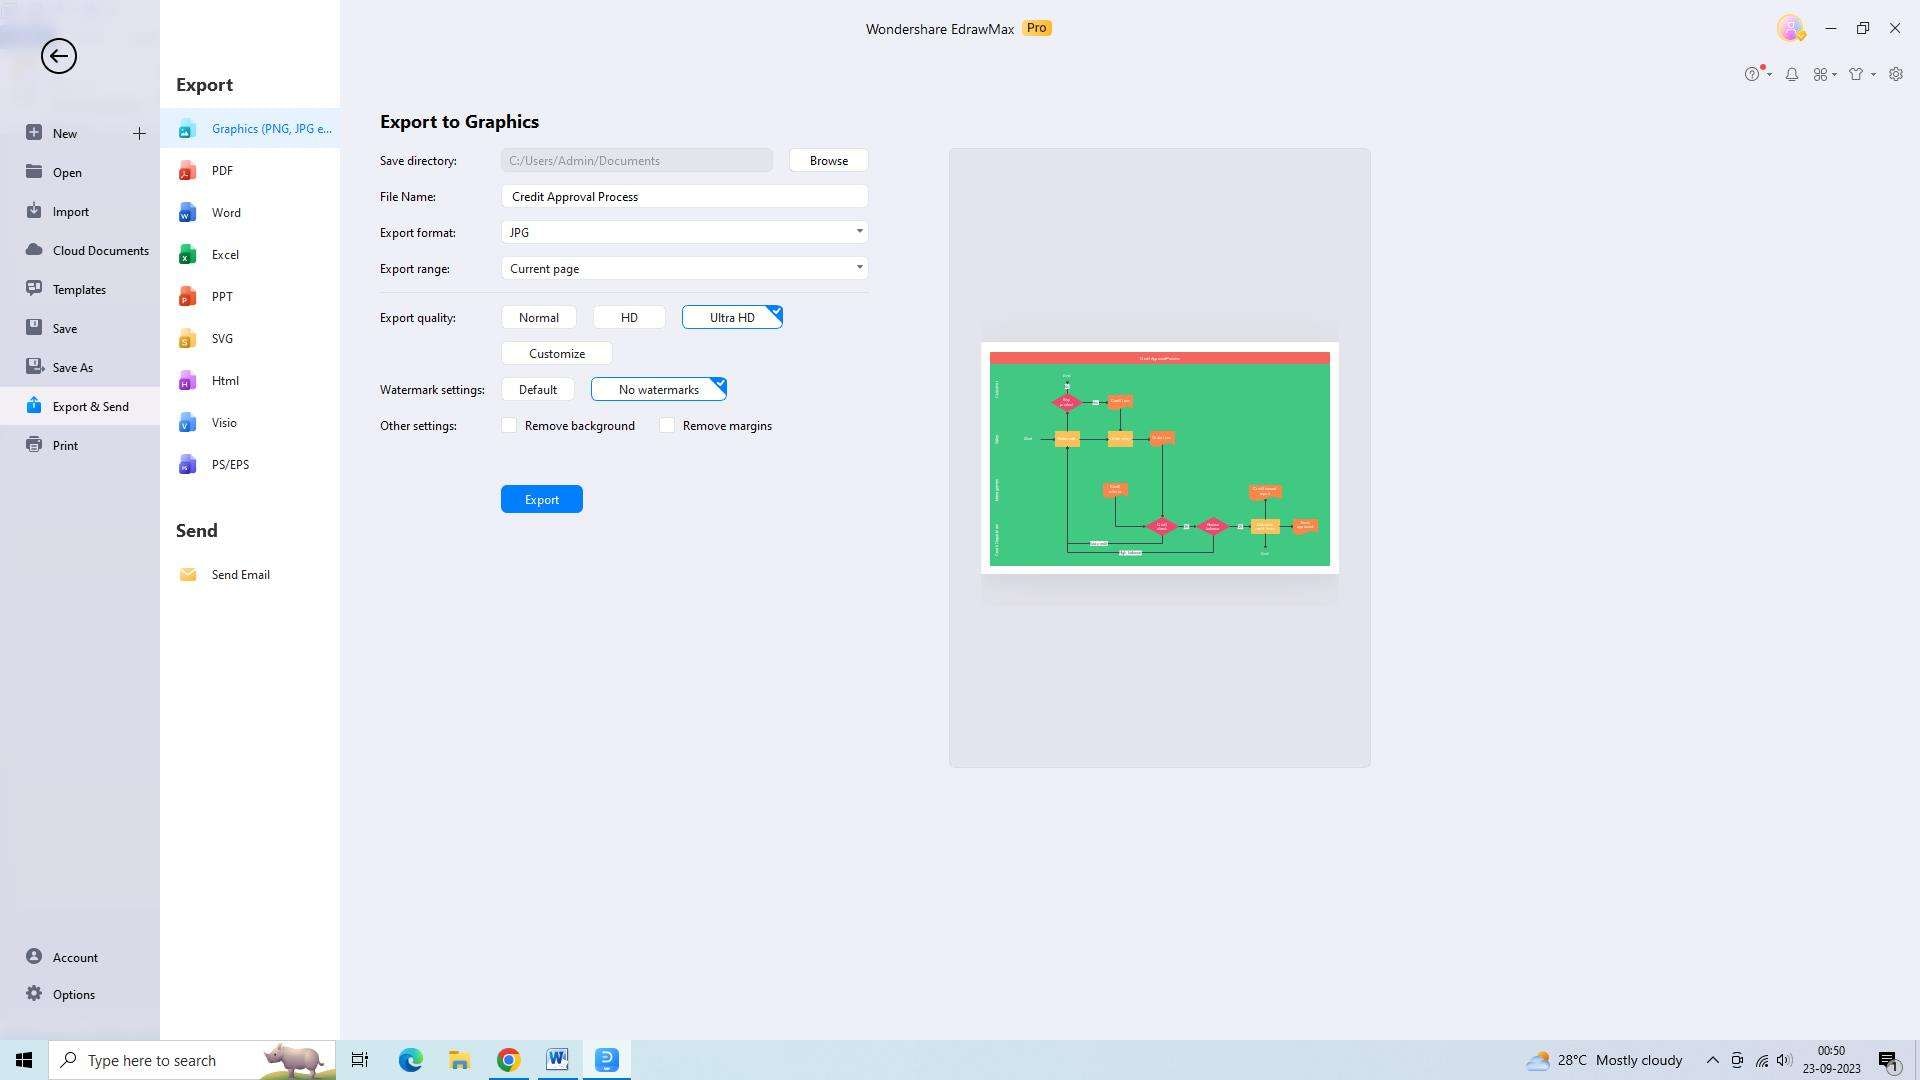
Step 3: Export the Diagram
- Once you have finished creating and customizing your swimlane diagram, it's time to export it for further use or sharing. To export the diagram, go to the "File" menu, select the "Export" option, and choose the desired format. Specify the file name and destination, and click "Export" to save the diagram to your computer.
Steps to prepare swim lanes in Excel
Creating a swim lane chart Excel is easy and does not involve much hassle. Here are the steps to create swimlane diagrams in Excel:
Step 1: Format Cell Height and Width
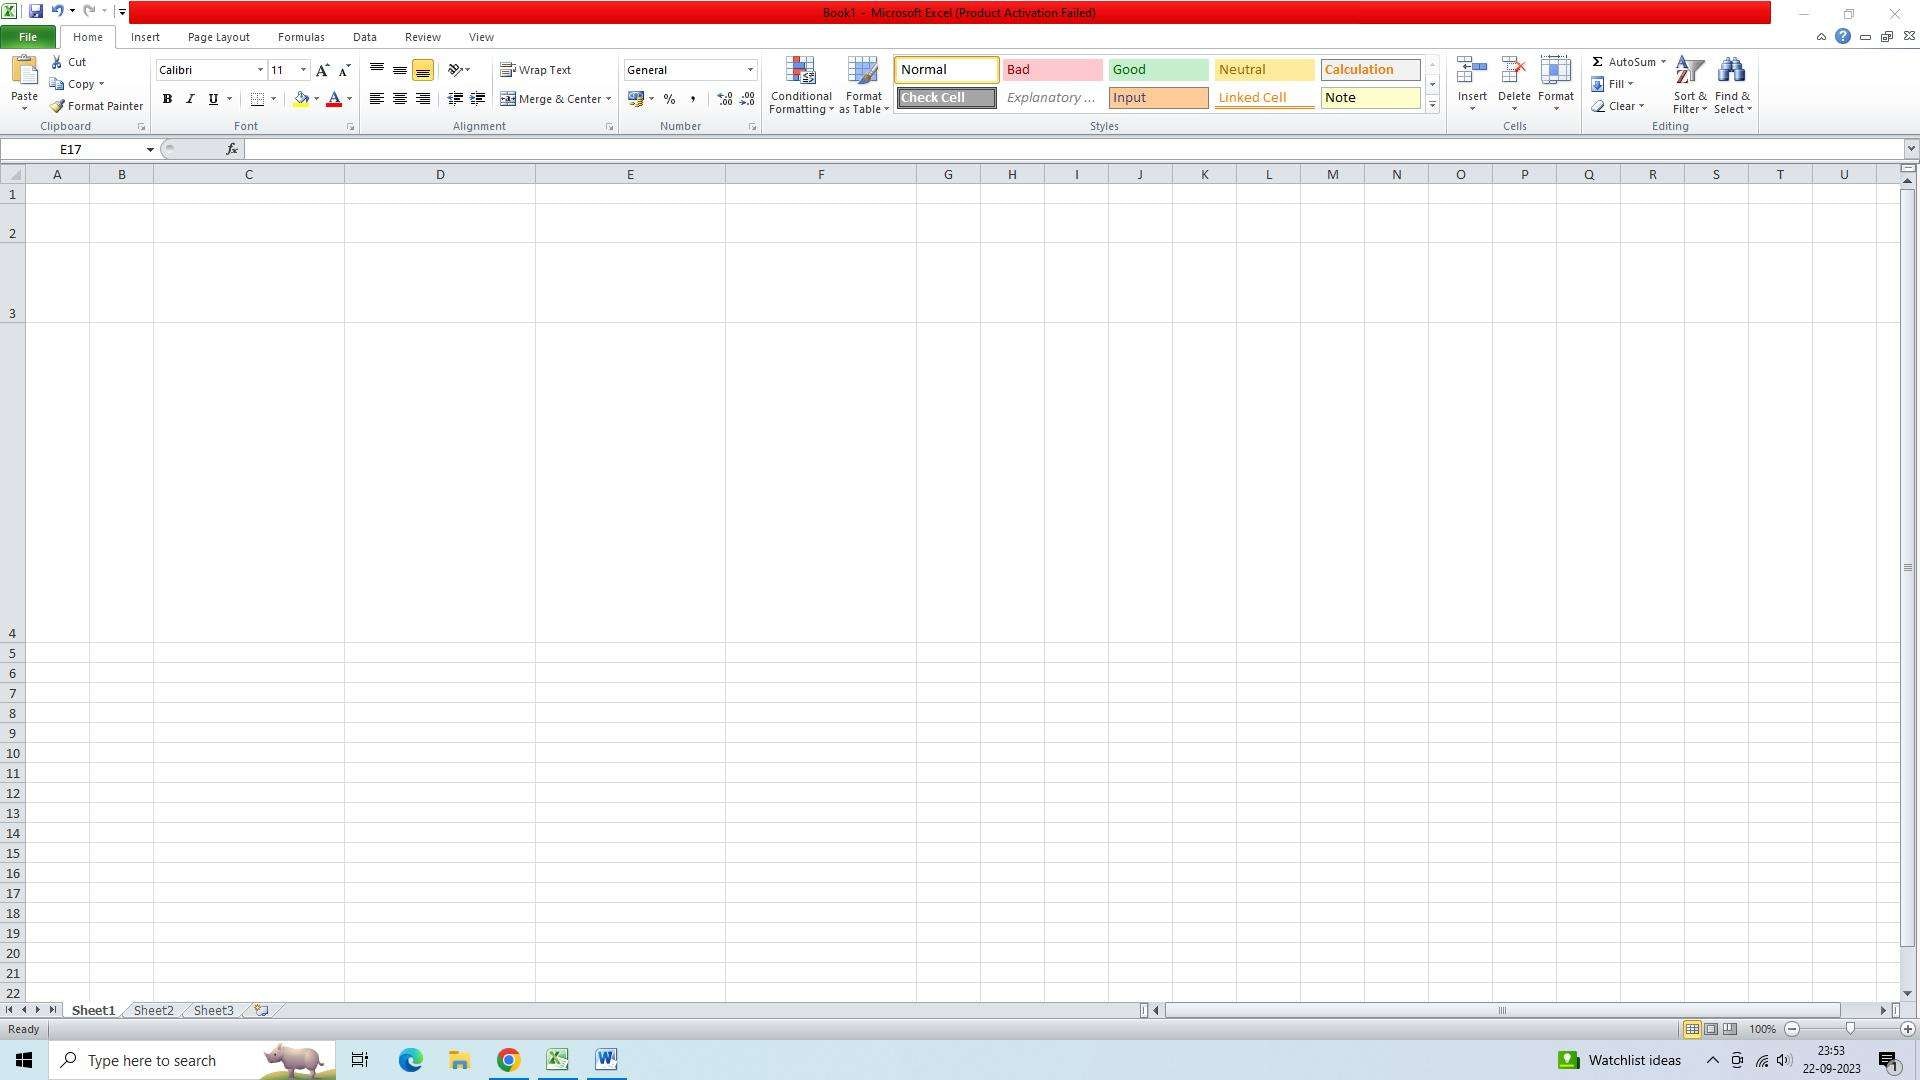
- To start preparing swim lanes in Excel, adjust the cell height and width to create the desired size for the swim lanes. You can do this by selecting the cells you want to modify, right-clicking, and selecting "Format Cells."
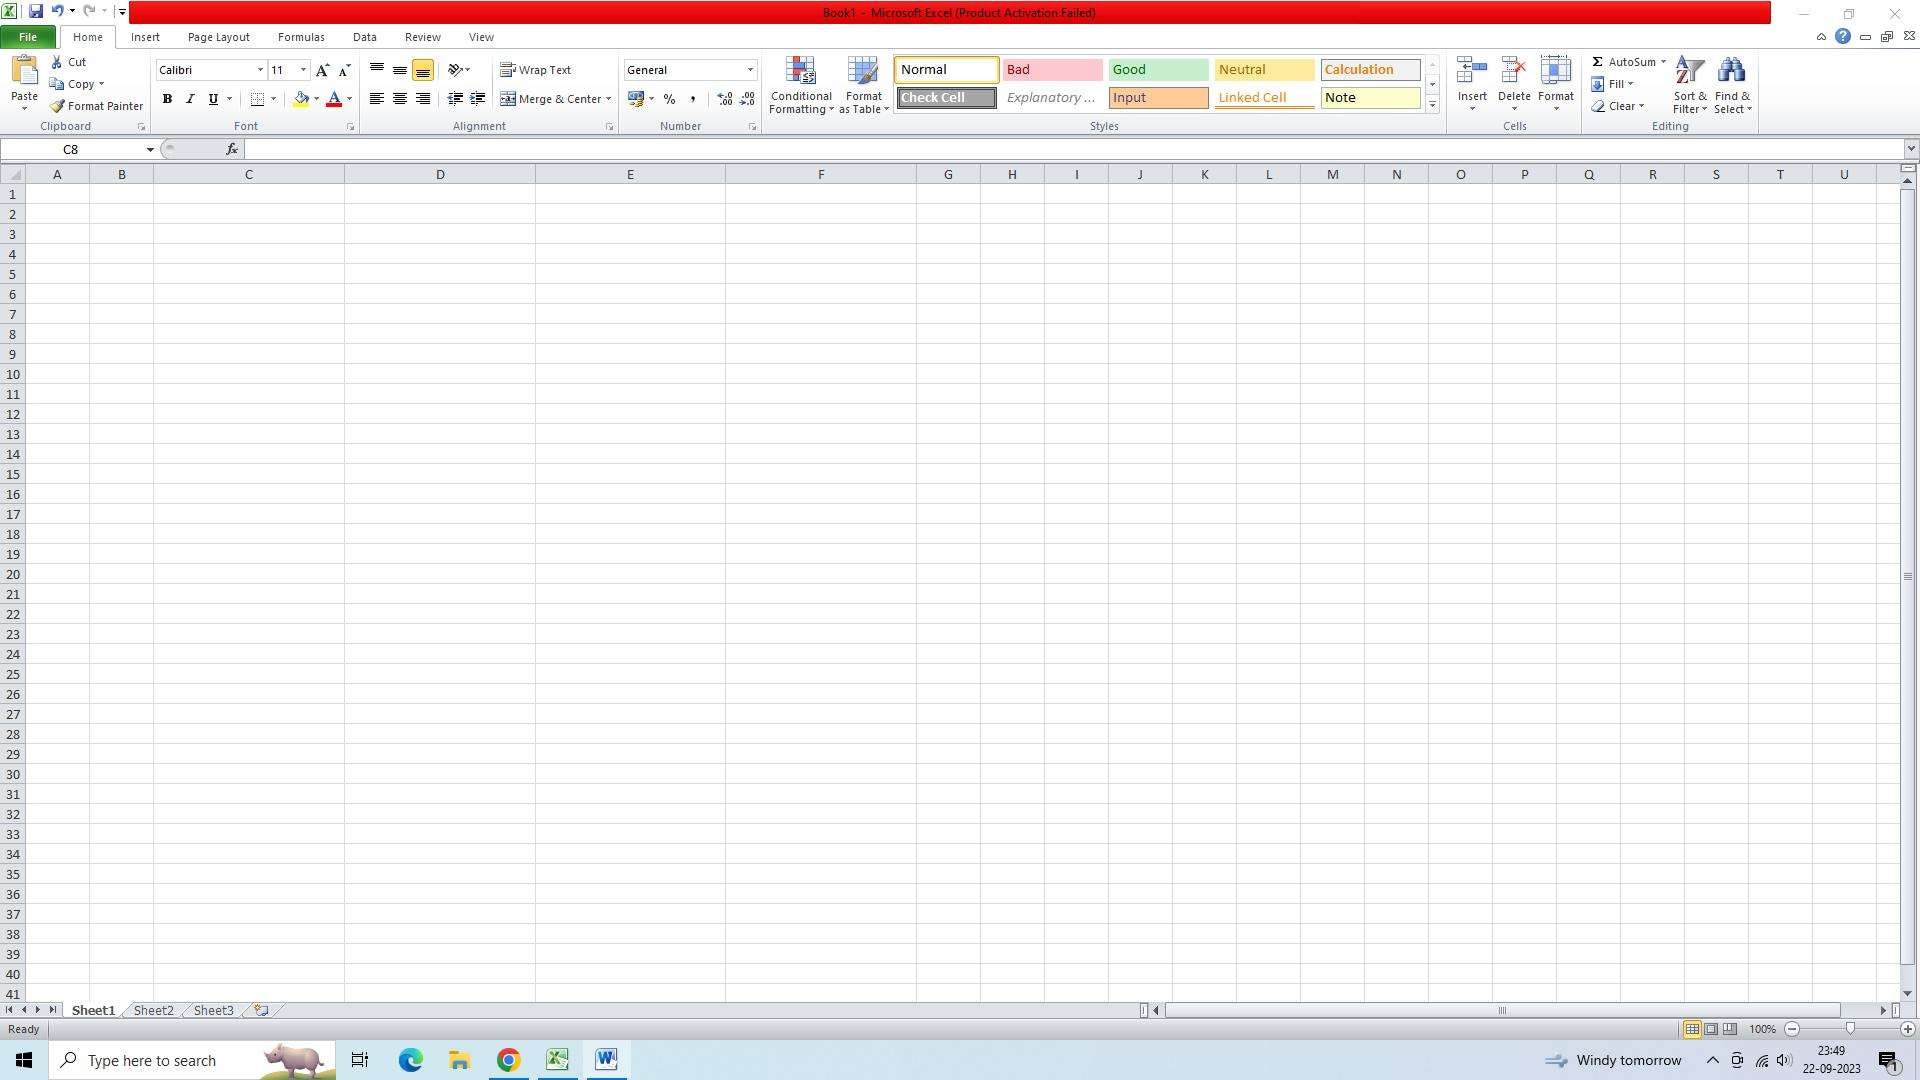
- From there, go to the "Alignment" tab and adjust the values for height and width accordingly.
Step 2: Label the Container
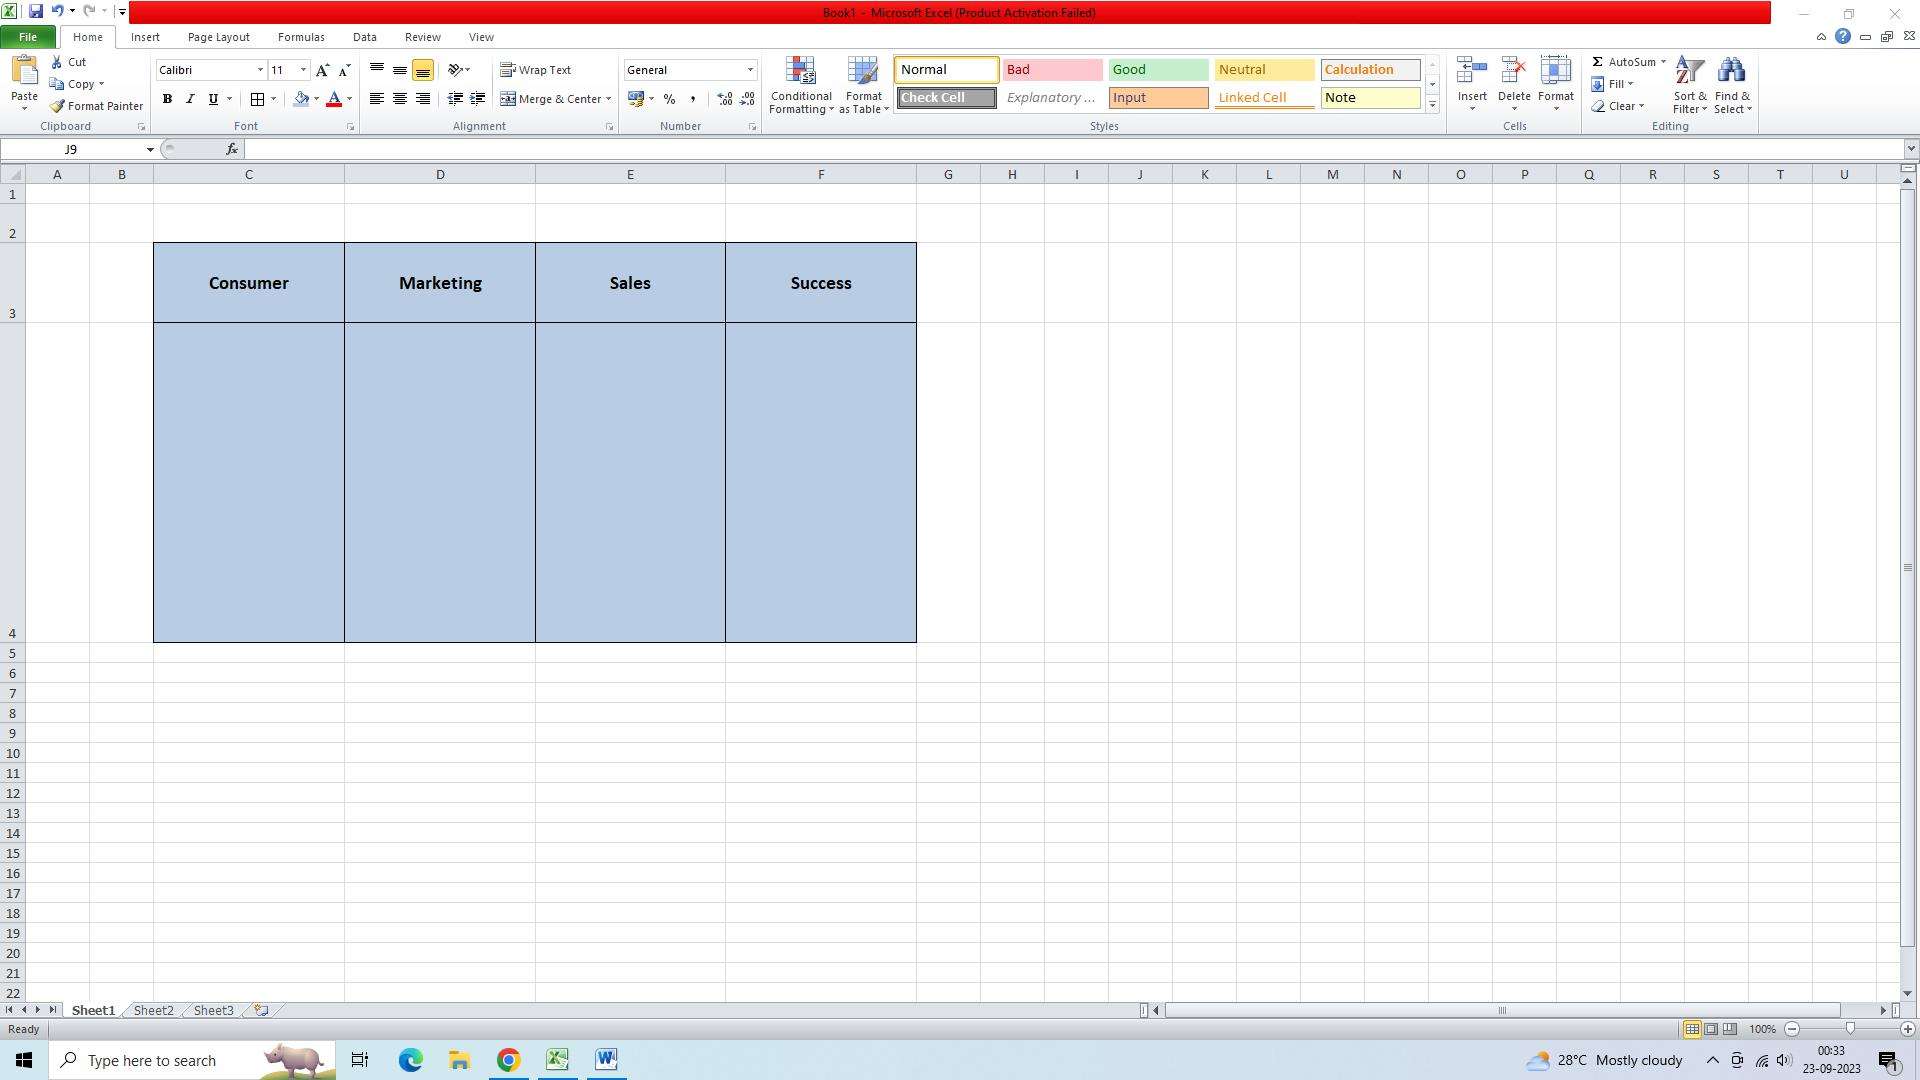
- Next, label the swim lane container by merging cells and adding text. To do this, select the cells you want to merge, right-click, and choose "Format Cells."

- Then, go to the "Alignment" tab and check the "Merge cells" option. After merging the cells, add the desired text by typing directly into the merged cell.
Step 3: Create a Flow Chart
- To create a flow chart within the swim lane, use shapes and connectors in Excel. Start by selecting the "Insert" tab and choosing the desired shape from the "Shapes" section.
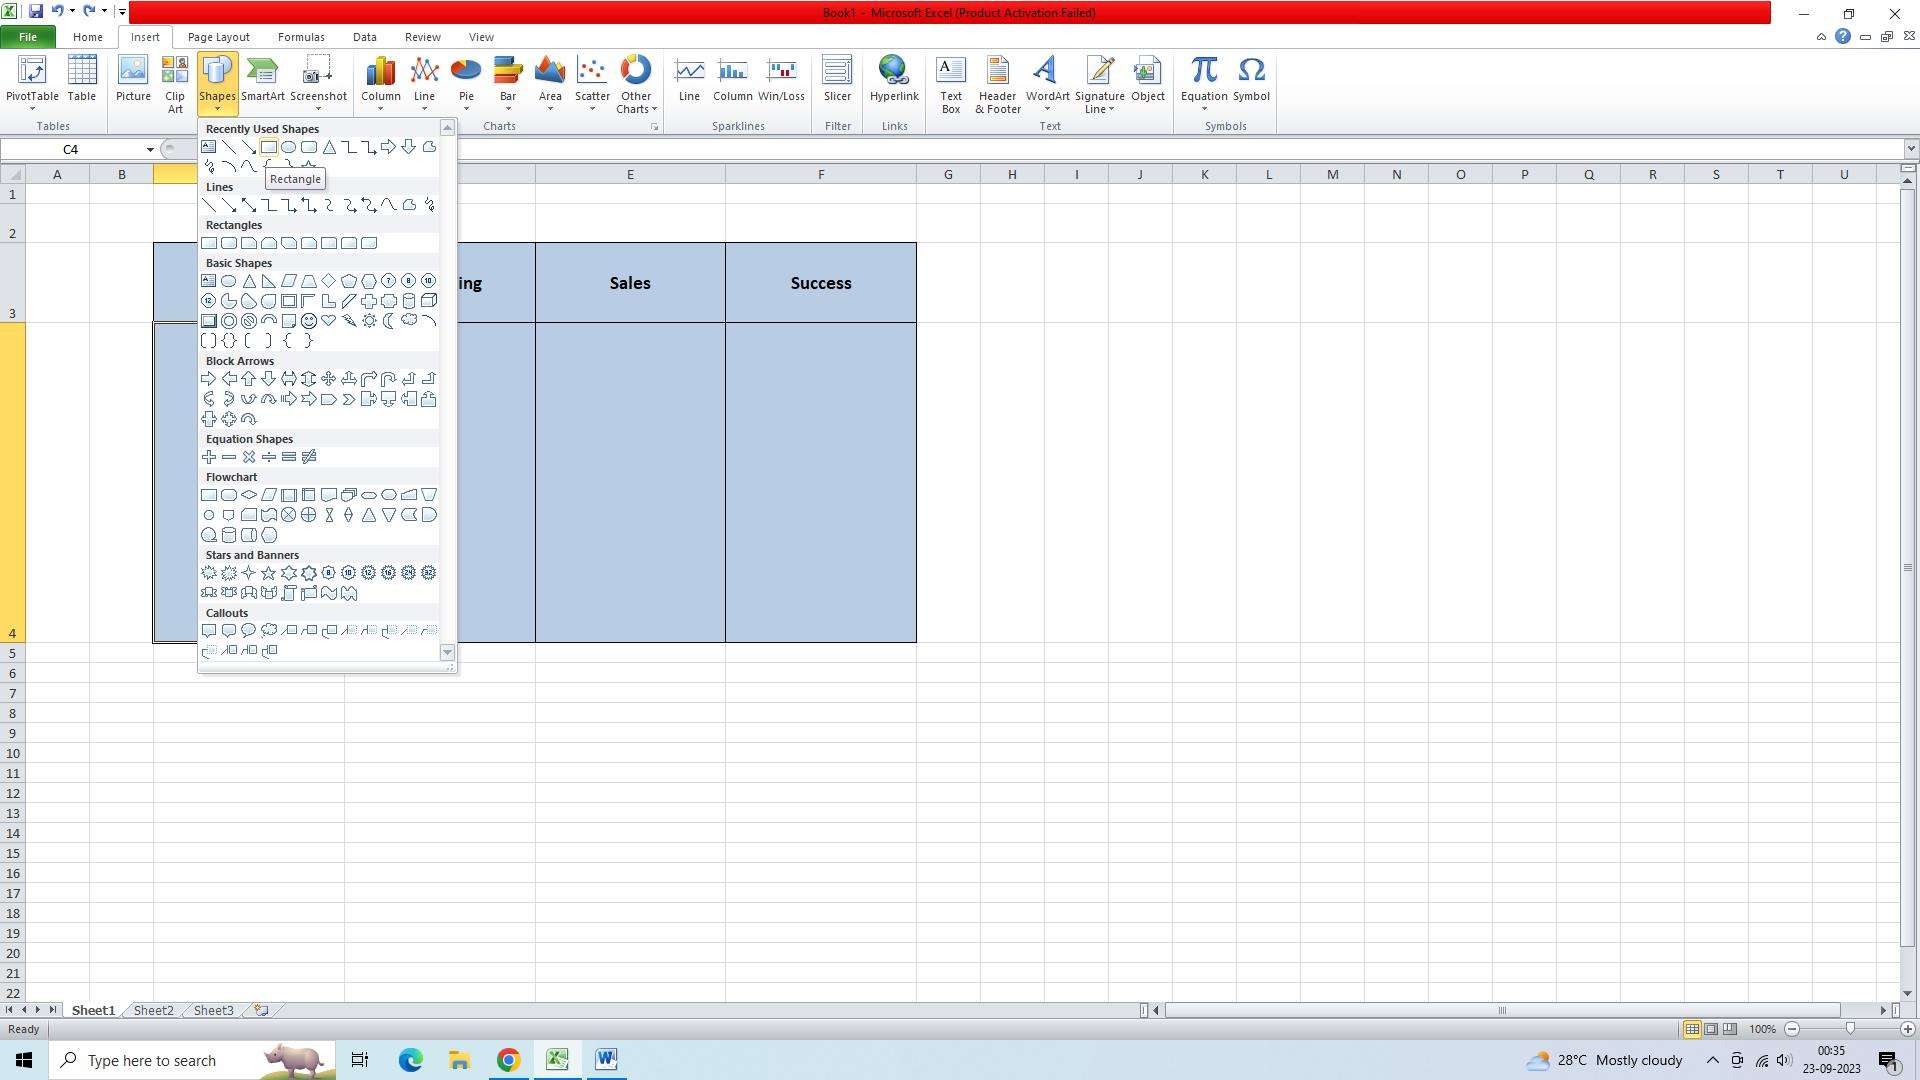
- Click and drag on the worksheet to create the shape. Repeat this step for each shape you want to add to the flow chart.
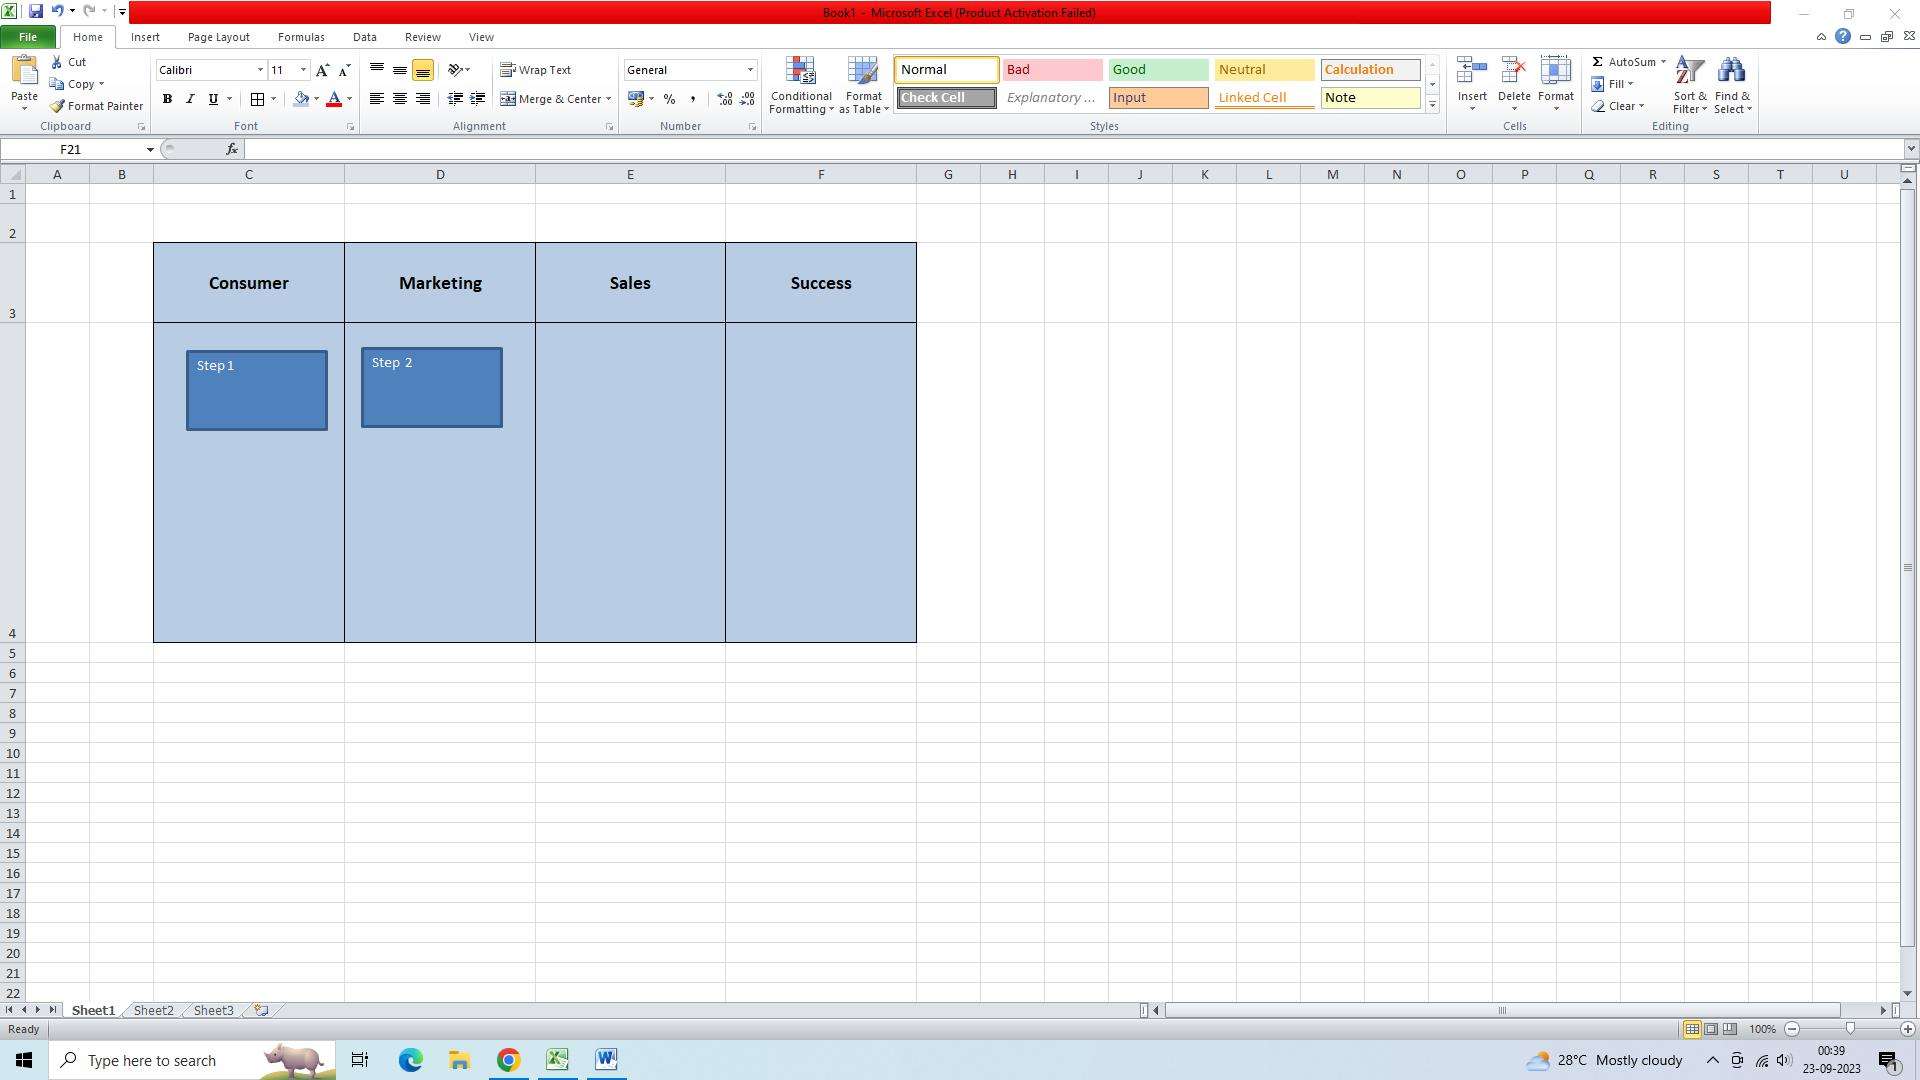
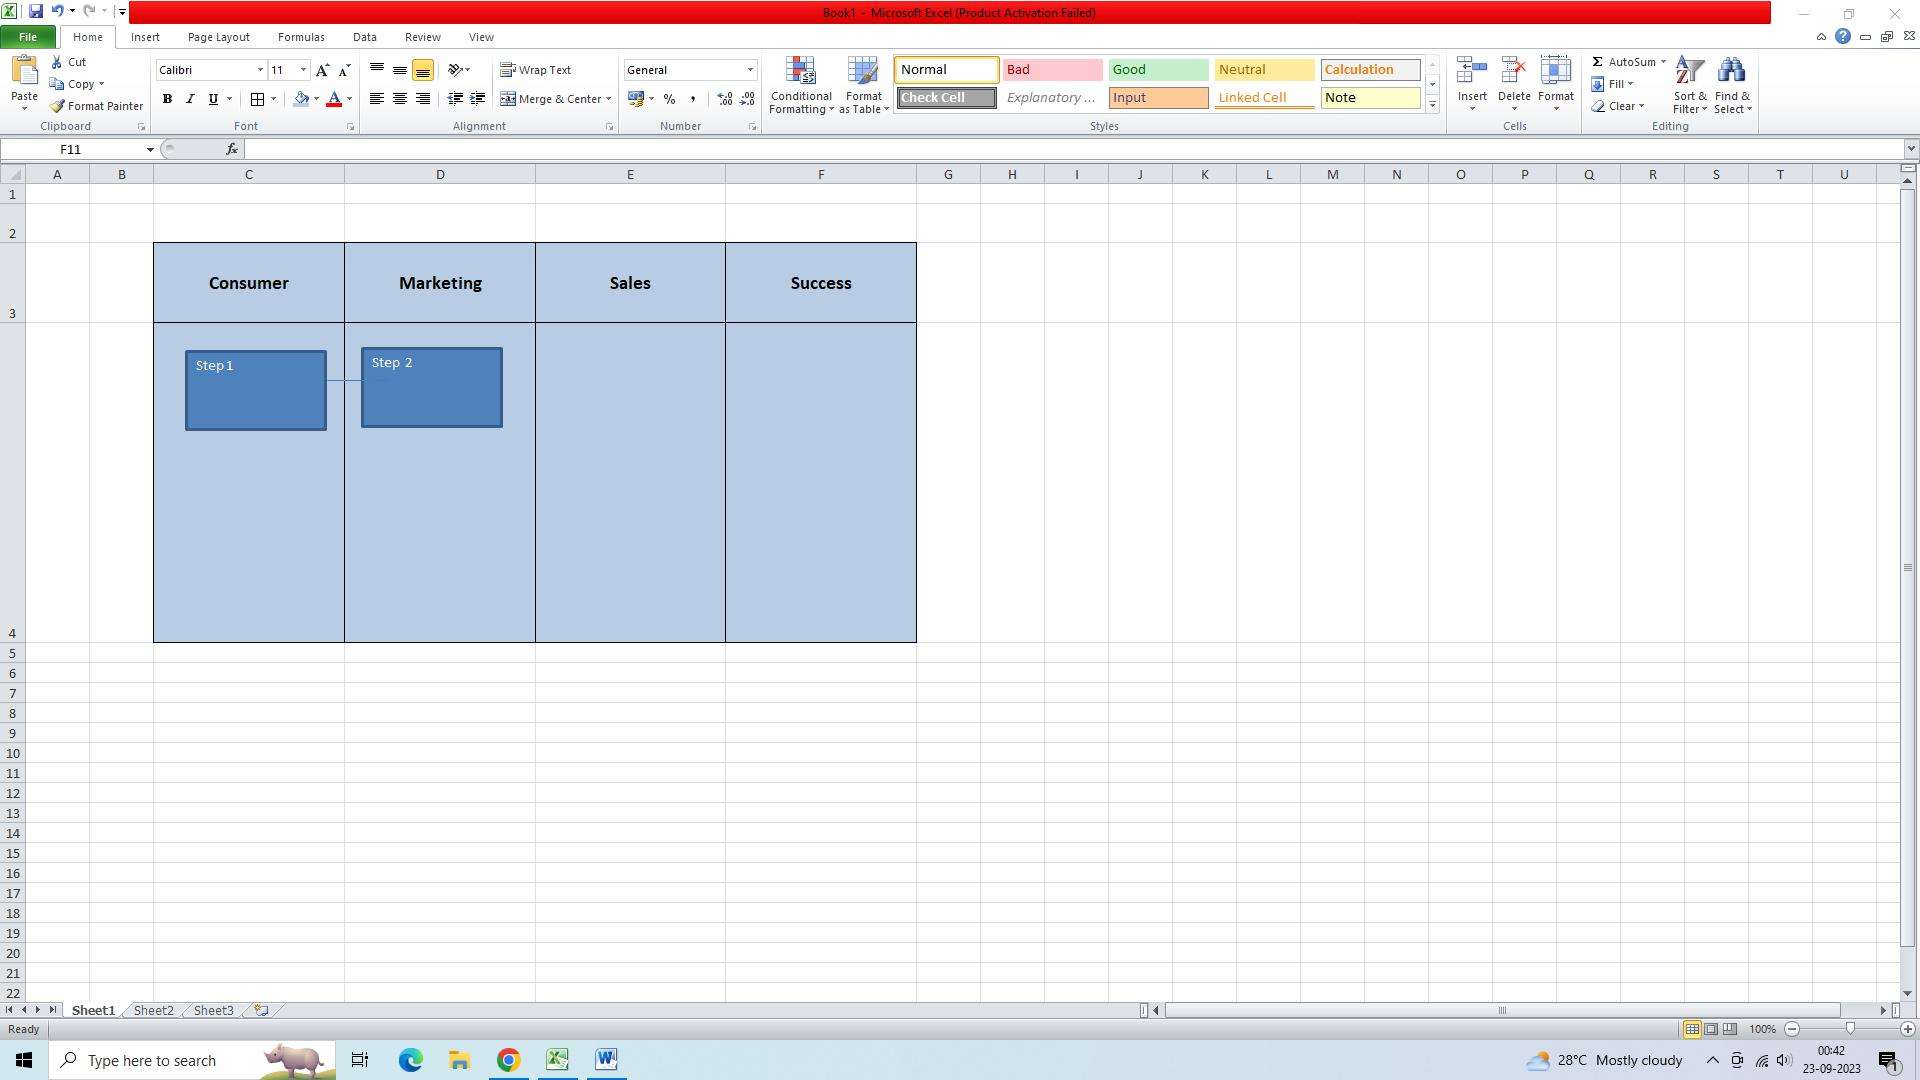
- Then, use the connectors from the "Shapes" section to link the shapes together in the desired order of the flow chart.
Conclusion
Swim lane diagrams in Excel offer a practical way to represent and analyze processes. By following the steps outlined in this article, you can easily prepare swim lanes in Excel. Formatting cell height and width, labeling the container, and creating a flow chart using shapes and connectors are key components of swim lane diagrams. These swimlane chart excel diagrams help organizations identify inefficiencies, improve communication, and enhance overall productivity. So, the next time you need to visualize a process or workflow, consider using swim lane diagrams in Excel to gain a comprehensive understanding of responsibilities and interactions.


