


When writing a thesis, dissertation, or academic article, you need to present information in a structured way. To do this, researchers use different methods and approaches to gather and analyze data. The methodology section of a thesis is important because it explains what you did and how you conducted your research. This helps readers evaluate the accuracy and trustworthiness of your work.
Most researchers employ methodology flowchart thesis presentations to strategize, structure, portray, and conceptualize their research methodologies. This article demonstrates the importance of thesis methodology flowcharts through real-life thesis flow chart examples and a practical way to construct them.

In this article
Part I: Importance of Thesis Research Methodology Flowcharts
The research thesis methodology flowcharts show how you will tackle your research questions, making your research more successful. Creating a thesis flowchart involves studying the theories and ideas that guide the procedures in your field and organizing your activities in a step-by-step order.
Research methodology flowcharts are very important because they provide a clear plan that helps researchers stay focused and makes the process efficient and manageable. It ensures that your conclusions are based on scientific principles and gives your research credibility.
Part II: EdrawMax- A One-Stop Solution to Thesis Methodology Flowchart Designing Needs!
Creating a structure for your dissertation takes a lot of time. You need to organize your ideas and have strong supporting details. If you don't arrange things in order, your ideas can become confused and unclear. To avoid this, you need a modern diagramming tool that can help you save time and focus on writing your dissertation.
EdrawMax helps you bring your ideas to life when designing thesis flowcharts. It has many useful features like a wide range of symbols, the ability to create multiple pages, helpful alignment tools, easy customization options, and various ways to export your work. Whether you're a student, researcher, teacher, or anyone in education, EdrawMax is a complete solution for all your drawing needs.
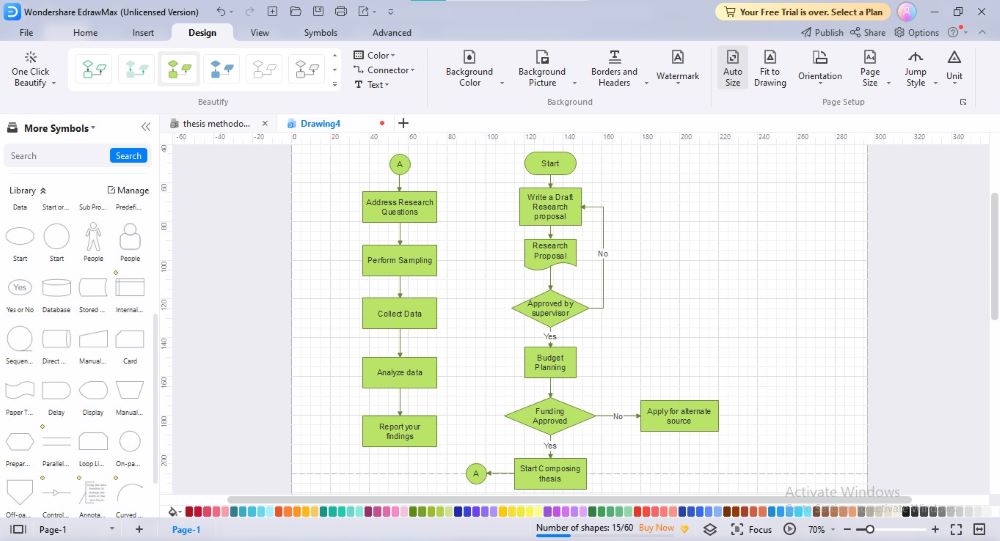
Visual Illustration of a Thesis Methodology Flowchart
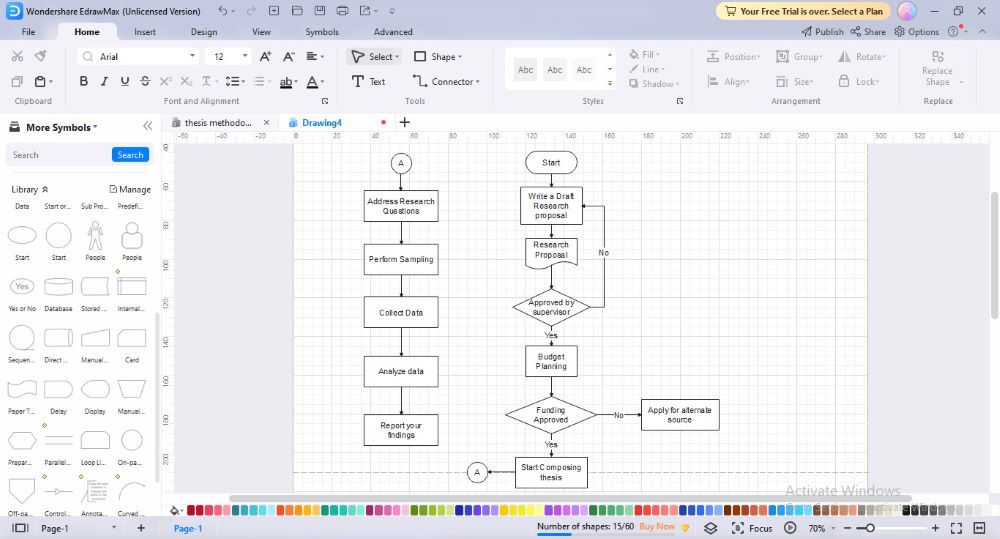
Consider this practical methodology flowchart thesis example to gain insights into how a well-structured thesis methodology flowchart seems:

 below.
  below.
 When you conduct research, it's important to follow a step-by-step process to ensure accurate and reliable results. This process involves discovering, collecting, evaluating, and presenting ideas in a specific order. By following this standardized procedure, your thesis will be reliable and won't have any incorrect findings. Here is the methodized step-by-step process to help you formulate your thesis research methodology:
Preliminary Strategizing
Before starting your research, it's important to plan ahead. This involves choosing the location, field, and community where you will conduct your research. It's also important to get permission from the community to conduct your research, as it's an ethical concern.
Next, you need to set a clear objective for your thesis and come up with a logical research question. You can do this by observing, studying, or analyzing a situation. Observations can be intentional, where you purposely observe a specific behavior in a community. Sometimes, research questions arise from analyzing current situations, like the coronavirus, pollution, or poverty in a certain town.
Data Collection
Collecting data is an important step in research. It involves observing or measuring things in a systematic way. Before you start collecting data, you need to clearly define your goals. You can do this by explaining the problem you want to address. For example, you might collect data on bomb blast victims or people with aggressive behaviors.
There are two types of data: primary and secondary data. Primary data is information that you collect directly from original sources. Secondary data, on the other hand, is information that has already been gathered or processed by someone else.
Data Processing
After collecting data, the next step is to decide how to process and analyze it. Data processing is when you take the collected data and turn it into useful information that can be used by others. This information can help support or disprove theories, make decisions, or bring about positive changes in a community.
To choose the right data processing method, consider the nature and type of your research and think about your thesis research question. It's important not to get too specific at this stage and avoid discussing any results. Focus on finding a suitable technique that will help you process and analyze your data effectively.
Data Analysis
Researchers use data analysis to make sense of their research findings by organizing, combining, summarizing, and categorizing the data. This helps them identify patterns and themes in the information they have collected.
In the thesis methodology flowchart example mentioned above, the data analysis techniques used are lean and Six Sigma concepts. These methods follow a series of steps, including defining, measuring, analyzing, categorizing, and improving the data to make it more meaningful and valuable.
Evaluation Phase
Data evaluation is a way to check if data is trustworthy, thorough, and consistent. It involves comparing data with specific goals, finding any missing information, and discovering trends, patterns, and connections. Another name for data evaluation is data mining because it uses statistical analysis to uncover valuable insights and generate better information.
Report Writing
Once you have finished your research, it's time to organize and present the information you have gathered. Report writing involves putting all the information together, drawing conclusions based on your findings, and providing recommendations based on the results. It's important to consider who will be reading your report, as the audience plays a significant role in how you present your information.
Part III: How to Craft a Detailed Thesis Methodology Flowchart Using EdrawMax?
EdrawMax is a user-friendly and affordable tool that helps people create detailed diagrams quickly. It's accessible to both small and medium-sized users, making it easy for everyone to make complex diagrams in just a few minutes. Let's see how you can use EdrawMax to create a fantastic flowchart for organizing your thesis.
Step1
Download and launch "EdrawMax" on your device for thesis methodology flowchart creation.
Step2
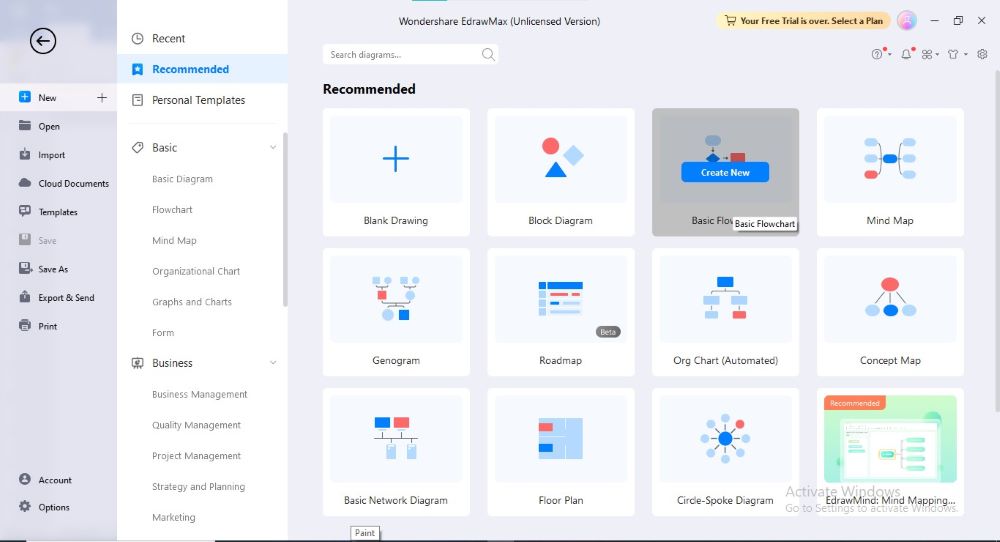
Click the "New" tab in the left pane, hover over the "Basic Flowchart" tab, and click the "Create New" button.
Step3
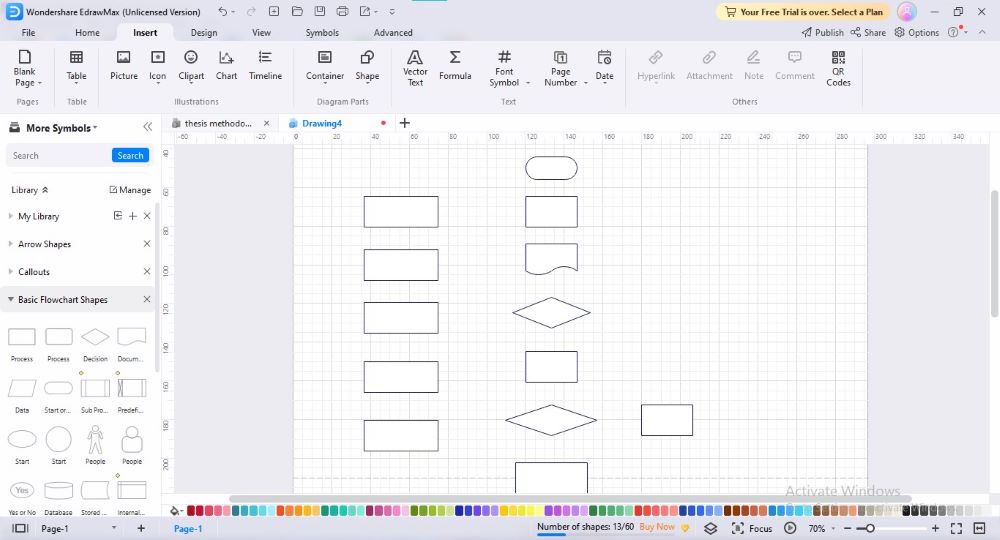
Sketch the skeleton of your thesis methodology flowchart by drawing all the required shapes on the canvas at accurate locations.
Step4
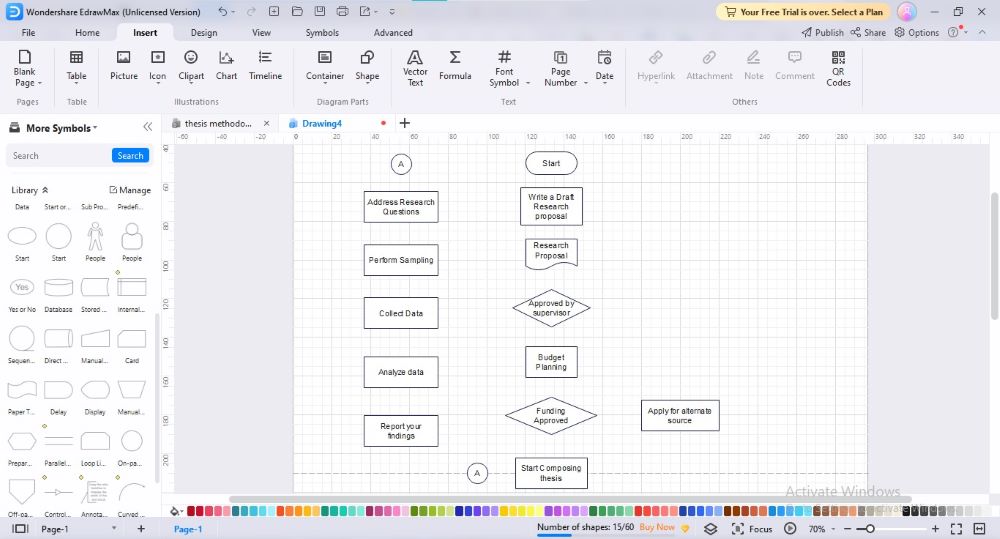
Embed relevant information in each box to portray your details in exact sequence; you can also rescale the shapes to accommodate larger texts.
Step5
Join all the shapes to develop a flow in your thesis methodology flowchart; for this, navigate to the "Connector" tab in the "Home" menu.
Step6
You can also personalize the outlook of your thesis research methodology flowchart for enhanced understanding; to do so, navigate to the "Design" tab and apply your desired changes.
Step7
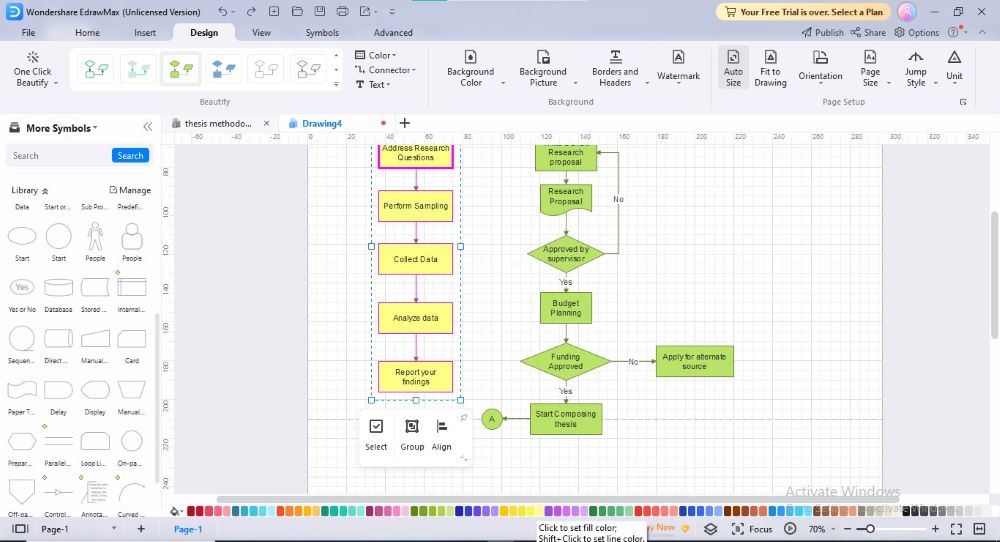
To customize an individual item or multiple items simultaneously, select those items and perform your preferred modification.
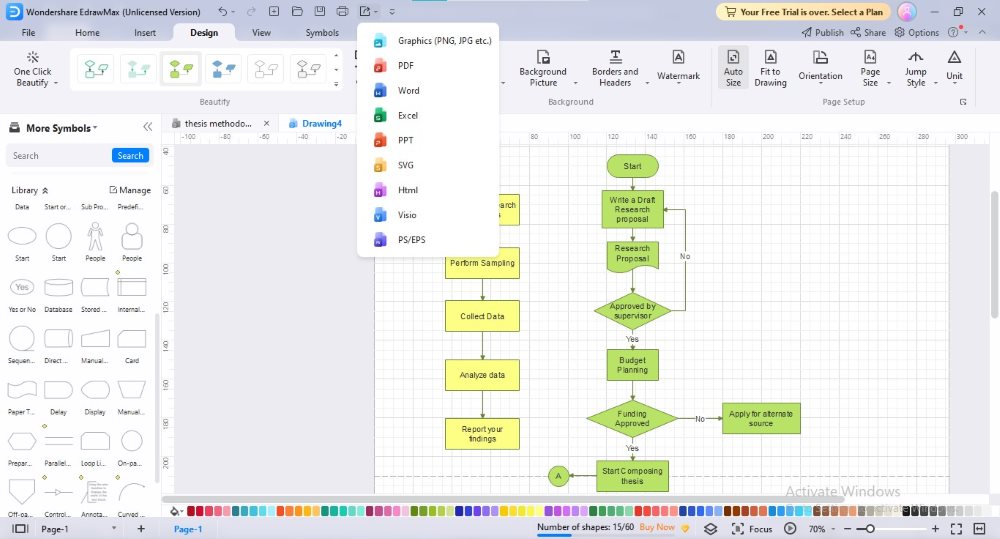
Step8
Click the "Export" option at the top and choose your desired format to save your research thesis methodology flowchart.
Benefits of Using EdrawMax for Thesis Methodology Flowchart Designing
Before using a diagramming application, it's important to consider its features, price, compatibility, and other important factors. Doing thorough research on these aspects will help you make an informed decision and avoid the inconvenience of switching between multiple tools because they don't have the right features for your needs.
EdrawMax is an excellent platform for designing methodology flow chart thesis projects because it offers a wide range of tools that suit everyone's needs. We have listed several reasons why EdrawMax is the best choice for creating your academic diagrams.
- EdrawMax has a Templates Community where you can find ready-made templates to save you the trouble of starting from scratch. It also has a variety of symbol libraries to create different types of flowcharts, making it more fun and expressive.
- With EdrawMax, you can add multiple pages to your thesis flowchart project, keeping your ideas organized and avoiding complexity. You can also enhance your flowcharts by adding pictures, hyperlinks, charts, tables, icons, and other elements to make them insightful and expressive.
- The user interface of EdrawMax is easy to use, with a quick toolbar that allows you to customize shapes and text with just one click. Even the free version of EdrawMax offers customization options like fill and border color, border style, width, rescaling, background type, connector type, and font customization.
- EdrawMax also supports real-time collaboration, which is helpful when you need to discuss and refine your methodology flowchart with your research supervisor. Additionally, you can export your methodology flowchart thesis file in various formats such as PNG, JPG, PDF, SVG, and Visio.
- Overall, EdrawMax provides a user-friendly and versatile platform for creating and customizing methodology flowcharts for your thesis.
Conclusion
Writing a thesis requires careful attention to analyzing and presenting research findings. The methodology you choose for your dissertation plays a crucial role in how you collect data, analyze it, and present your results. Whether you're conducting qualitative or quantitative research, the methodology you use has a significant impact on your entire dissertation.
To make your research more organized, you can create a thesis methodology flowchart. This flowchart helps you outline and visualize the step-by-step process of your research, from selecting techniques and approaches to analyzing data and presenting results. This article offers a detailed guide on how to create a practical and visually appealing thesis methodology flowchart to enhance your research process.
AI Diagram Generator
Enter your prompt. Upload files if needed. Generate diagrams, charts, or slides instantly.
