


I’ve sat in meetings where teams filled a board with scattered notes, only to leave with more confusion than answers.
What changed the outcome for us was a fishbone diagram template. Instead of endless lists, we sorted causes under clear categories such as people, methods, or environment.
That simple structure brought order, cut down the time we wasted, and ensured no category was left out.
That’s the point I'll discuss in this write-up: how a blank fishbone diagram template works better than starting without a frame.
In this article
What Is a Fishbone Diagram
 below.
  below.
 The fishbone diagram (aka Ishikawa or cause-and-effect diagram) is a structured framework to lay out all possible causes of a problem in one diagram.
Why Use a Cause-and-Effect Diagram
Its key function is root cause analysis. It reveals overlooked factors, keeps brainstorming orderly, and ensures ideas are appropriately categorized. In quality management, it doubles as a documented record of issue analysis.
What a Fishbone Diagram Looks Like
The name comes from its shape. The problem sits at the head, categories stretch out like bones, and specific causes branch off from them. The format naturally leads teams to investigate each area until the real cause is visible.
Where We Use Ishikawa Diagrams
It’s often applied in manufacturing, service improvement, risk management, and team ideation. From my own use, it proves most valuable when teams face recurring obstacles. It forces everyone to examine the whole process, not just single steps.
8 Best Blank Fishbone Diagram Templates to Try
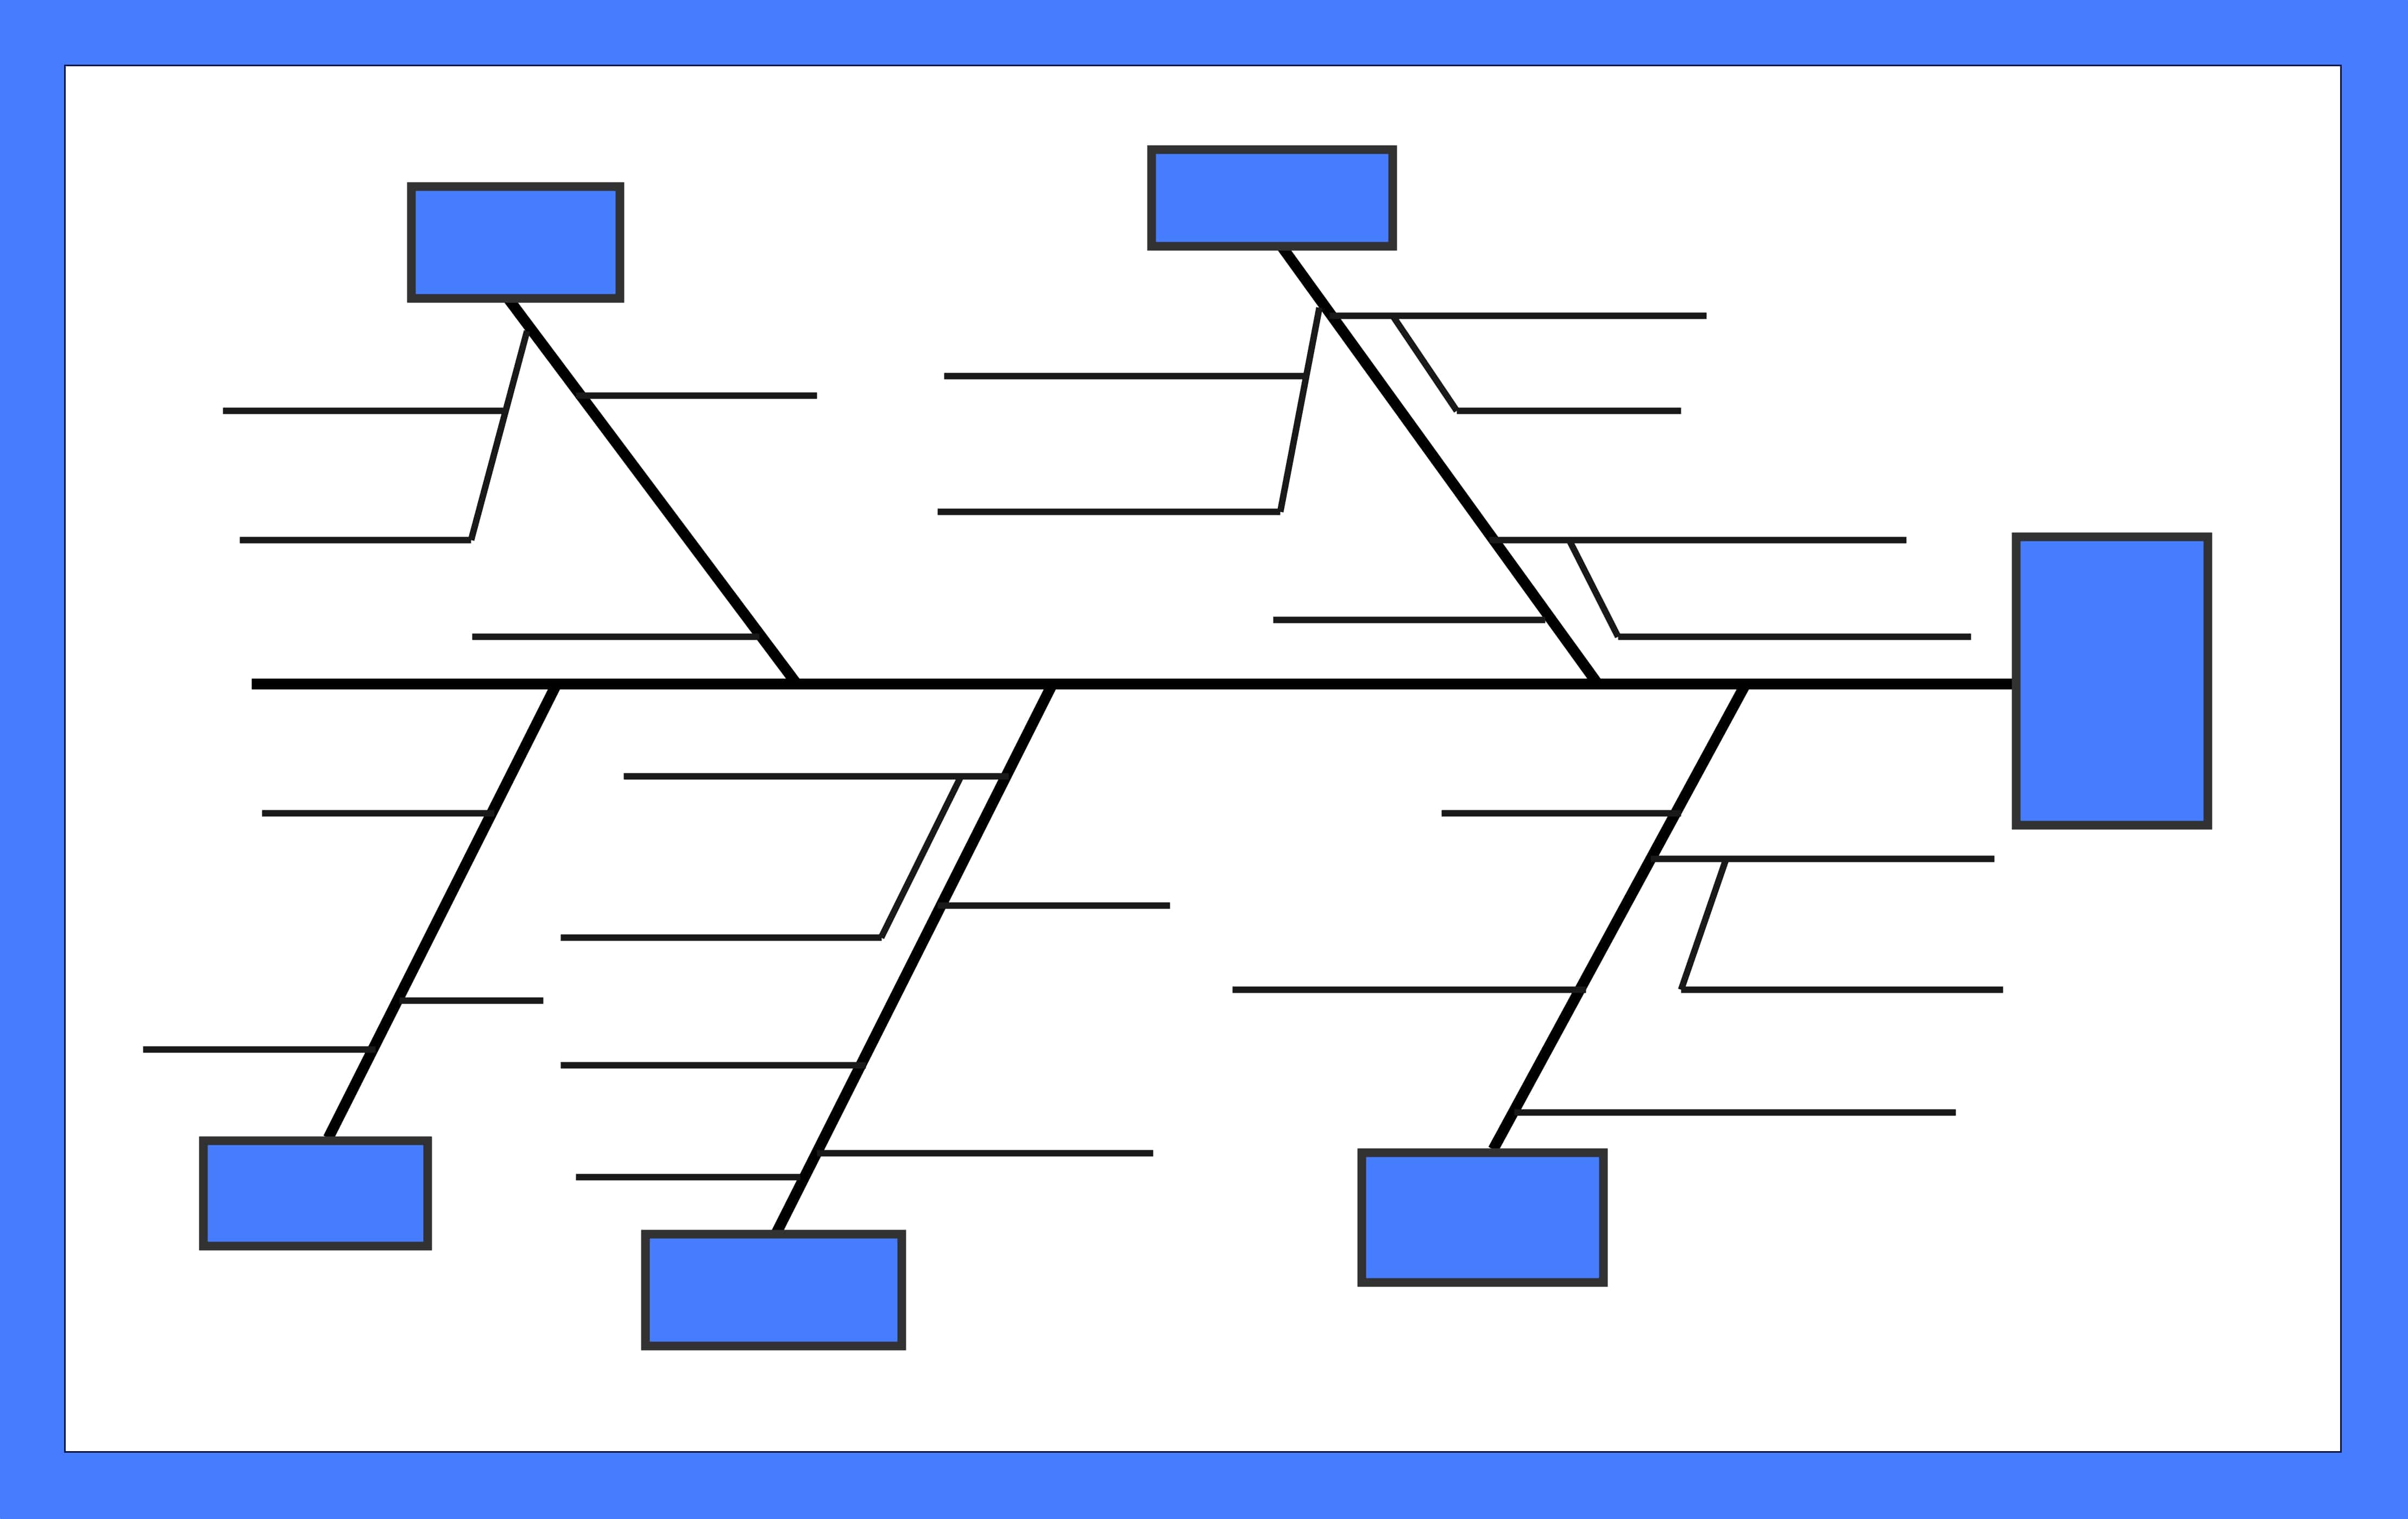
1. Stylized Minimalist Fishbone Diagram
The template uses a horizontal backbone that connects to the outcome box on the right. Each rib ends with a rectangular, color-coded box for clear category separation.
The design naturally leads from symptoms to root issues. Smaller branches extend out, giving space for explained causes. This makes it effective for both academic and professional analysis.
Teams benefit from the color scheme, which helps avoid confusion.
Due to its balance between simplicity and structure, it fits the needs of managers, engineers, and students alike.
2. Playful Fish-Shaped Template
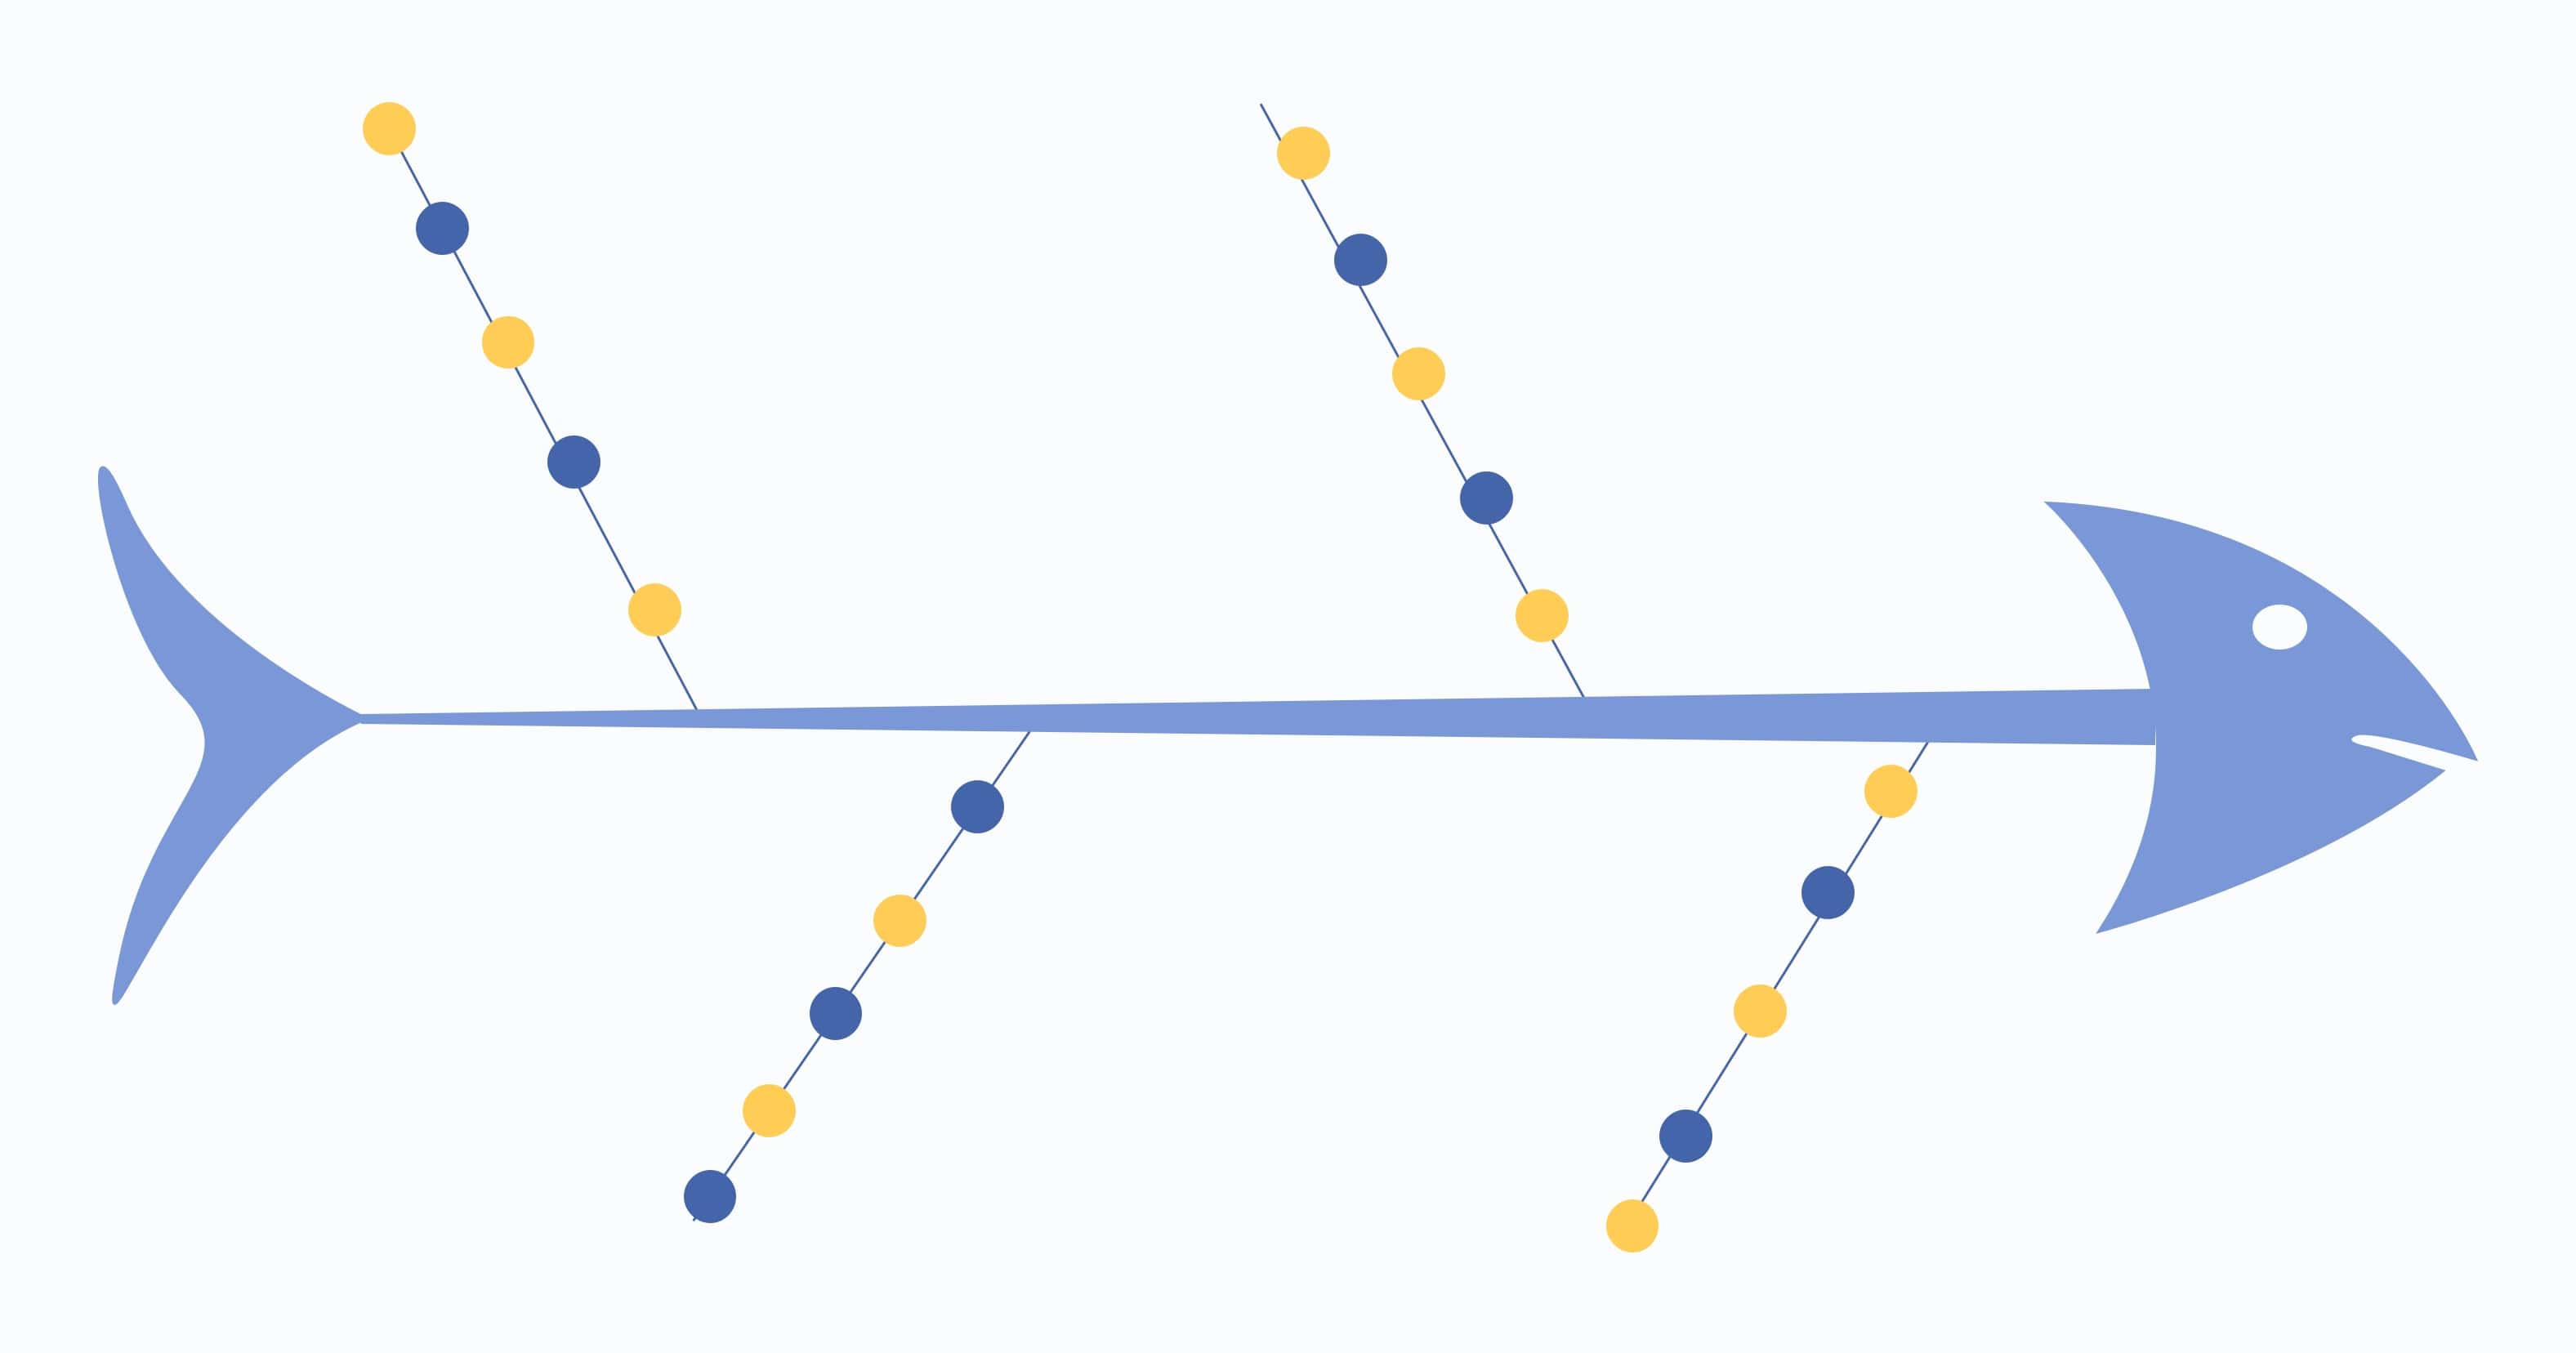
This blank cause-and-effect template takes the actual form of a fish. It has a head, body, and tail, with ribs stretching out diagonally.
Blue and yellow dots highlight where to place ideas. The outcome sits in the head. This setup encourages interaction and keeps the mood light, which helps in brainstorming or teaching.
It removes the heavy tone of formal tools and brings more energy to the process.
People, especially with diverse teams, leading workshops, classes, or creative sessions, will find this template most helpful.
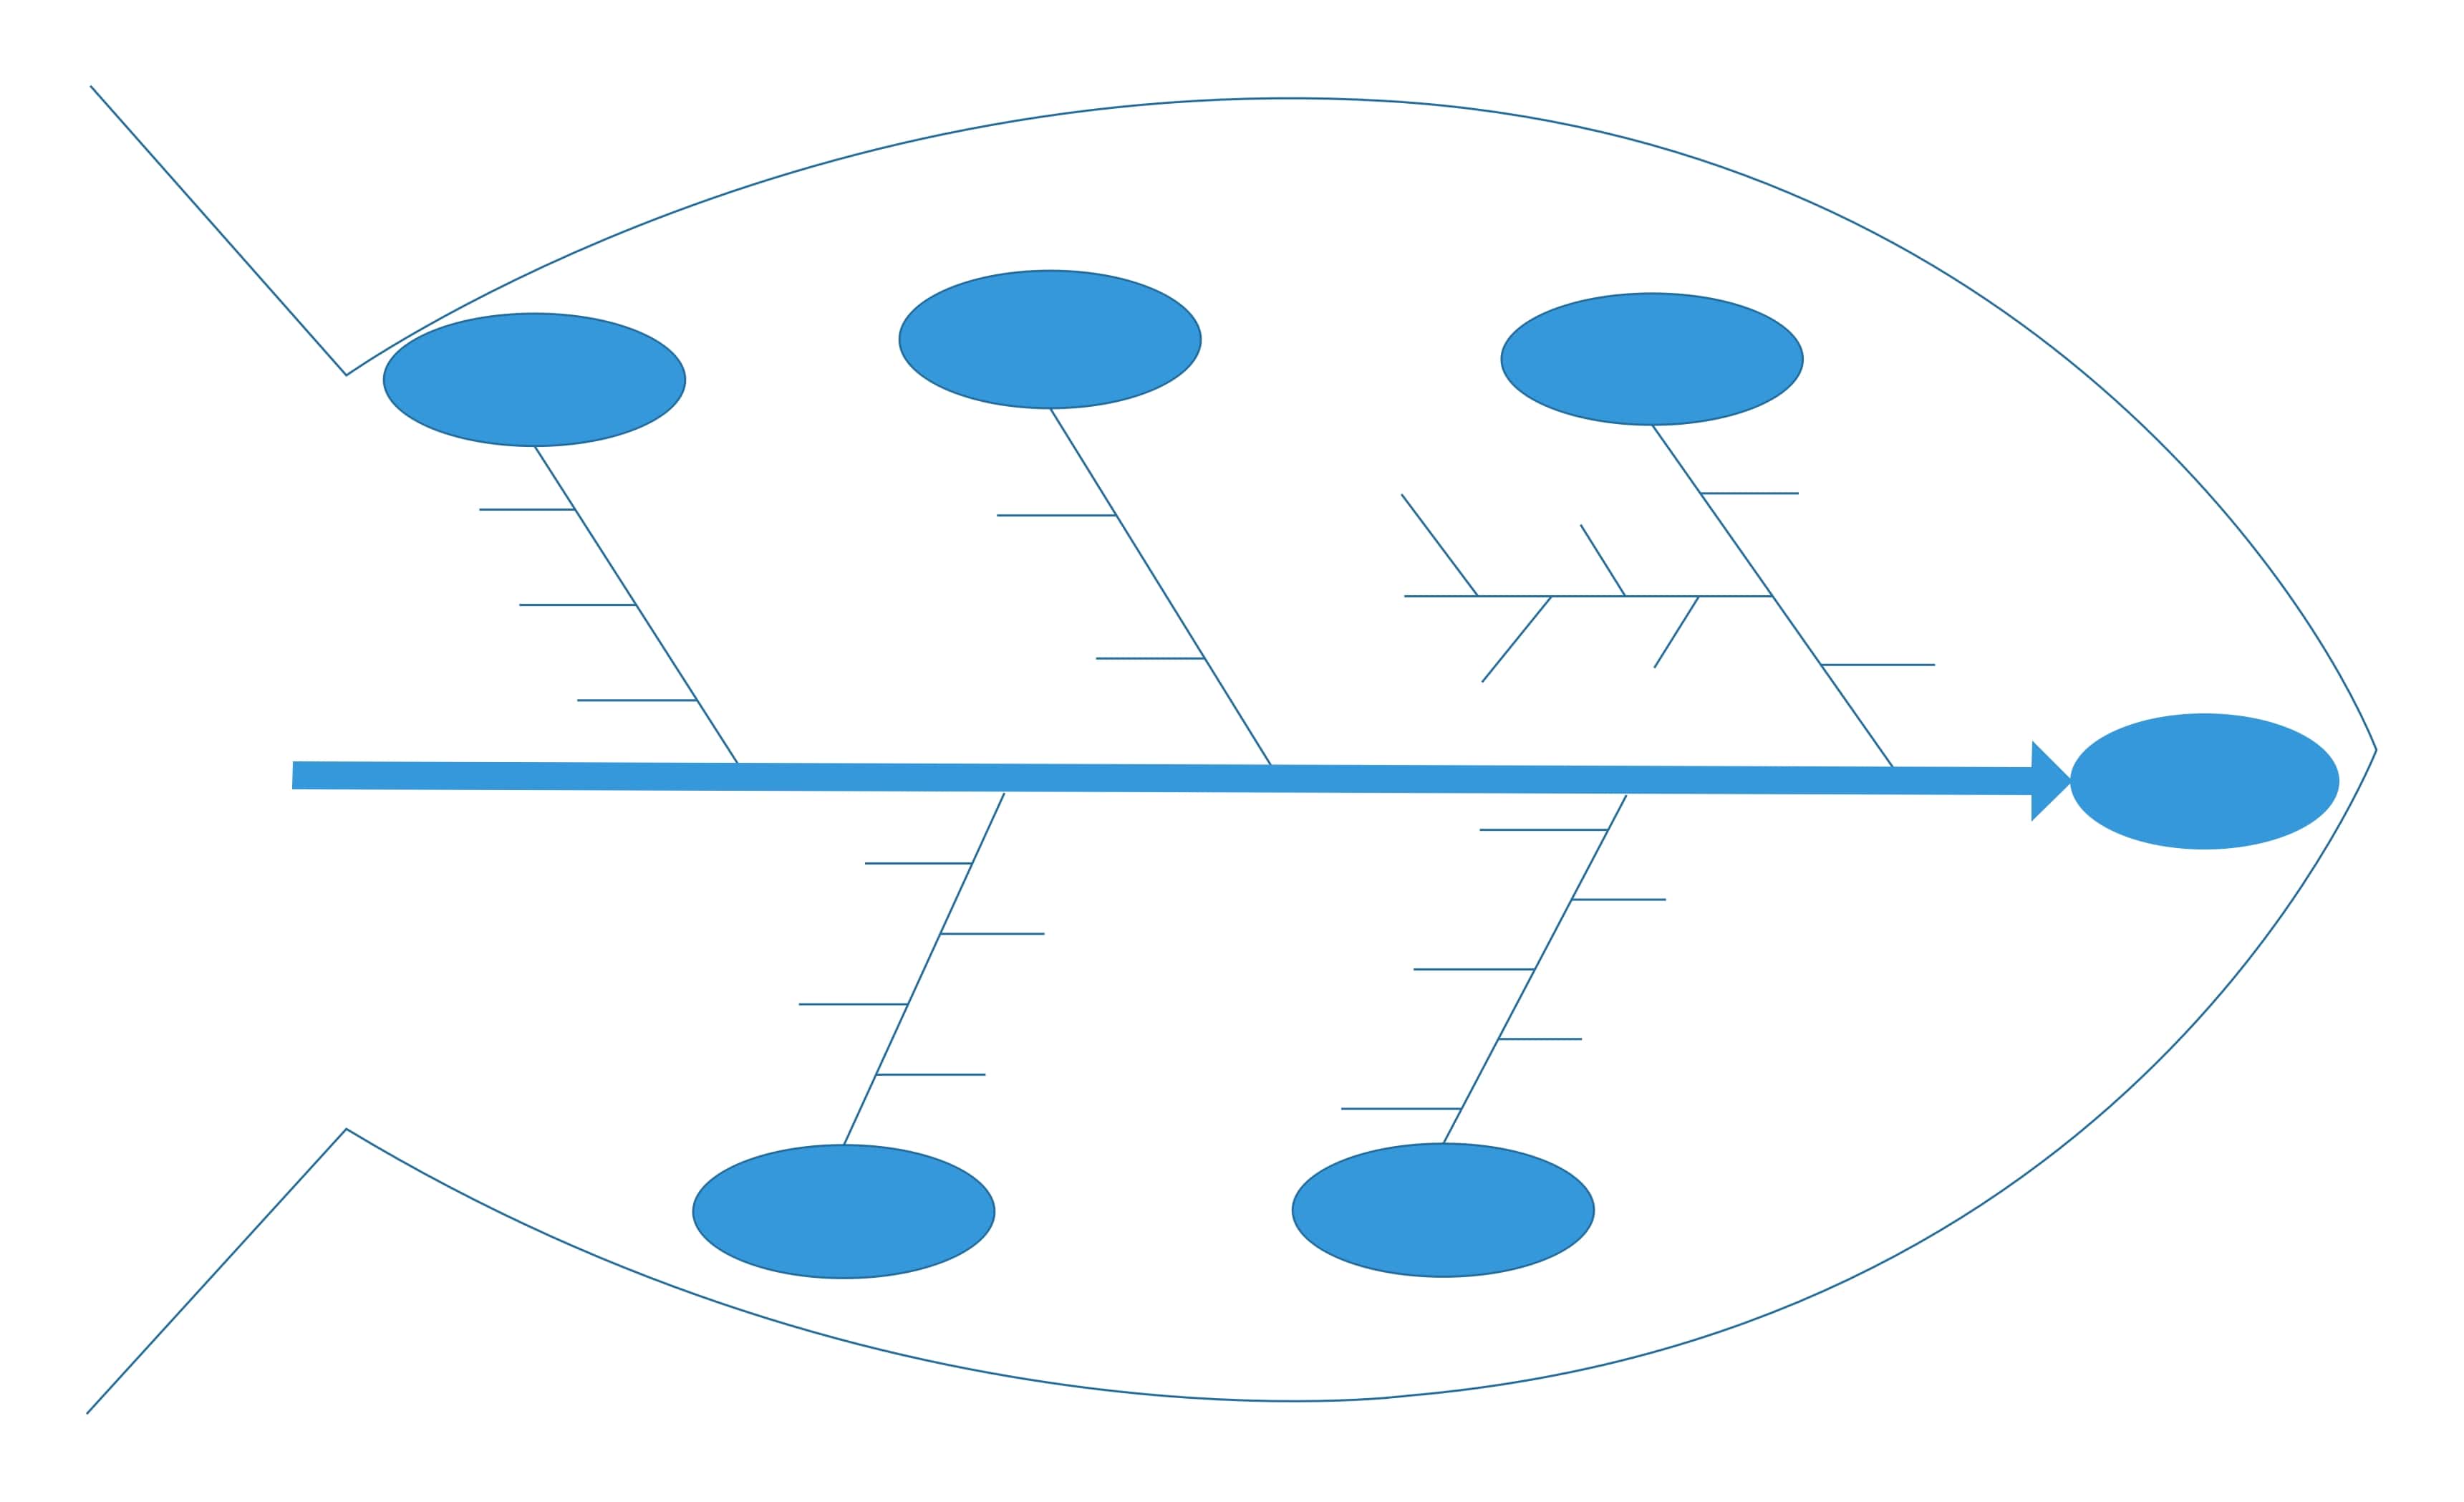
3. Structured Professional Blank Fishbone Diagram
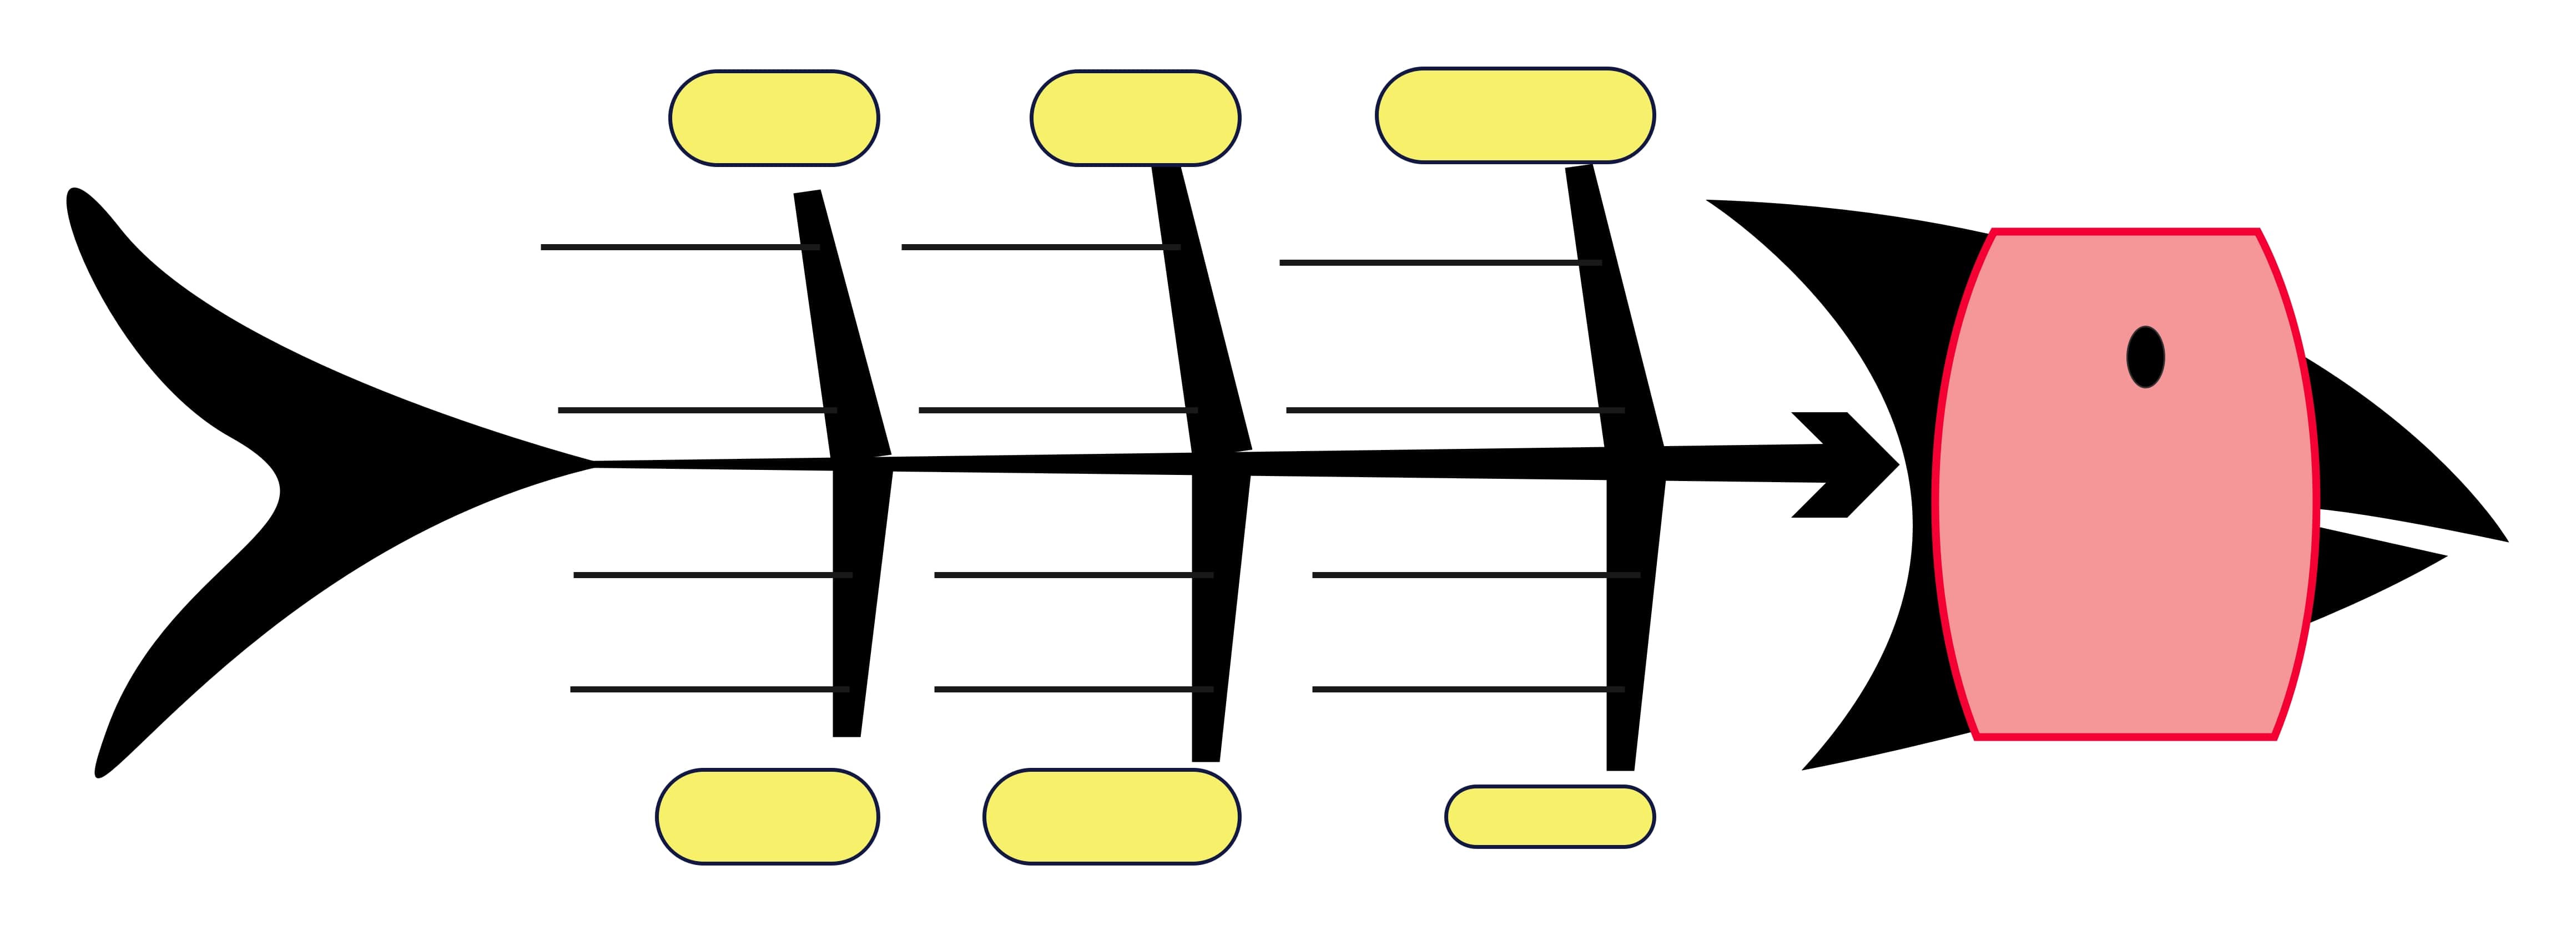
The diagram combines order and a touch of flair. At the center is a red-bordered head linked to strong ribs.
Each rib carries yellow-bordered oval type shapes for categories, while smaller lines capture sub-causes.
This structure highlights both significant factors and details in one view. Its clean balance works for team analysis, research, and quality projects where clarity matters most.
4. Classic Six-Rib Professional Ishikawa Diagram Template
The template focuses on order. Its central spine runs to an effect box on the right. Six diagonal ribs connect to blue boxes, while horizontal lines underneath provide space for sub-causes.
This setup is ideal for structured analysis. It lets teams manage several categories at once without crowding the diagram. Every factor, even minor ones, gets documented.
Engineers, planners, and business groups use it most often for quality and planning sessions.
5. Modern Arrow-Style Fishbone Template
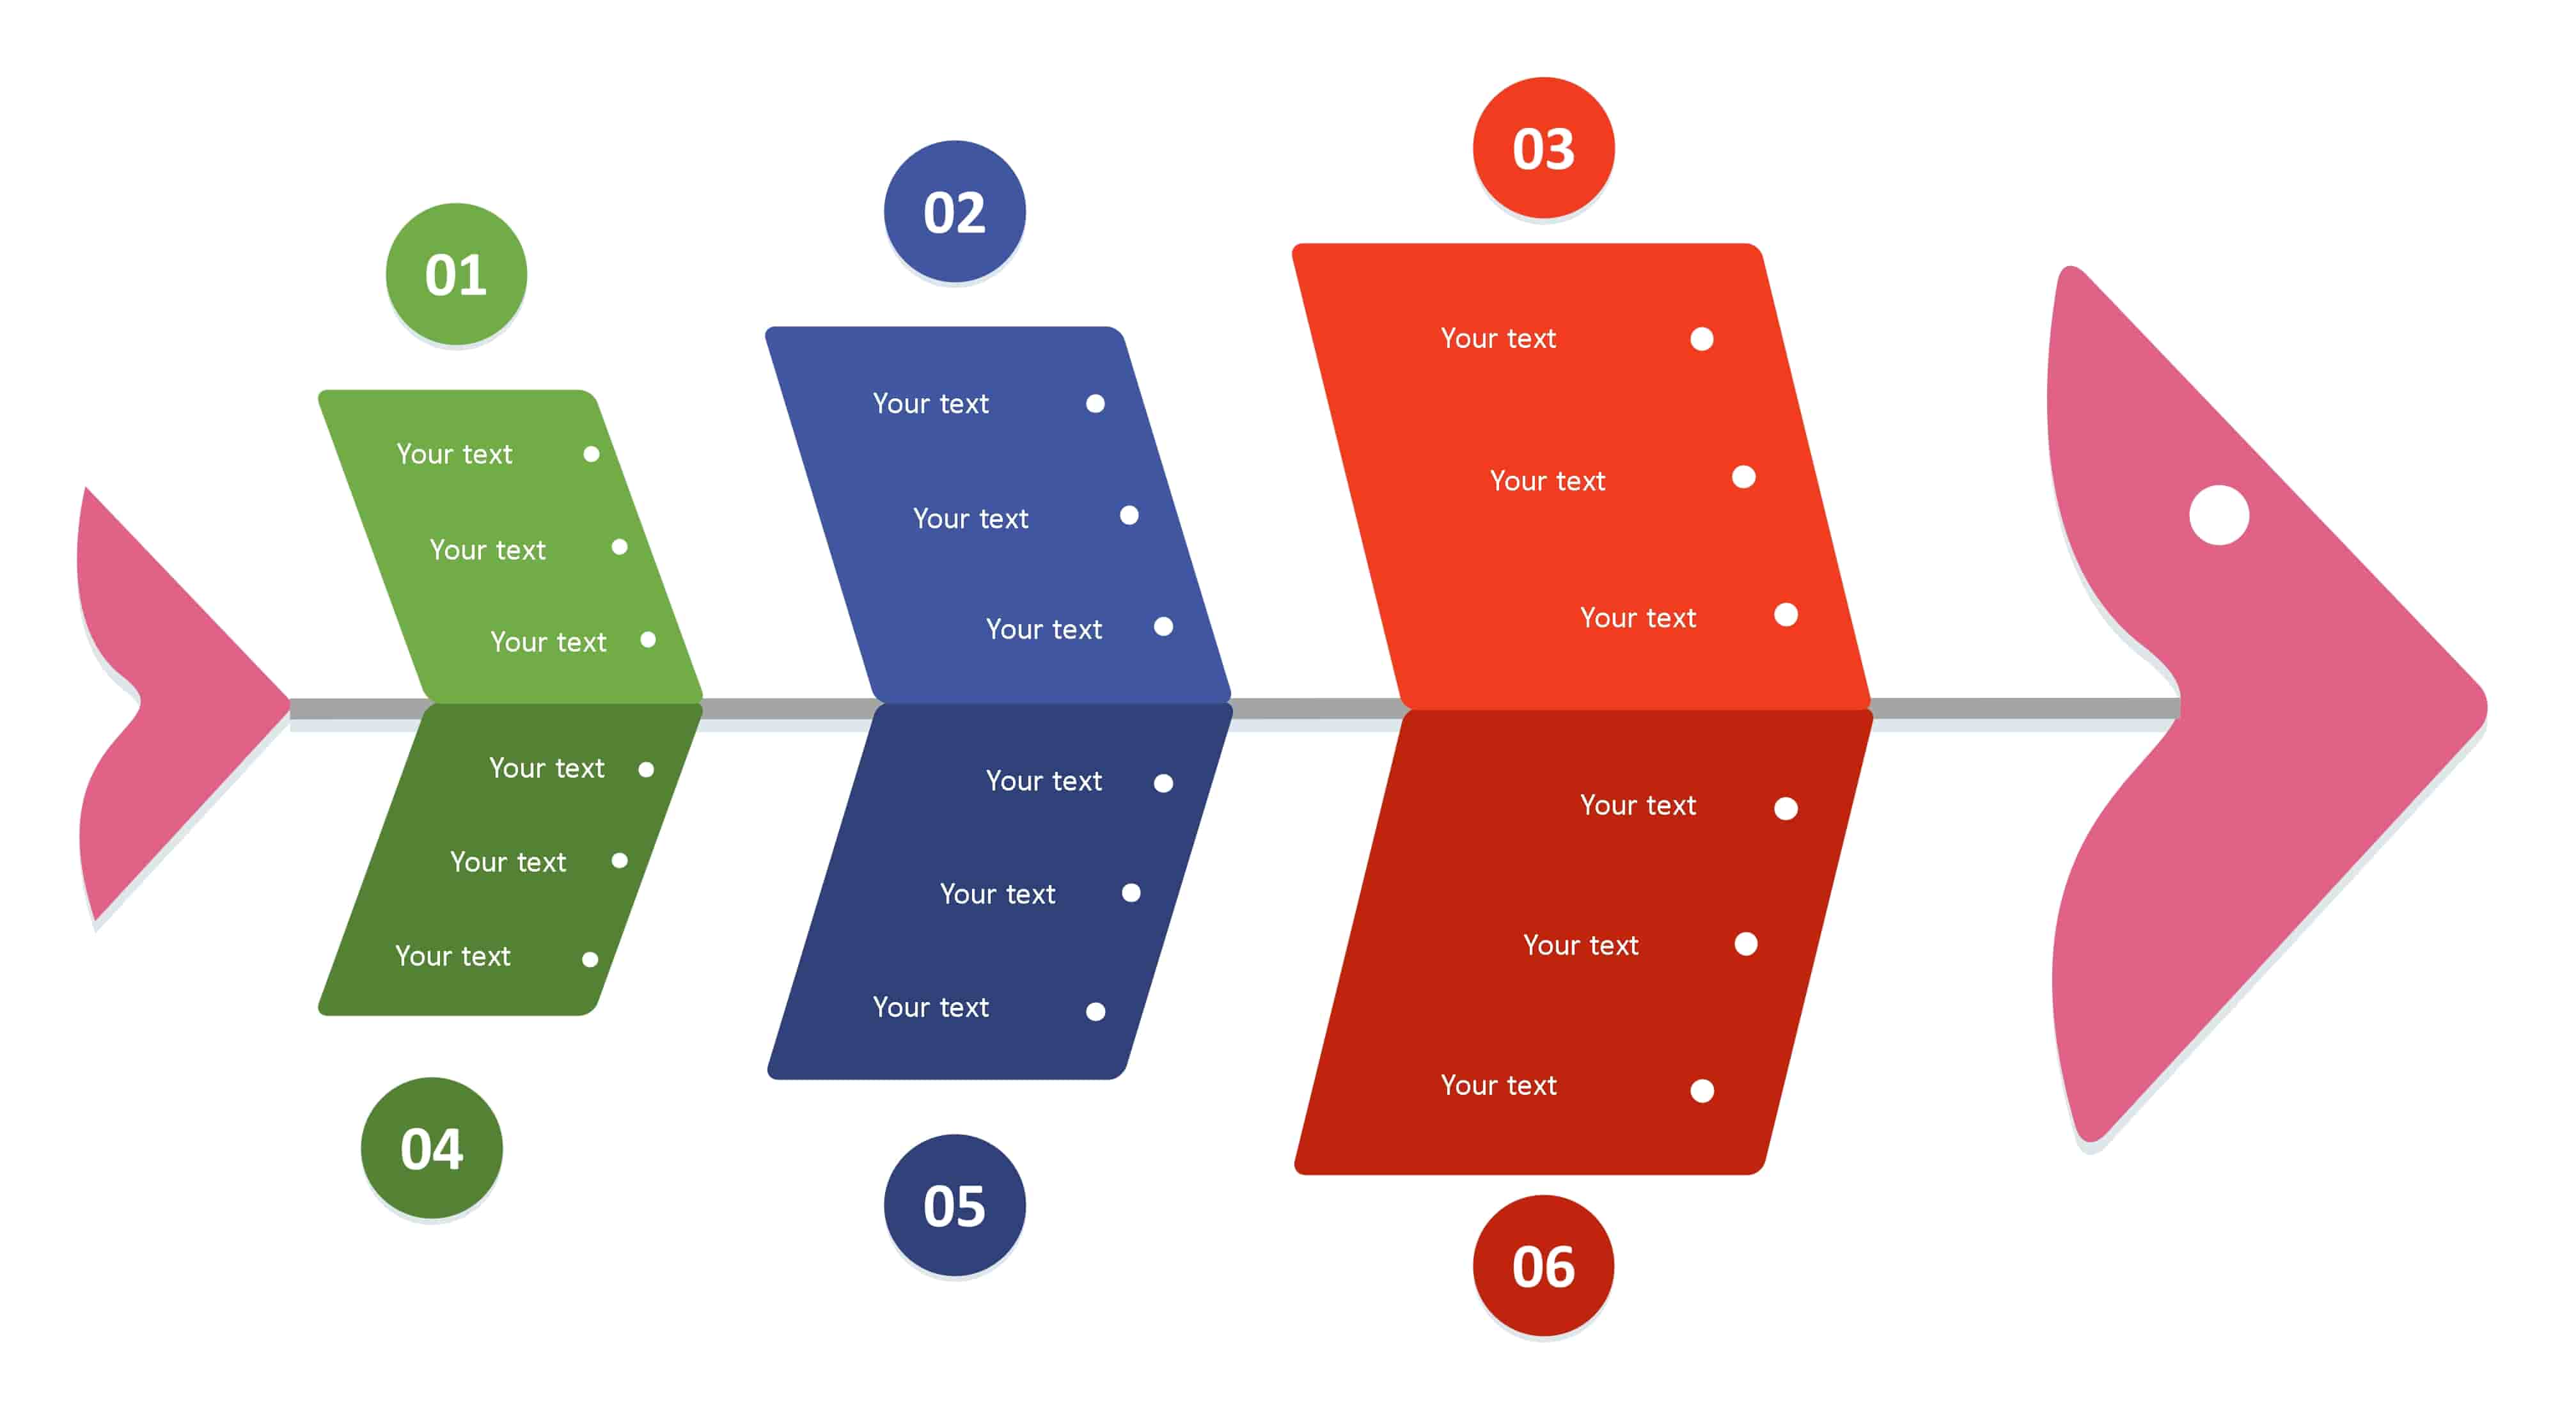
This Ishikawa diagram format takes a different approach. The outcome can be displayed in a bold arrow box on the right, while the causes line up on the left inside six color-coded, numbered blocks.
The design resembles an infographic, which makes complex analysis easy to digest. It’s particularly effective for reports and stakeholder presentations.
The numbers guide the audience through the cause-and-effect path, and the colors hold attention.
Consultants, presenters, and business teams can rely on this style to share findings clearly.
6. Minimalist Ghost-Fish Template
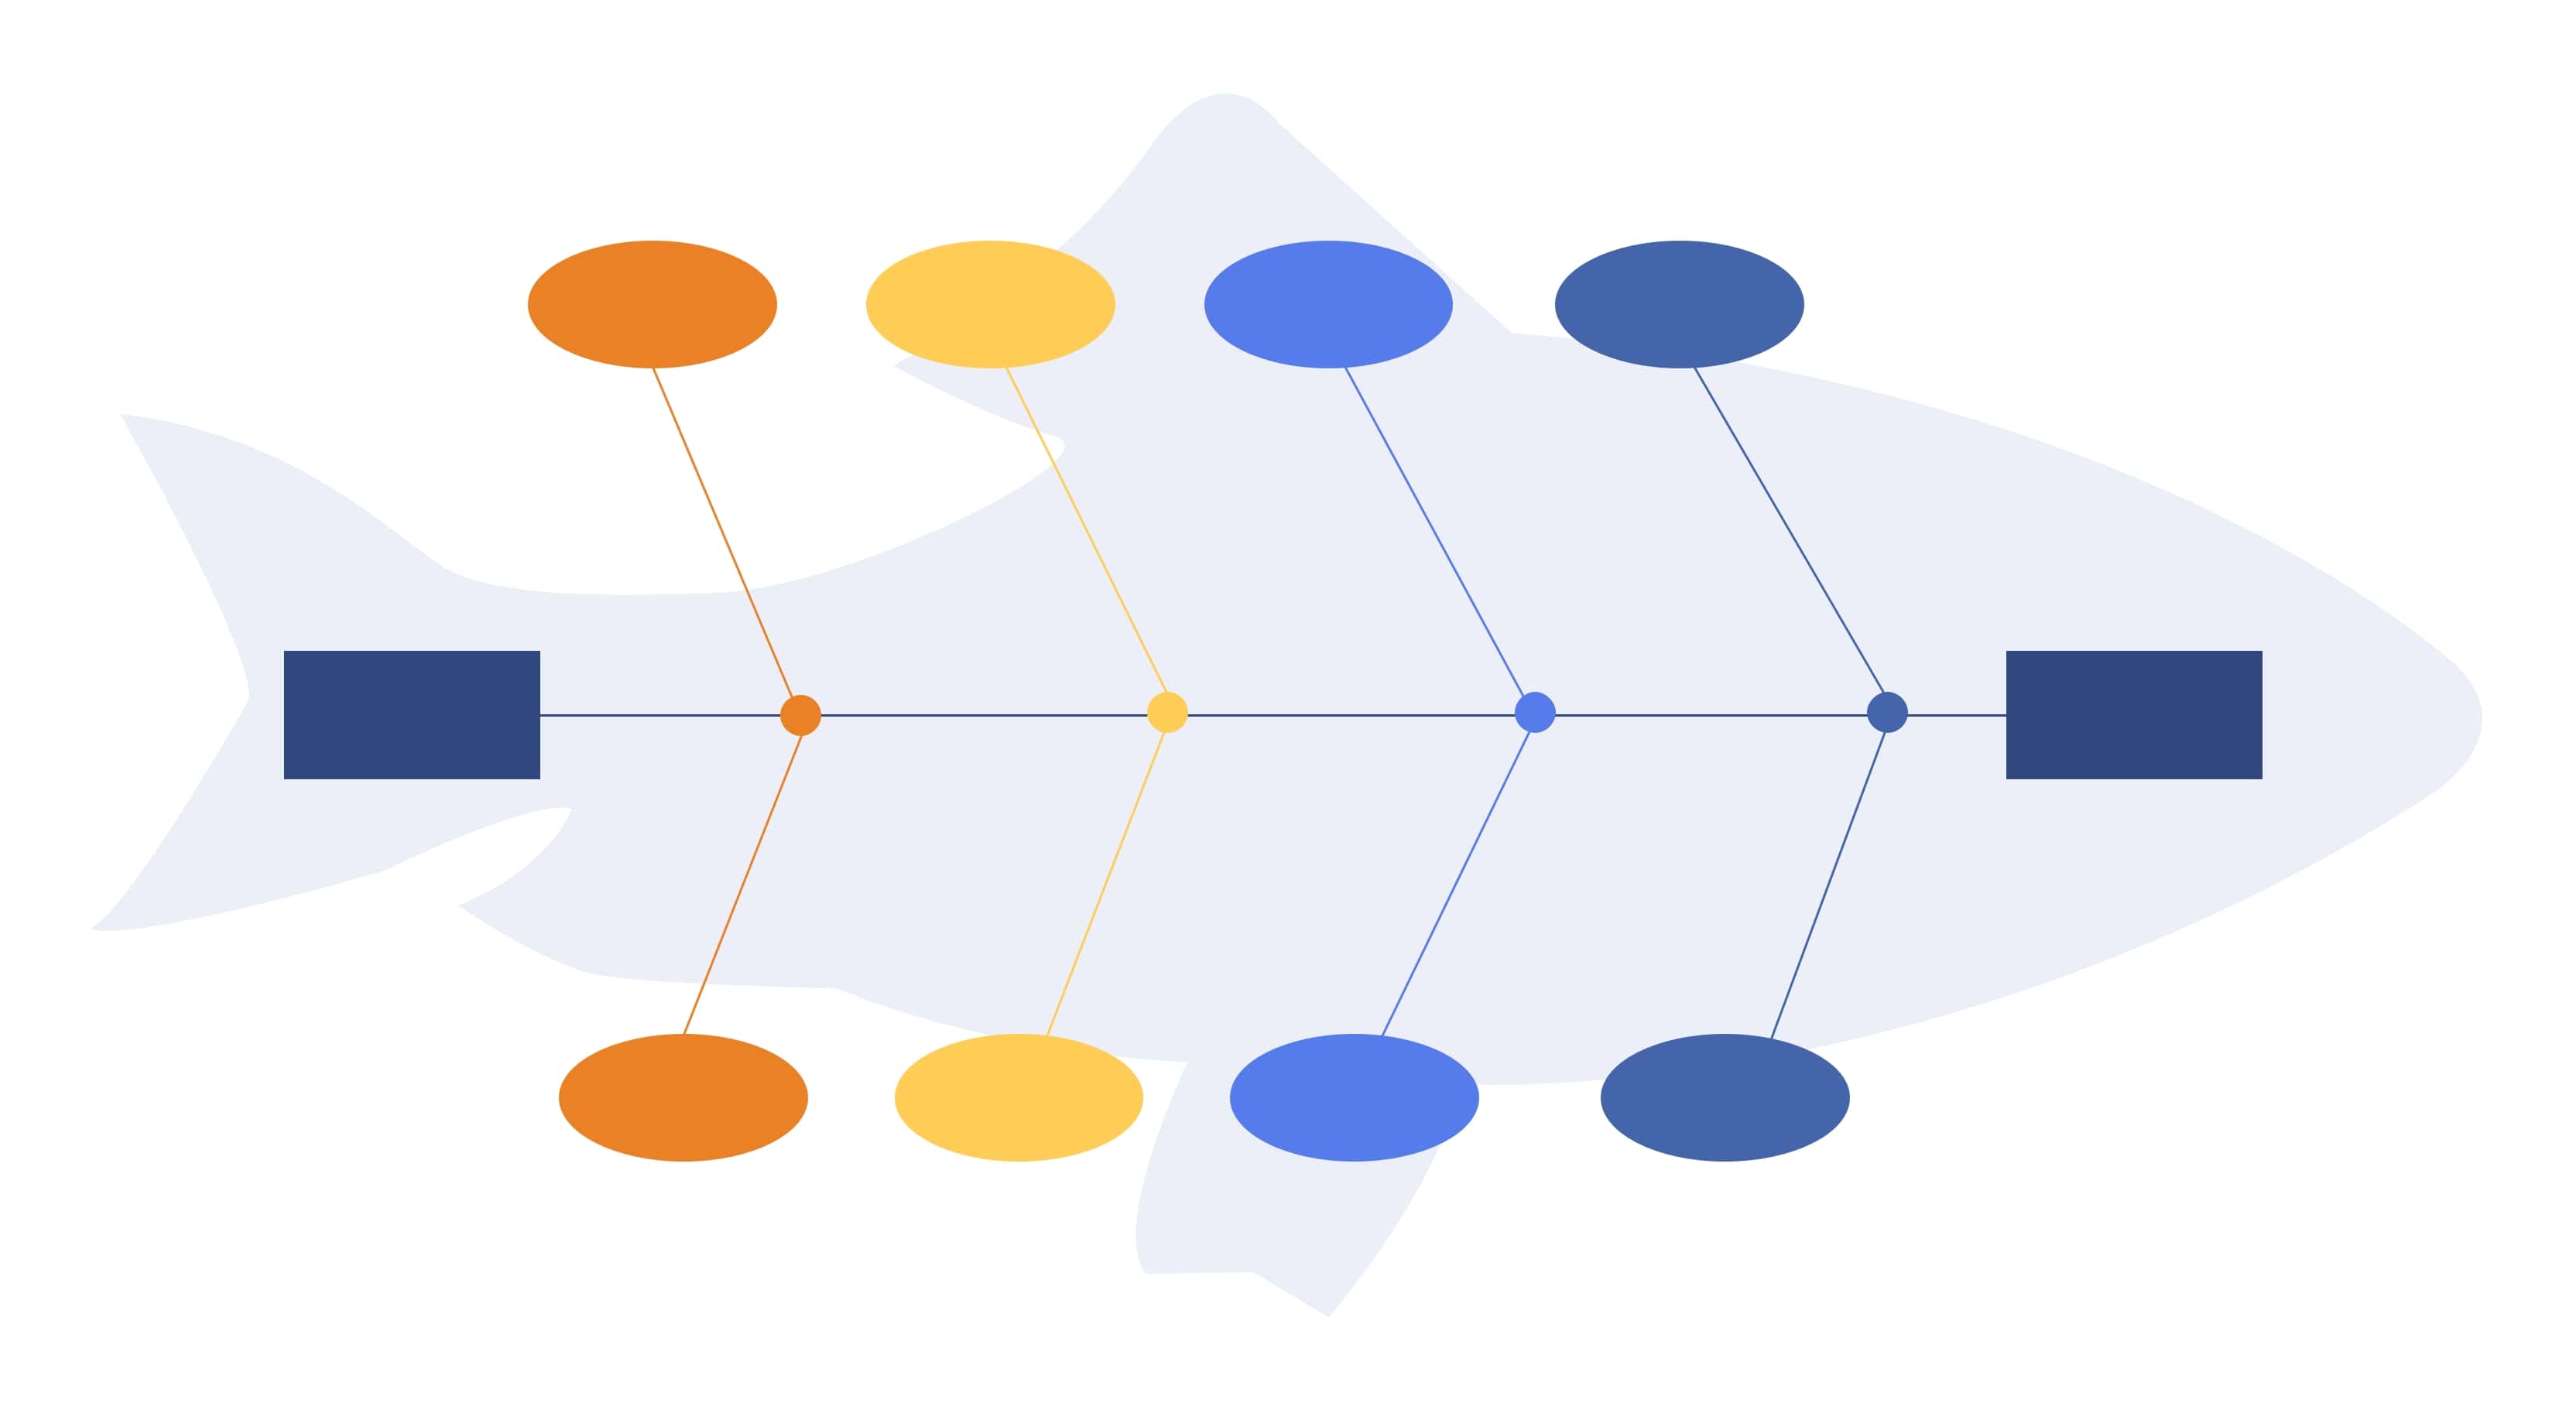
The design starts with a translucent fish figure in the background. A spine runs down the center, with colorful oval branches extending on both sides.
The process begins and ends in boxes placed at the head and tail. This style isn’t about recording everything. Instead, it narrows the focus to the categories that matter most.
It shines in settings like executive briefings, team strategy meetings, or student projects where clean visuals speak louder than crowded charts.
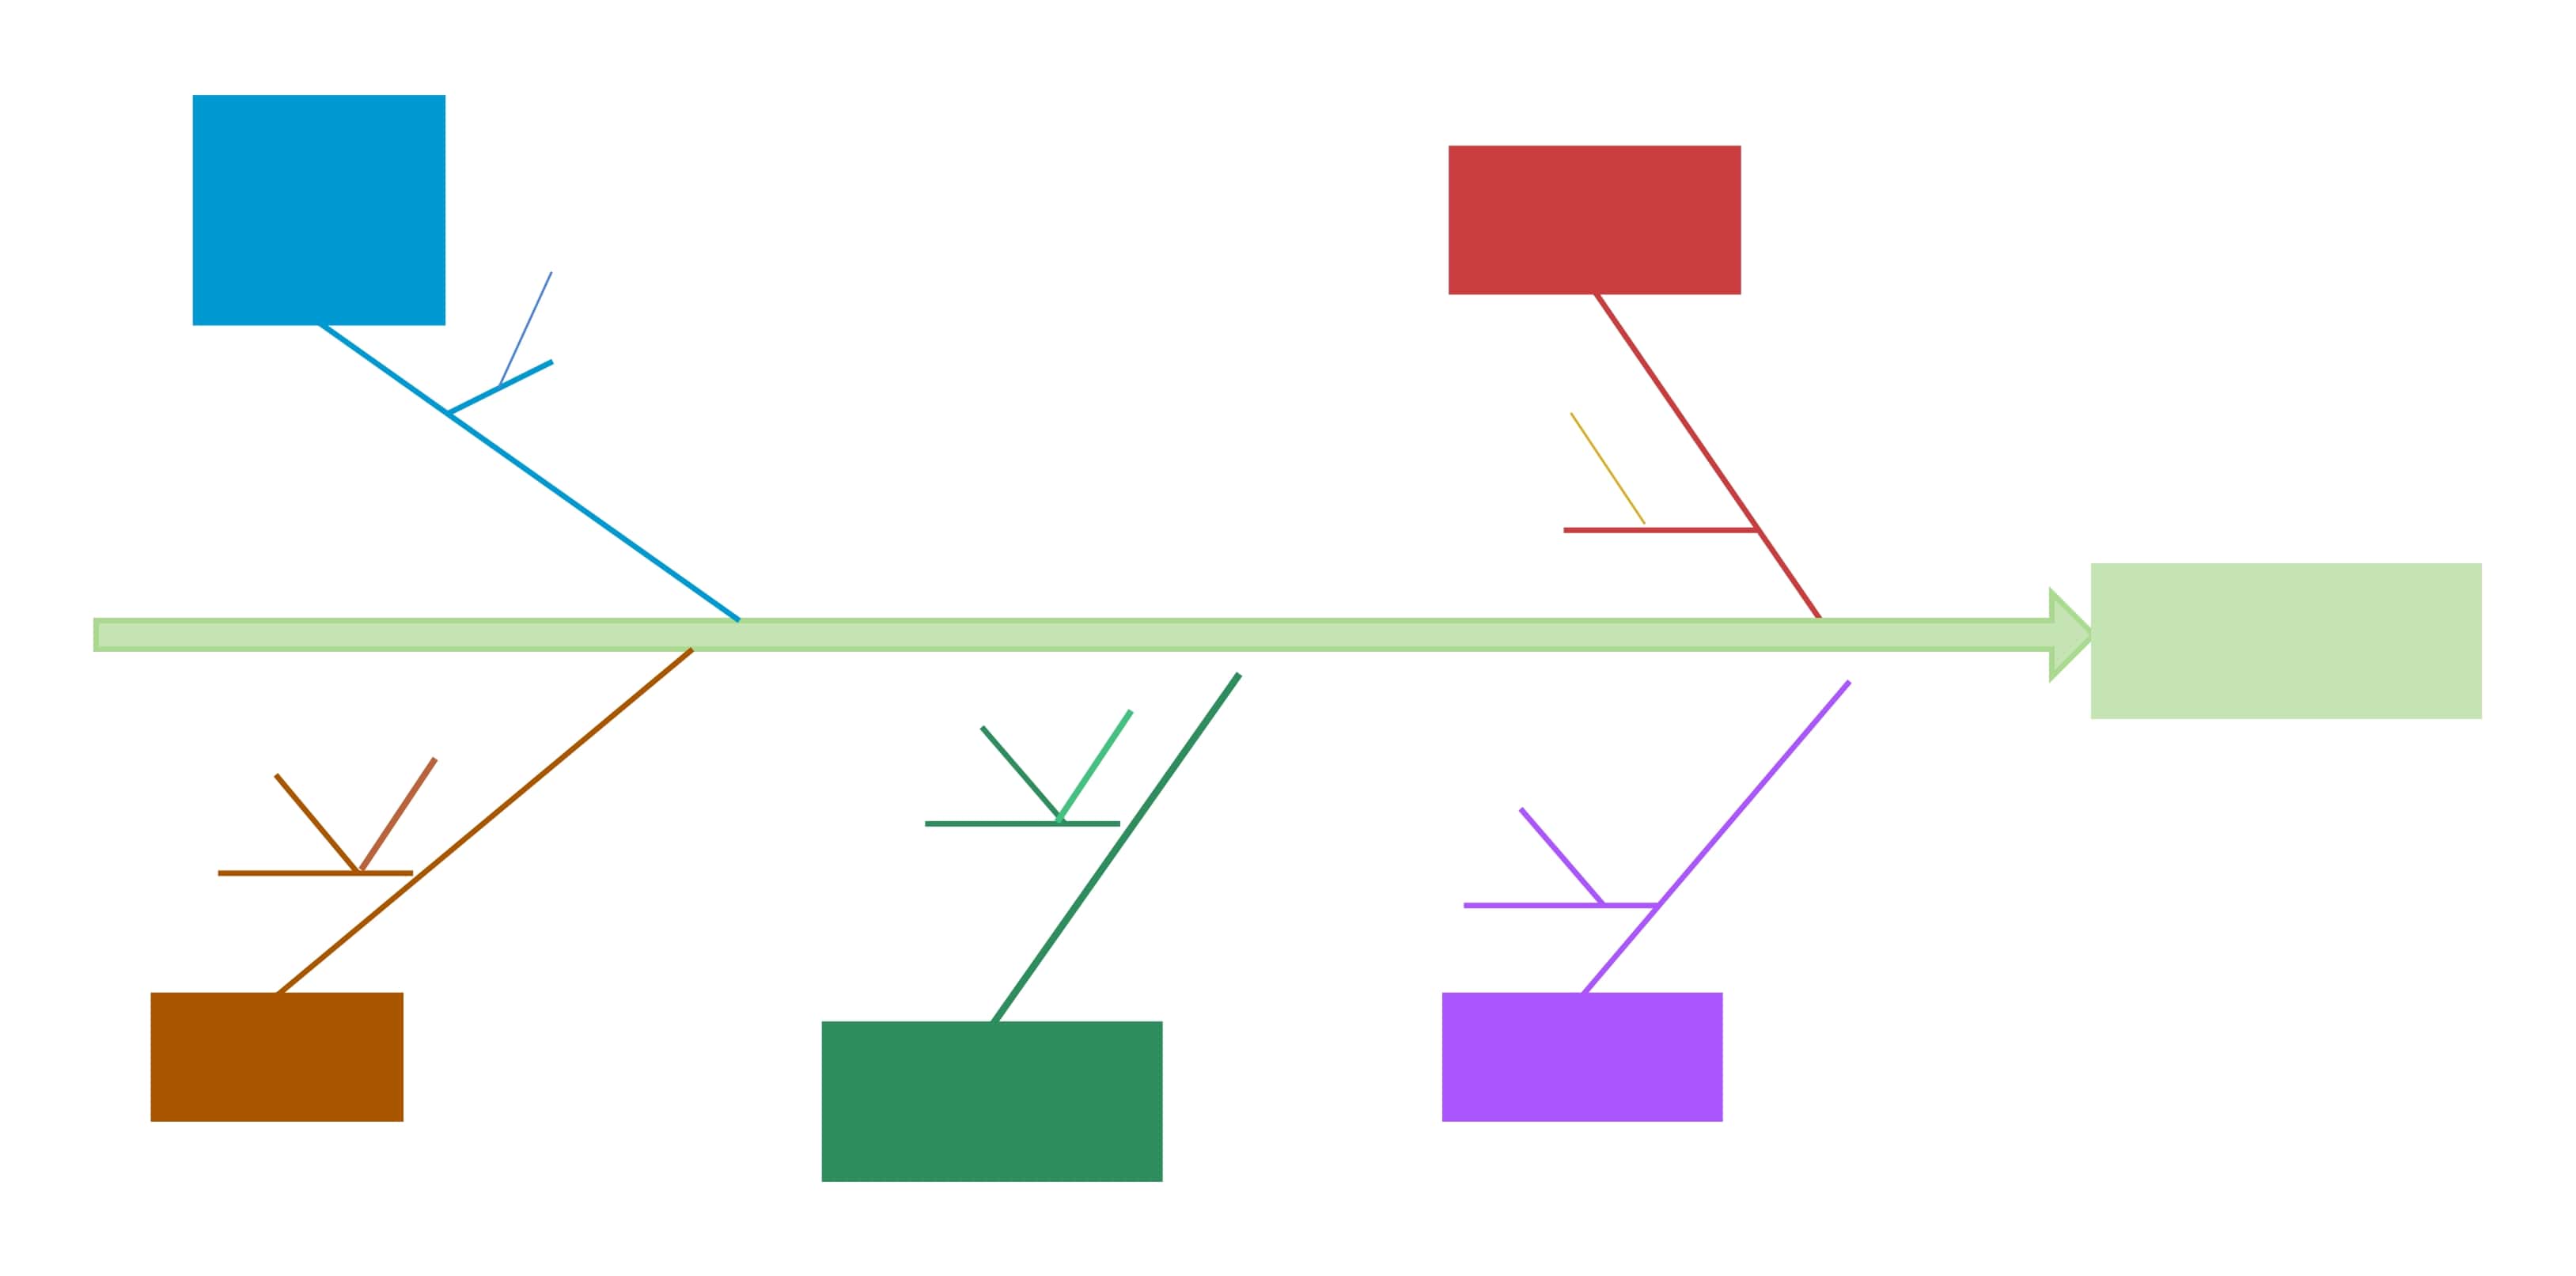
7. Detailed Four-Rib Cause-and-Effect Diagram Template
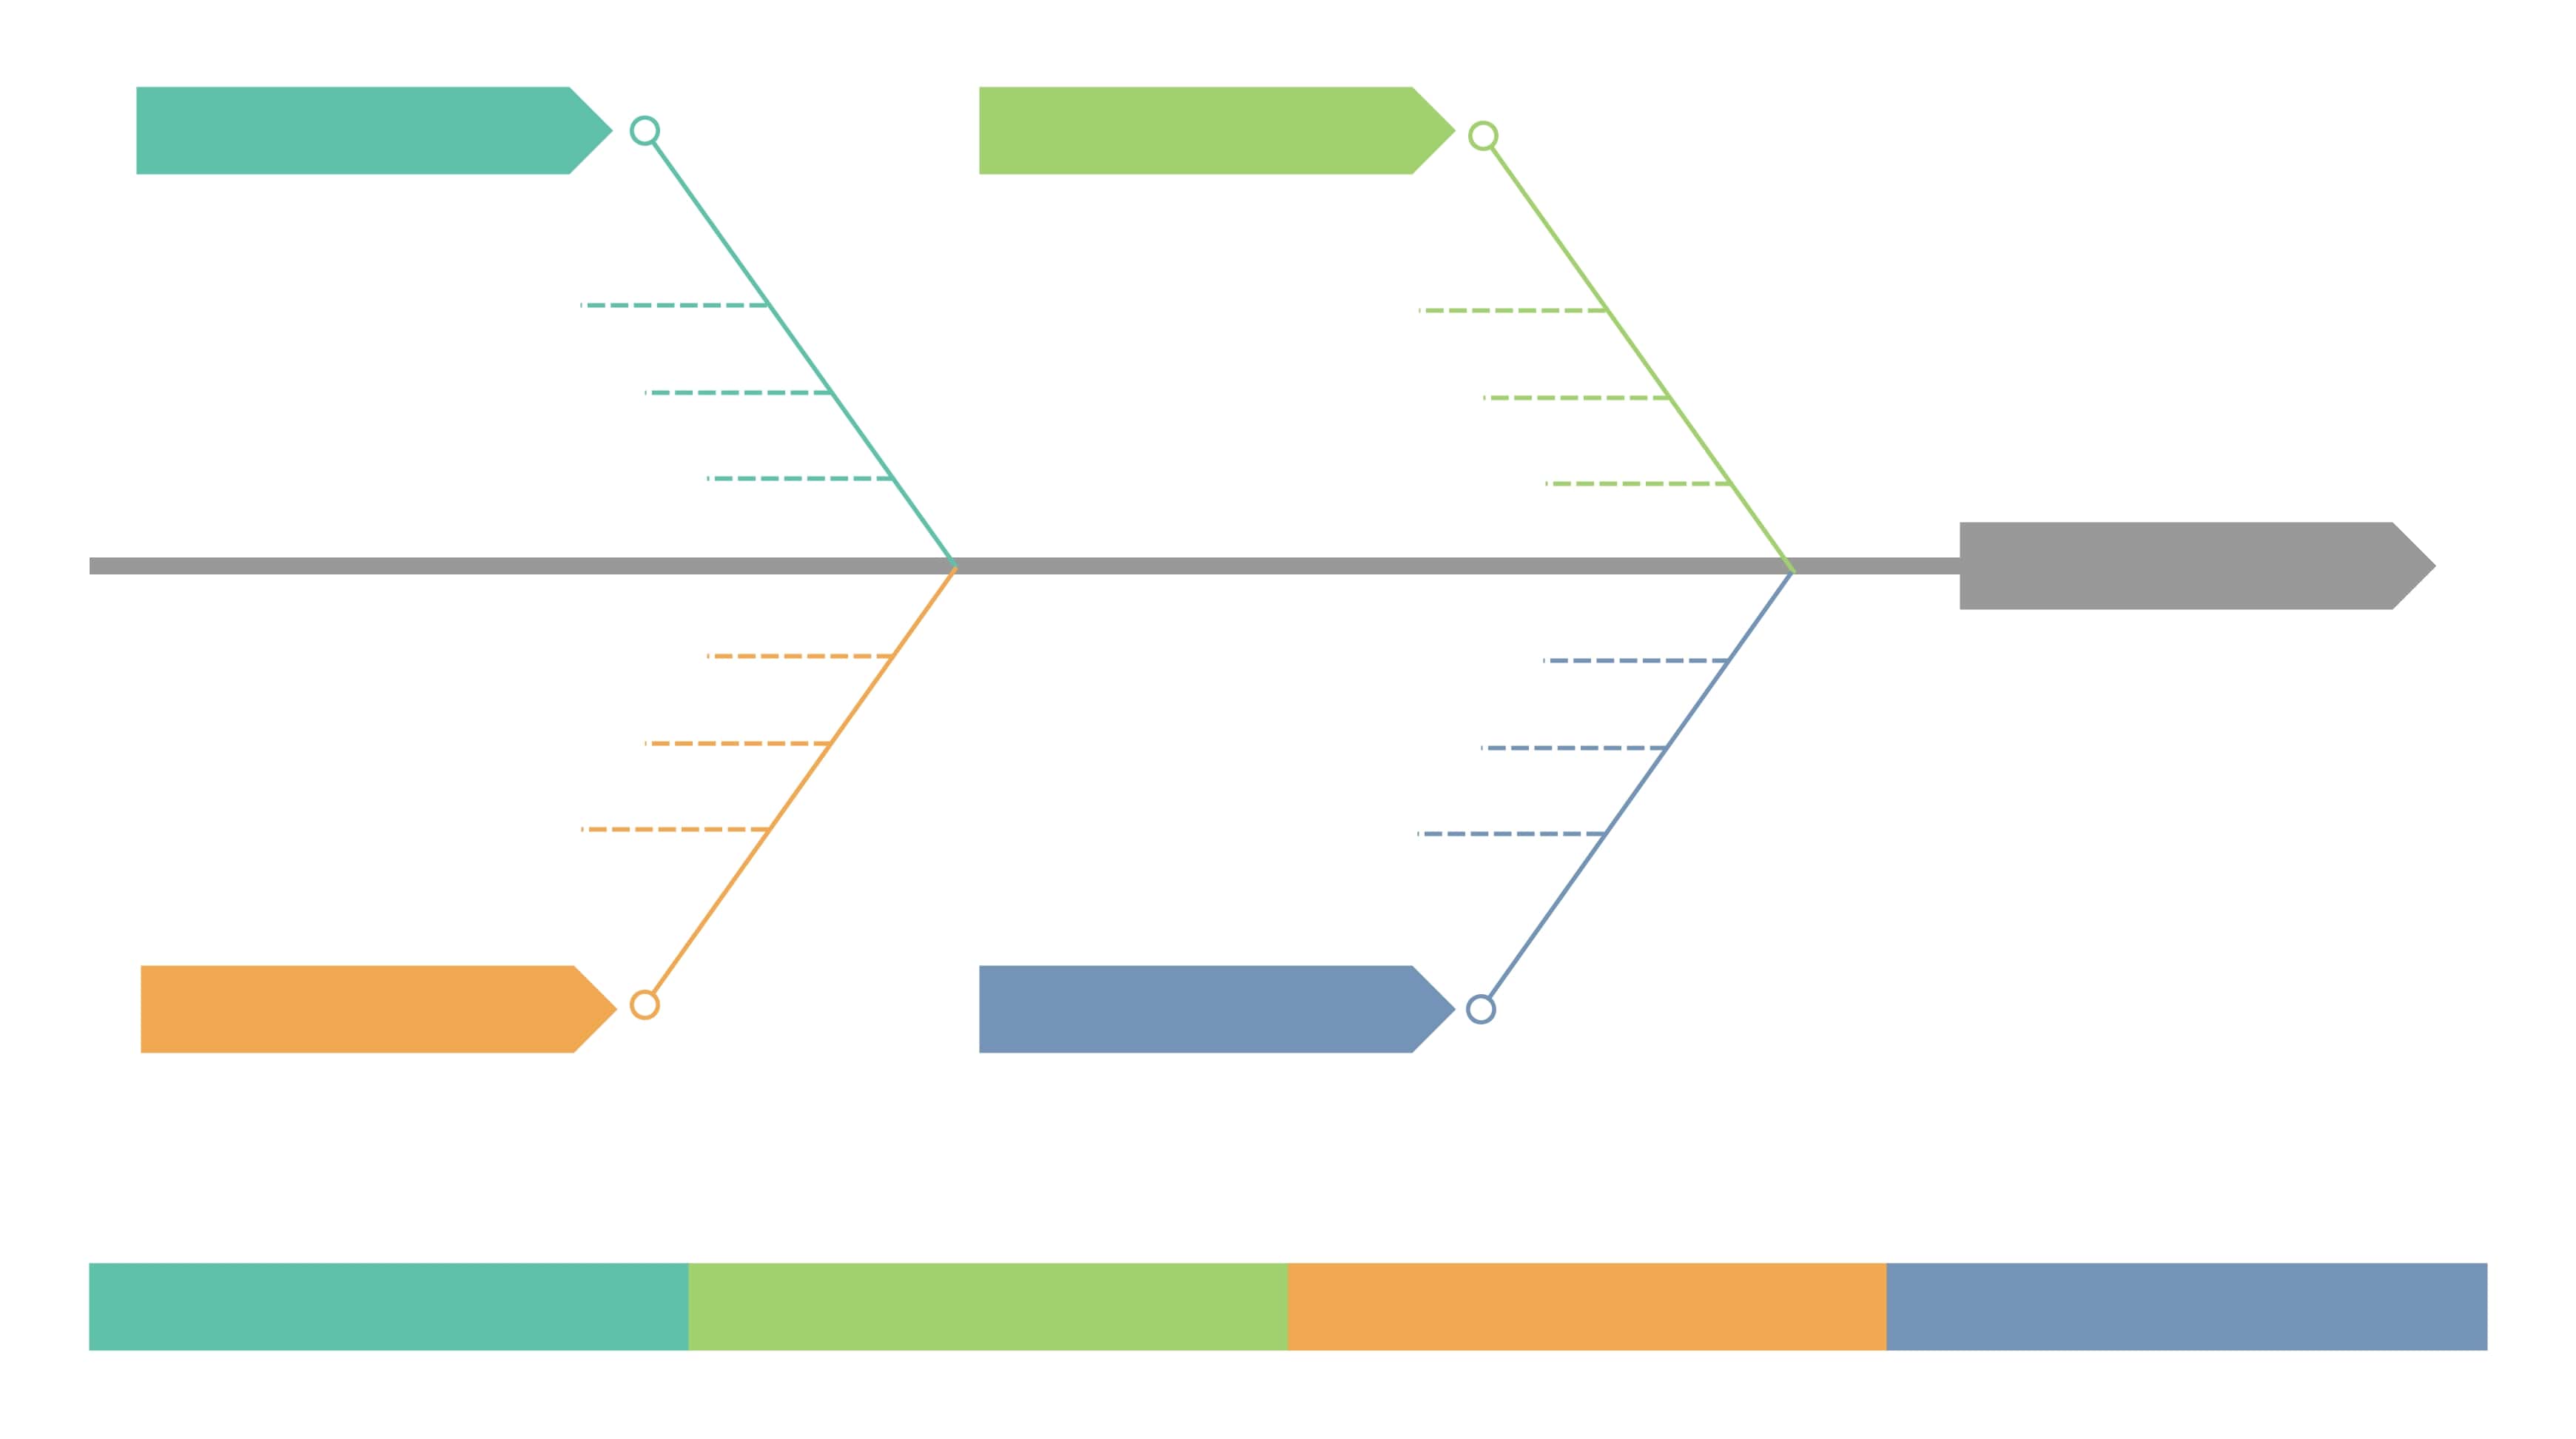
Here, detail takes priority, emphasizing depth and order. Four angled ribs extend from the central spine, each ending with a colorful rectangle corresponding to a category. From every rib, smaller horizontal branches capture sub-causes in detail.
The structured design helps track many factors simultaneously and keeps complex analysis manageable. Its clear, balanced form makes teamwork easier and ensures no cause is overlooked.
It works best in various fields, including manufacturing, process management, or research, where accuracy matters most.
8. Simple Five-Rib Fishbone Template
The **blank fishbone diagram template** balances clarity with ease of use. A horizontal backbone connects to an oval effect box on the right. Five ribs stem from it, three on top, two below, each pointing to a blue oval. Sub-causes can be added on small horizontal lines.
Its simple layout makes it practical in team meetings, classrooms, or any session where time is tight. The structure helps participants stay focused on cause-and-effect links.
It’s best for small teams, students, and leaders who value organized, time-efficient problem-solving.
Explore More Fishbone Diagram Templates in EdrawMax
EdrawMax Overview
EdrawMax, a comprehensive diagramming tool, helps you design over 210 diagram types.
You can make anything from mind maps and flowcharts to fishbone diagrams and complex technical charts with its massive symbol set of 26k+ and advanced but simple editing tools.
It works on Windows, macOS, Linux, and in browsers, so your diagrams stay accessible wherever you work.
EdrawMax Templates Community
With over 20,000 ready templates, there's a shared template library where users post their diagrams. This community collection offers thousands of editable designs.
Searching for fishbone diagrams surfaces ready layouts for tasks like planning or quality management. Each one can be customized to suit your case, so you don't have to build from scratch.
Using a Fishbone Diagram Template in EdrawMax
Fishbone diagrams in EdrawMax are quick to set up and easy to manage. Here’s a step-by-step approach:
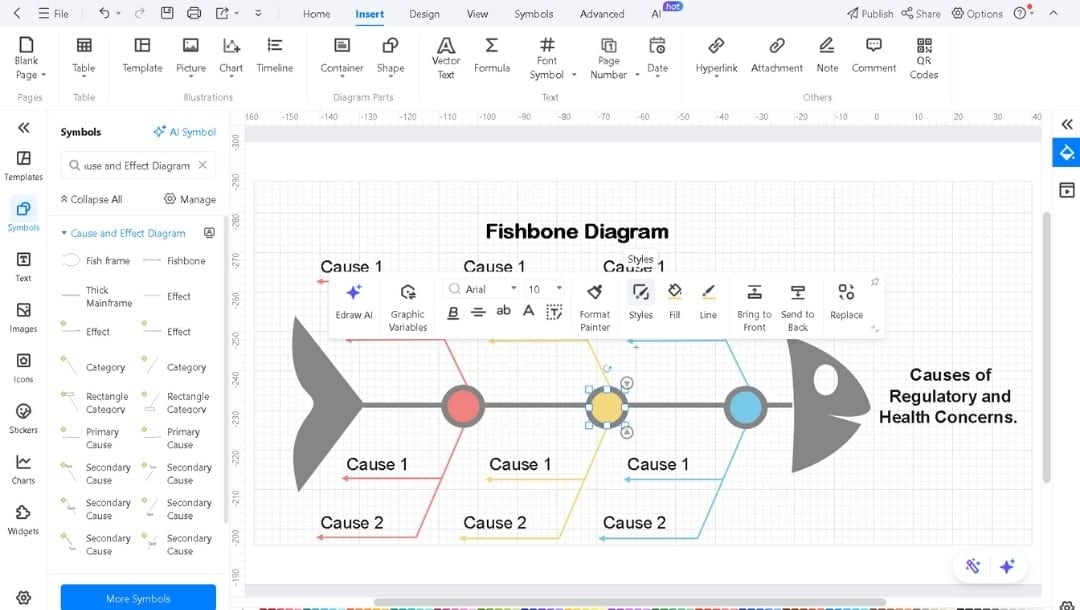
Step 1: Pick a Template
Go to the Templates section in EdrawMax. Search for fishbone or Ishikawa in the search bar.
Pick a suitable template, either blank or pre-structured, that fits your requirements.
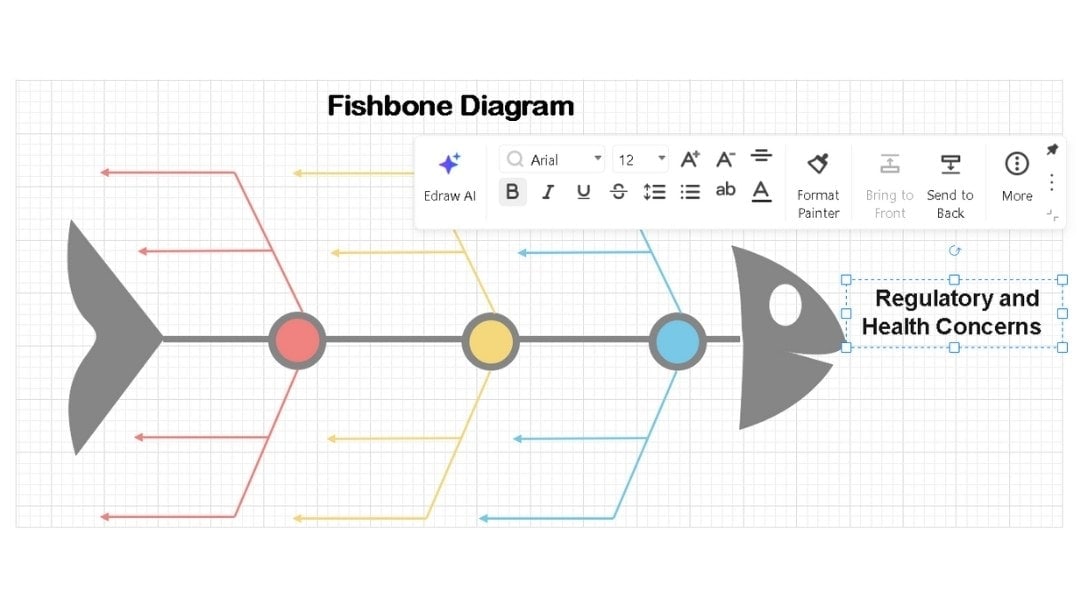
Step 2: Edit the Diagram
Double-click anywhere to insert the title of your Ishikawa diagram.
Use the simple drag and drop feature to move anything where you want.
Select your text and modify its font, color, style, and more from the pop-up menu.
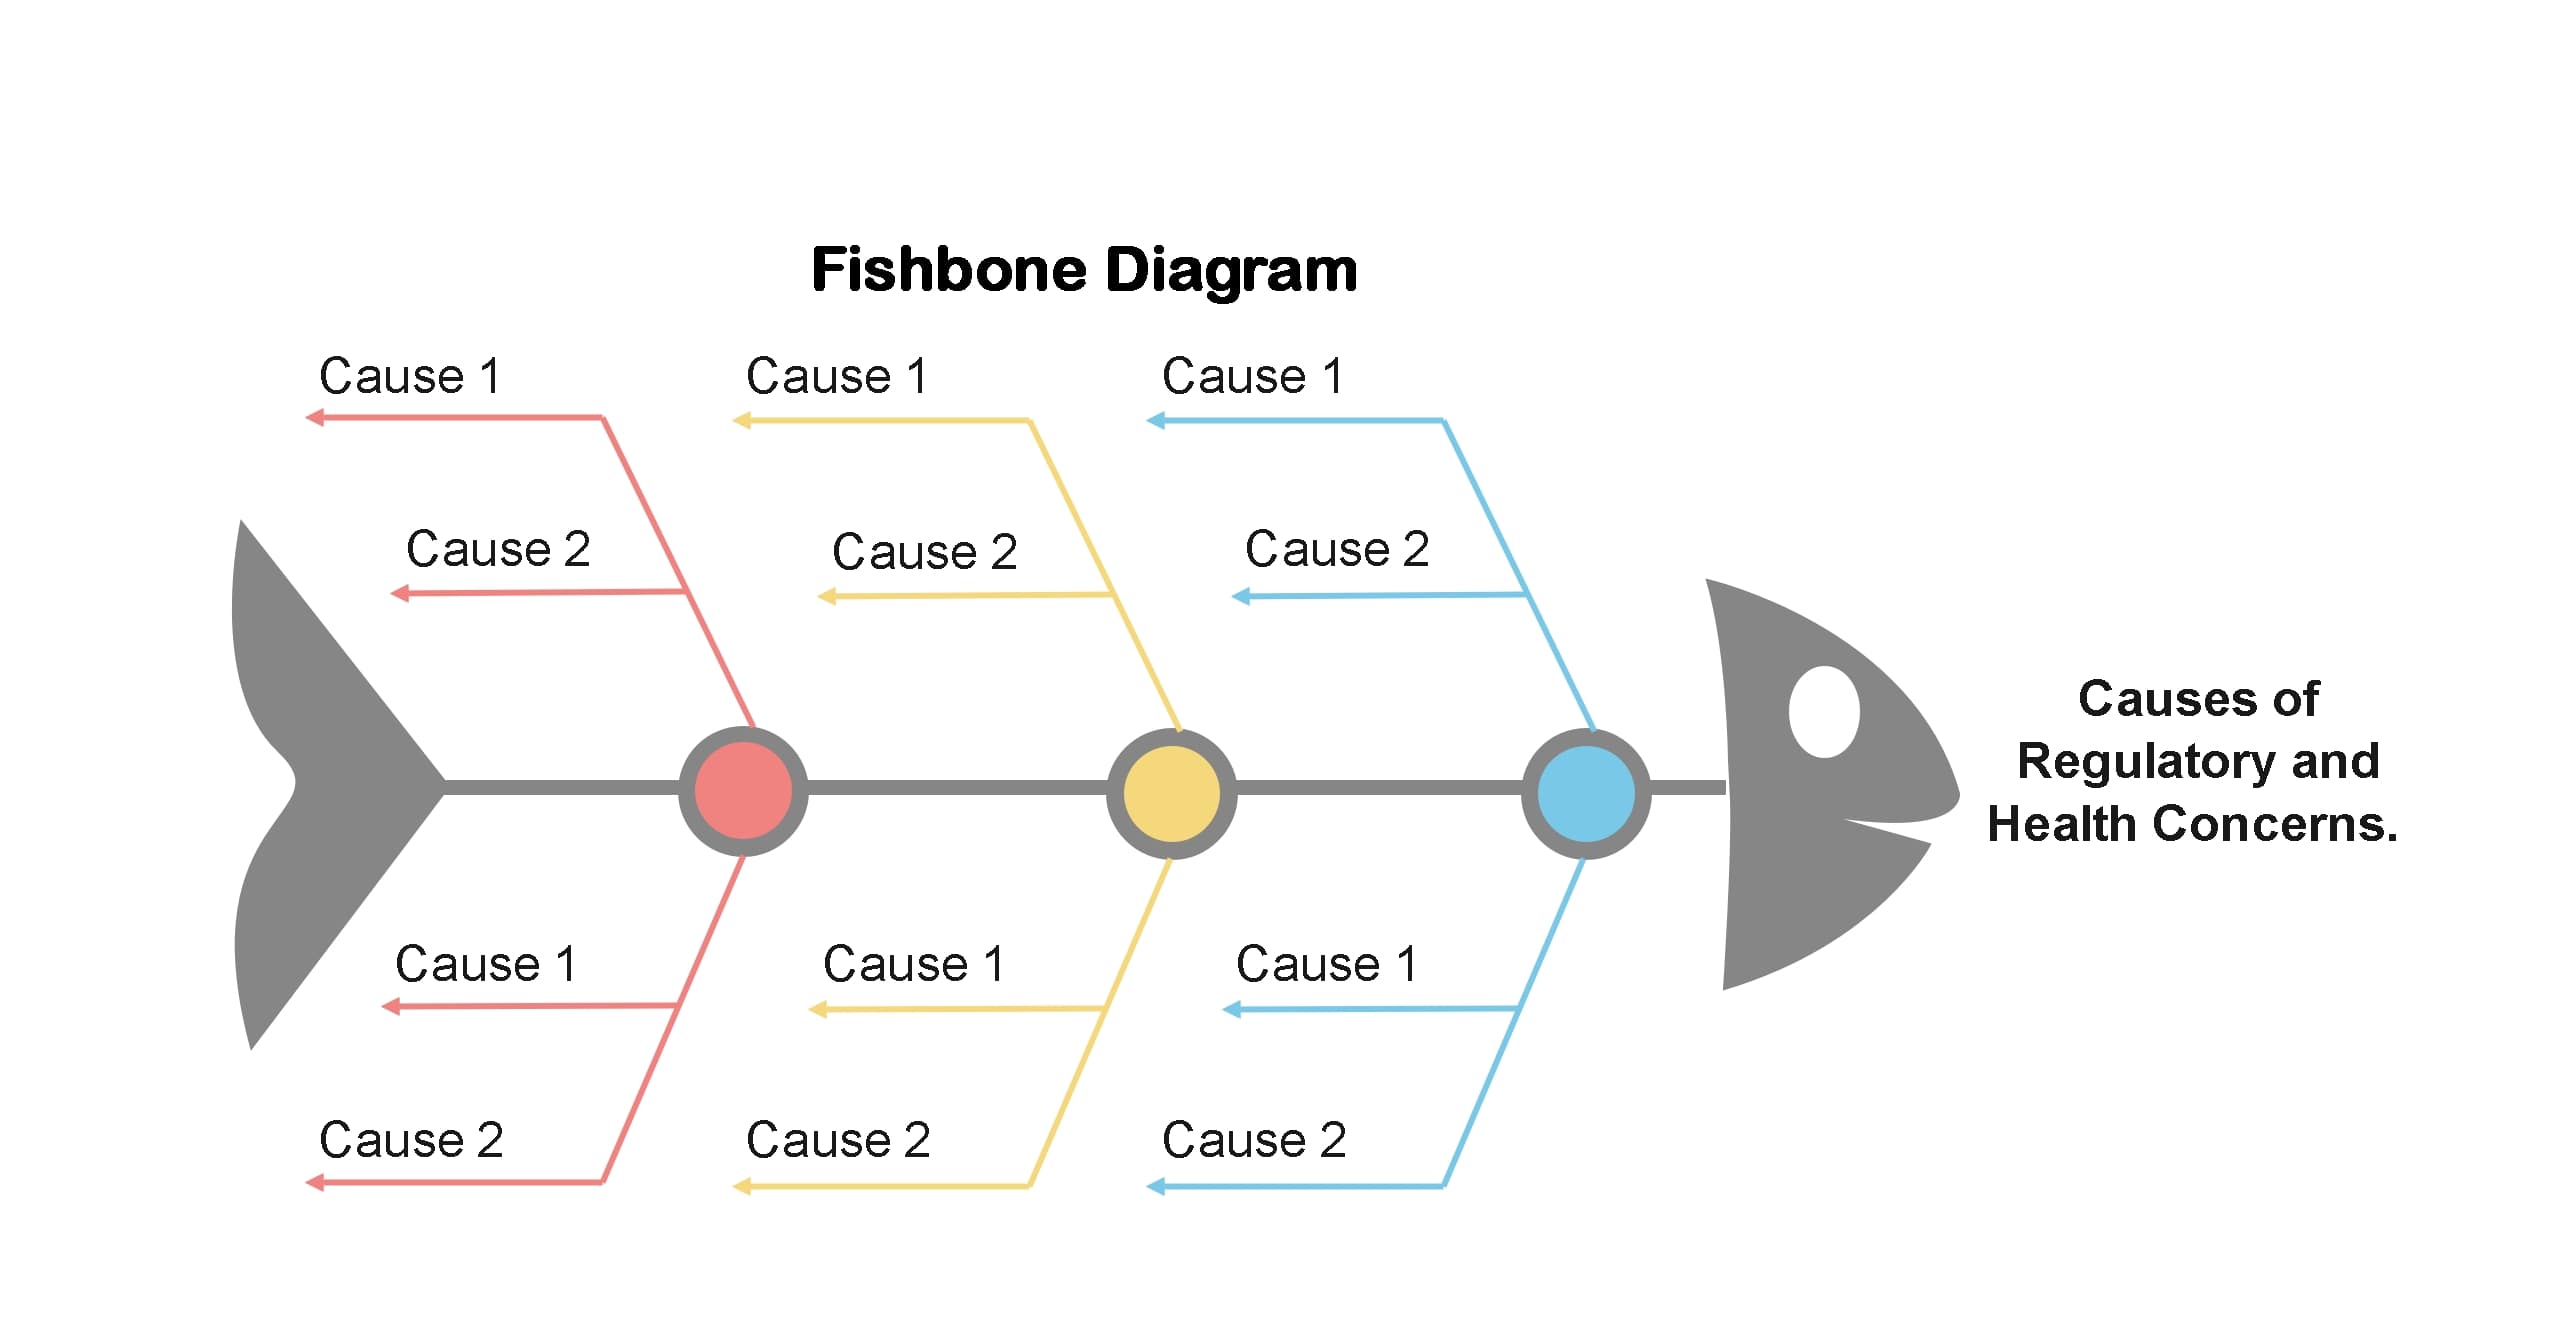
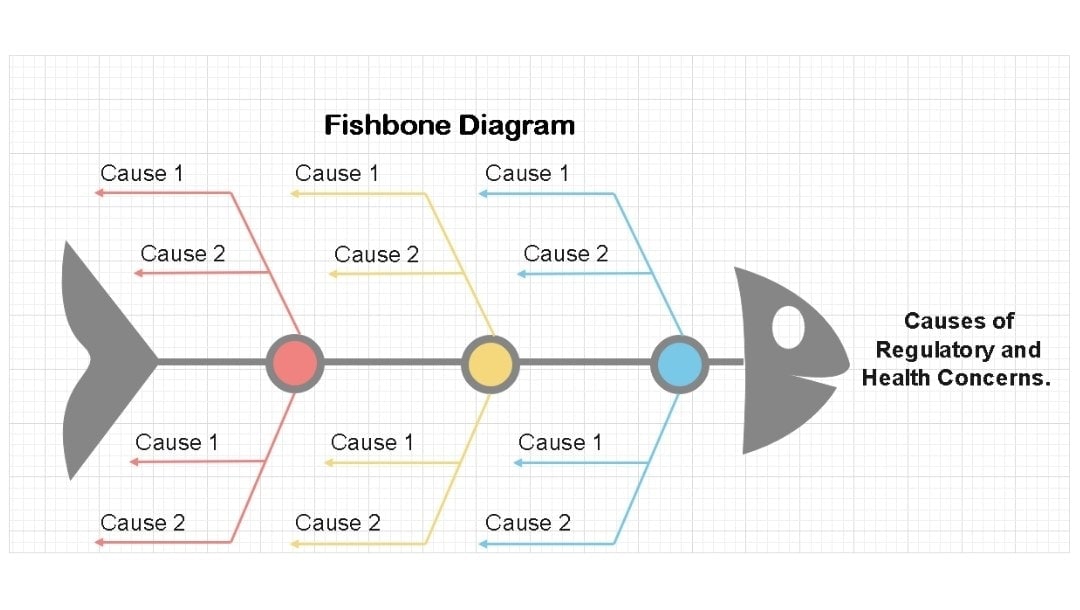
Add a head with the problem you’re analyzing, e.g, Causes of Regulatory and Health Concerns.
Name the bones with causes: cause 1, cause 2, cause 3, etc.
Step 3: Format for Clarity
Make your diagram easy to follow.
Select any element and change colors, fonts, or line styles from the pop-up menu.
Drop in symbols, icons, or use color coding for better grouping from the left side library. It helps a lot during presentations.
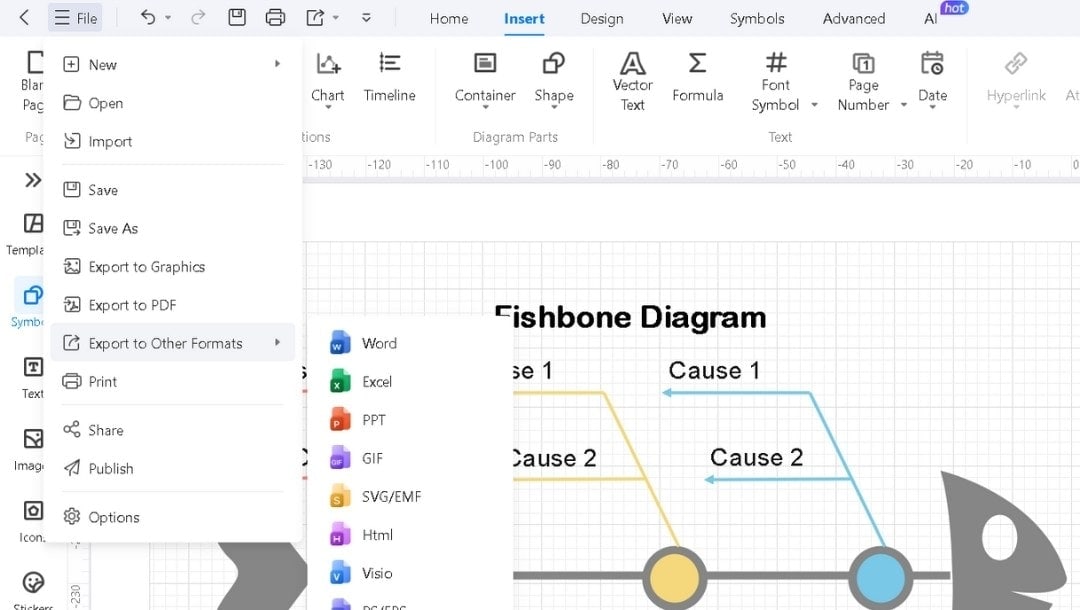
Step 4: Save, Export, or Share
Go to the File menu to export your work in multiple formats or save it to cloud storage.
You can also generate a link for your team using the Share button. With collaboration mode, comments can happen live.
EdrawMax combines editing tools and templates so you can focus on solving problems instead of formatting charts.
Why Use a Blank Fishbone Diagram Template
A blank fishbone diagram isn't just about drawing faster. It builds structure into how problems are defined and ideas are organized. Here's why it matters:
- Frames the problem clearly: The “head” of the fish forces you to write a precise issue statement. It avoids vague descriptions and keeps the team grounded before moving forward.
- Balances discussions: Louder voices can dominate meetings. The neutral template prevents that by guiding attention across categories instead of one-sided causes.
- Keeps a record for later: Ideas are mapped in logical places, which makes it easy to revisit weeks later. No need to dig through scattered notes—the structure keeps continuity intact.
- Supports knowledge transfer: Different teams can use the same template and instantly understand each other's work. The framework itself explains the logic.
- Encourages updates over time: The template can be reused and adjusted. Teams can expand, trim, or refine causes as the problem evolves.
- Speeds up decision-making: You quickly see where causes cluster and where they don't. That distribution helps leaders decide where to focus next.
- Works as a teaching tool: New members learn by doing. The template shows the structure so that they can focus on analysis instead of setup.
Using a blank fishbone diagram is less about convenience and more about consistency. It turns problem analysis into a repeatable and shareable process that grows stronger over time.
Tips for Creating Effective Ishikawa Diagrams
- Define the end state clearly. Don’t just write vague problems like low sales; frame it as the outcome you want, for instance, raising sales from 200 to 350 units. A specific goal keeps the diagram focused.
- Keep each branch short. Aim for 5–7 causes per branch. If more show up, create a sub-fishbone for that category instead of crowding one line.
- Base causes on evidence. Mark them with symbols: ✓ for data-backed, ? for needing proof. It separates facts from assumptions.
- Split controllable from uncontrollable. Use different colors so everyone knows where action is possible and where it isn’t.
- Flag domino causes. Some issues trigger many others. Highlight these with a symbol, since solving them often removes several problems at once.
- Set a timer. Limit brainstorming in each category to 5–7 minutes. It keeps pace steadily and prevents long detours.
- Rank causes when done. Use voting or scoring to decide which issues matter most. That turns the diagram into a plan, not just a sketch.
- Use a parking lot. Place stray ideas in a separate space instead of forcing them into a branch. This facilitates contributions without cluttering.
- Review the diagram the next day. Fresh eyes often bring better insights or corrections.
- Always add next steps. A fishbone only works when each major cause has an explicit action attached.
These minor adjustments ensure the diagram supports action, not just brainstorming.
Wrap Up
Problems evolve, and so should the way we analyze them. A blank fishbone diagram is not just a one-time tool; it’s a framework you can revisit, refine, and build upon.
These Ishikawa diagram templates make it easy. You can start with a basic diagram, update it as new information surfaces, and keep a record of every insight.
That adaptability is why EdrawMax's templates are worth using in every problem-solving session.
AI Diagram Generator
Enter your prompt. Upload files if needed. Generate diagrams, charts, or slides instantly.


