


Did you ever wonder how a library could maintain a record of books, members, and transactions in sequence? A sequence diagram comes in at that. It shows the communication between users and system components in a primitive sequence of actions.
This is simplified by UML (Unified Modeling Language). The sequence diagram is one of the most helpful types of diagrams among a huge number of them. This article will teach you what a sequence diagram is, its most important components, and how a sequence diagram works in a library system.
There will also be examples, uses, and a guide to making one with EdrawMax. When you are done, you will be certain how to use sequence diagrams in system design.
In this article
What Is a Sequence Diagram?
A sequence diagram is a chart that is utilized in UML (Unified Modeling Language). It demonstrates how objects or system components converse with each other. The diagram is concerned with the sequence of these talks, step by step. It is a story turned into arrows and boxes. In each arrow, there is a message passing between objects. The participants in the process are indicated on each box.
This diagram is used in a library system to model the process of borrowing, returning, or searching for a book. It might say, as an example, what happens when a student borrows a book. The student sends a request. In case the book is free, then the system logs the loan and responds. This flow is not complicated to perceive in the diagram.
A sequence diagram is mainly used to show the relationship between the components in a system. It assists designers, developers, and users in viewing the big picture. This is in a library, and it entails demonstrating the relationships between members, books, and staff. The mistakes can be spotted earlier with proper steps. The diagram serves as a guide as well when the system expands or alters.
Core Components of the Library Management Sequence Diagram
A sequence diagram of a library system is a model that illustrates the interaction of various elements whenever a user borrows or returns a book. It shows the actions, decisions, and directions in a logical sequence. Actors or system units are represented by each lifeline. The combination of them provides a systematic image of the events.
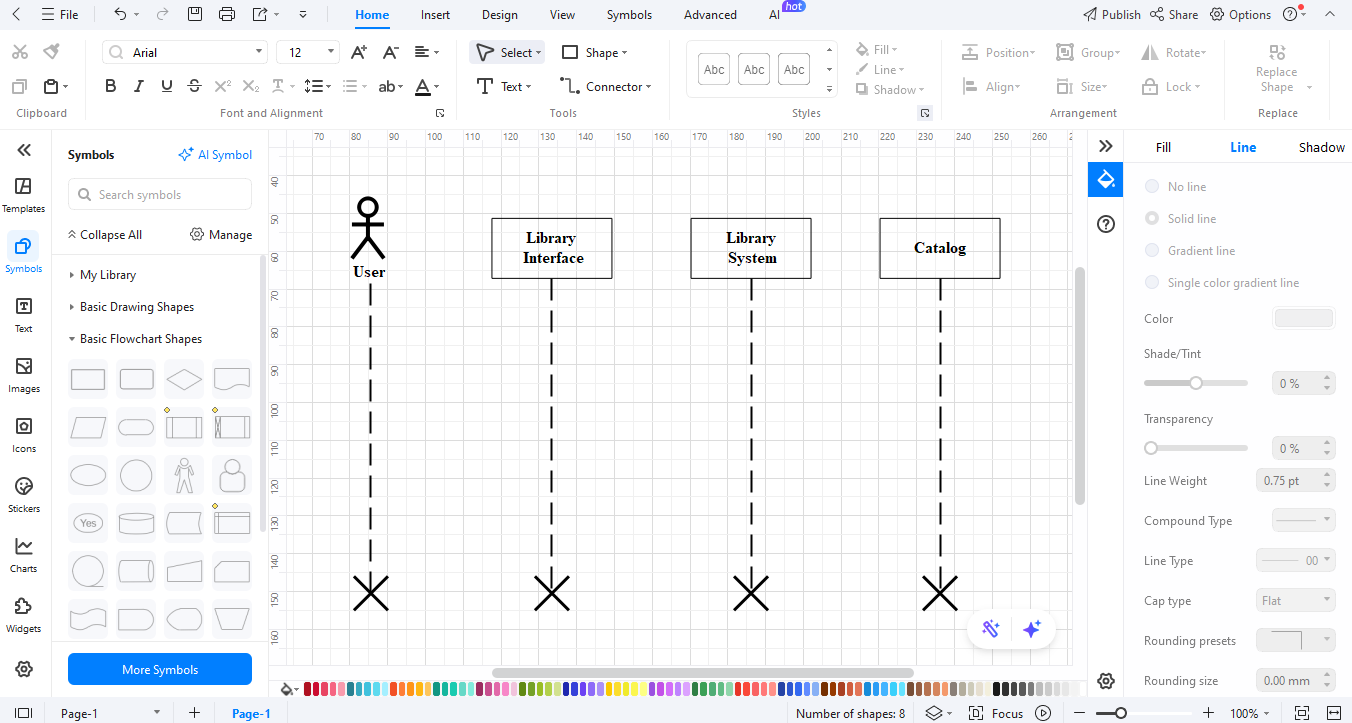
User Lifeline
The starting point is the user lifeline. It demonstrates the activity of a student or a member, e.g., requesting a book. As an illustration, a student will enter a title into the system. This lifeline bridges actual library action to the digital stream flow in the sequence diagram.
Interface Lifeline
Then there is the Interface lifeline. It is the interface between the library system and the user. And then a student looks up Data Structures. The request is received at the interface and sent. This lifeline features the digital desk where queries are received in the first place.
System Lifeline
System lifeline controls processes within the library software. After the request has been received, the system will verify rules, user account restrictions, or borrow history. As an example, upon the user borrowing five books, the system might reject another issue. This is control in the background.
Catalog Lifeline
The database of the library is displayed in the Catalog lifeline. As a request arrives, it will check whether the book is available or not. When there is an inventory of data structures, it will send back a positive message. Otherwise, it is an indication of unavailability. This lifeline is a reflection of a librarian who verifies shelves in life.
Messages
These lifelines are joined together by messages. They are requests or answers, such as “Request Book,” “Check Availability,” or “Confirm Borrow.” A positive path results in the issuance of books, and the negative path directs the user to an alternative. This simplifies the diagram of the effect of choices.
Activation Bar
Active processes are defined by activation bars. A catalog is an example: it continues running till it delivers results.
A combination of these elements is a reflection of the real world. The request is made by a student. The system verifies rules, and the catalog verifies the availability. Then the interface provides feedback. This complete flow allows modeling and enhancing the actual way the library functions daily.
Samples of Sequence Diagrams for Library Management
These are two examples of sequence diagram templates of EdrawMax. Both of them demonstrate the way the interactions take place when a library user takes a book. These examples highlight the obvious flows that you can implement and utilize in your own system design.
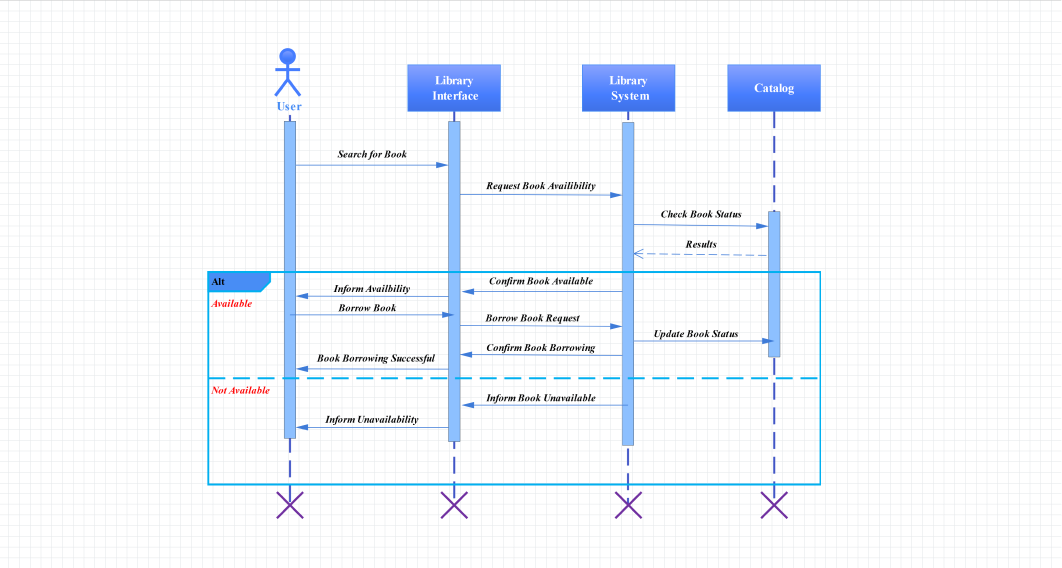
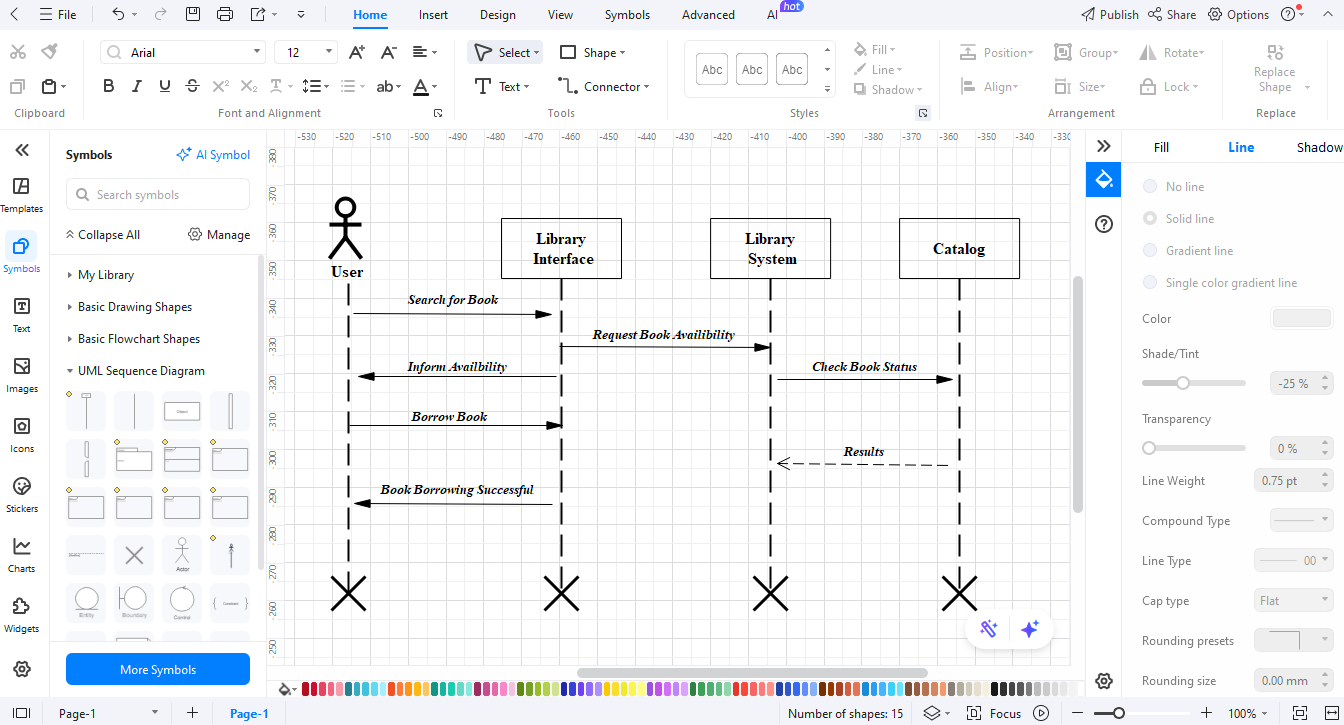
Example 1: Library management system UML Sequence Diagram
The flow in this diagram is illustrated as the user searches for a book. The system shows the choices, the user makes a choice, and the system verifies stock. In the case of the book being in stock, the stock is updated, and the transaction is made. If not, the user is informed.
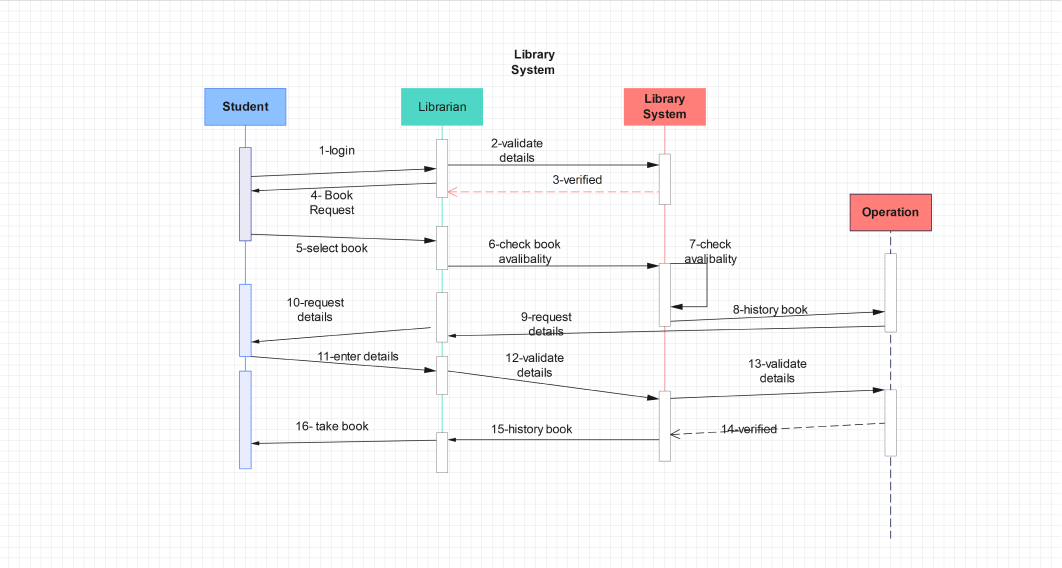
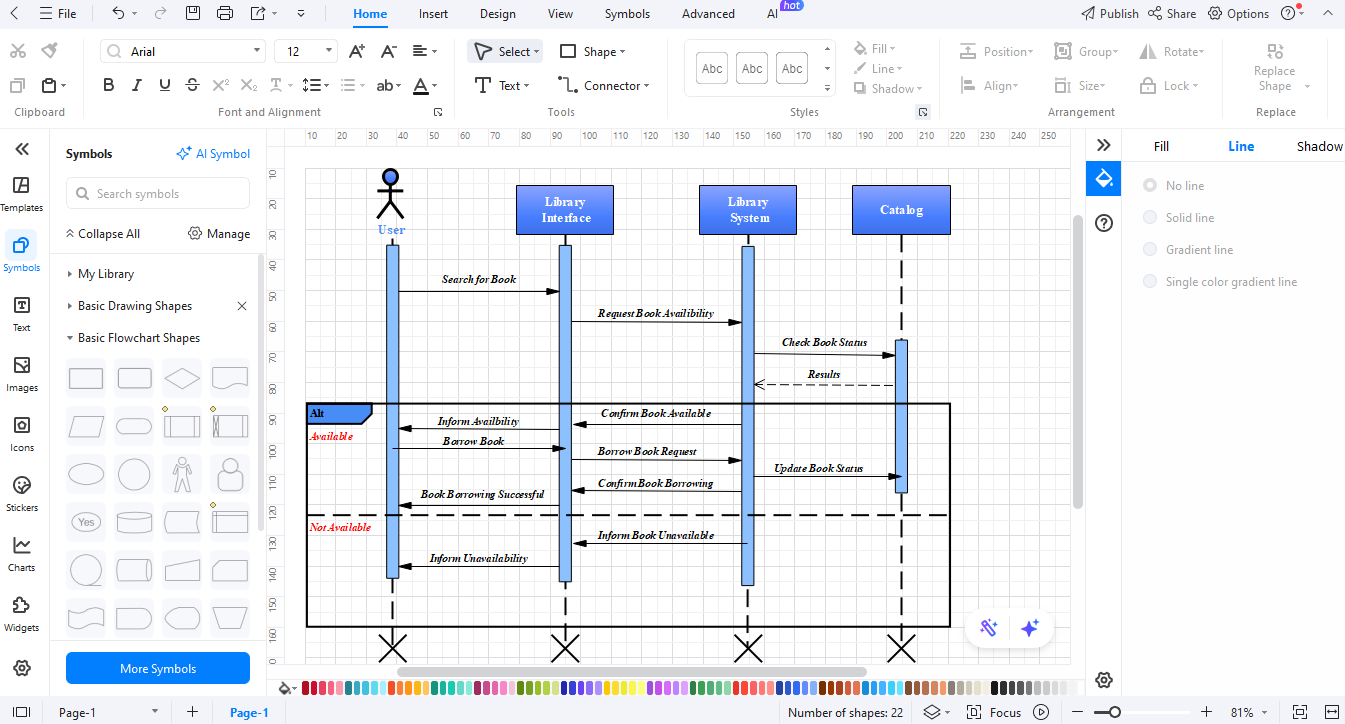
Example 2: Task Sequence Diagram of Library Management
This template is used to lay out the workflow of a borrower. It depicts the actions of students and librarians in a sequence, i.e., search-borrow, which makes it an effective instrument to control the activities and enhance the operations.
Benefits of Using a Sequence Diagram in Library Management
A library management system sequence diagram shows all the steps, starting with requests and ending with replies. It turns the hard-to-understand situations into an understandable vision. Teams use it to plan, discuss, and refine workflow.
Let’s list down some of the key benefits:
- Makes sense of system behaviour: Who is sending what, when, and why. The User, UI, System, and Catalog interactions are intuitive.
- Identification of bottlenecks: Identifies slowness of checks, call-outs, or unnecessary processes. So we can fix delays before the release.
- Improves the communication: Librarians, developers, and testers will read the same flow. Fewer misunderstandings. Faster agreement on changes and priorities.
- Guides robust design: Maps success and failure paths. Book unavailable, fines, or holds.
- Backs change impact analysis: Refresh the flow, see which elements break. Lower risk. Safer upgrades and integrations.
These gains collectively minimize, rework, and reduce the support load. A library management system sequence diagram will be handy in ensuring that the services remain simple, rapid, and reliable.
How to Make a Sequence Diagram for Library Management in EdrawMax
A library management system sequence diagram indicates the interactions between users and system components in a step-wise manner. It is not simply an image--it is a map towards creating understandable, well-trustworthy workflows.
Using EdrawMax, one can create one easily. The tool provides prepared symbols, drag-and-drop editing, and export. It can be made in a clean diagram within minutes.
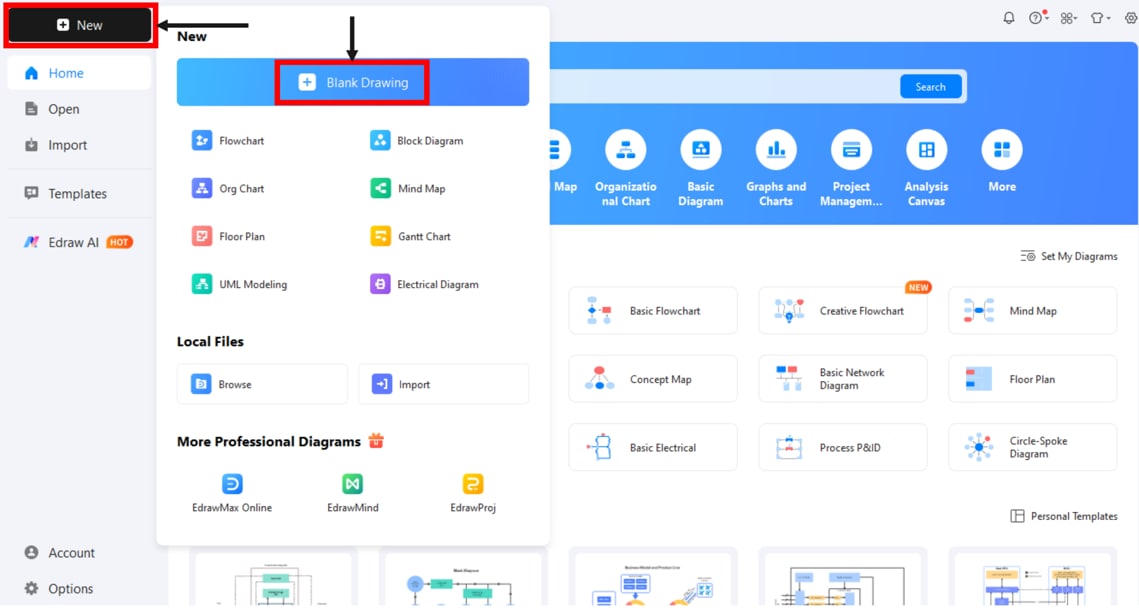
Step1Start a New Diagram
- Open EdrawMax on your desktop.
- The left panel can be clicked on New, and then Blank Drawing is selected.
- A new canvas will open.
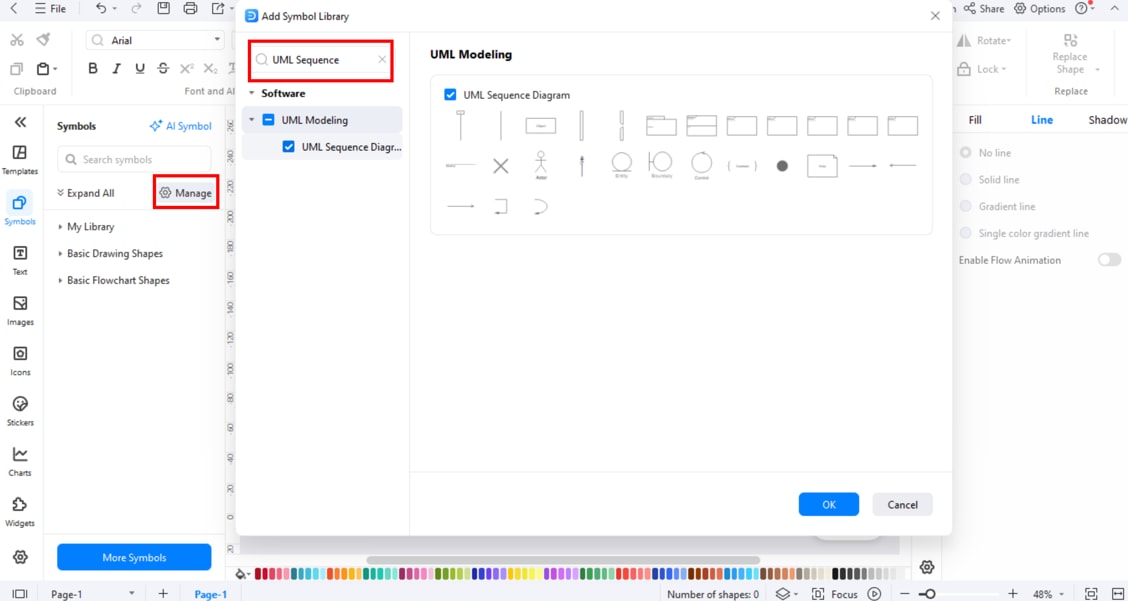
Step2Add UML Sequence Symbols
- Click Symbols on the left.
- Select Manage Symbols
- Then press the Add More Symbols button.
- Check UML Modeling in the pop-up. This gives lifelines, messages, and activation bars to your library.
Step3Insert Lifelines
- Drag lifelines to the canvas using the symbols tab.
- Use User, Librarian, System, and Catalog as main lifelines.
- Arrange them one next to the other in the correct sequence on the canvas.
Step4Add Messages Between Lifelines
Use arrows to indicate such flows as search book, borrow book, and return book.
Add decision flows:
- If the book is available → confirm the issue.
- If the book is not available → notify the user.
Step5Show Activation Bars and Options
- Install action bars on running lifelines.
- Optional paths must be indicated with dashed arrows or notes, such as dealing with overdue books or user fines.
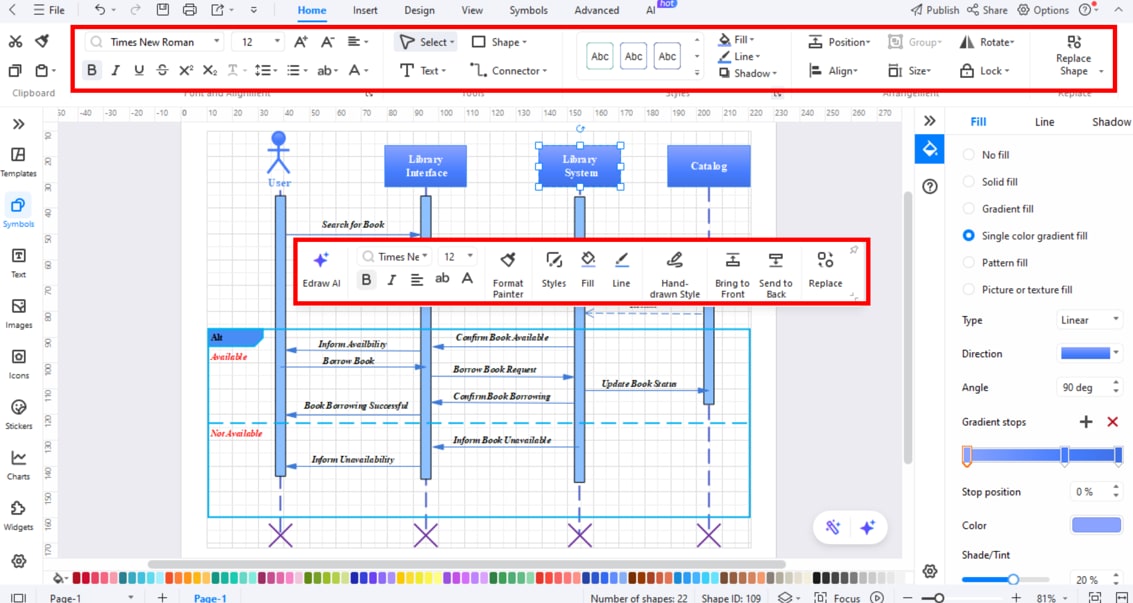
Step6Style and Review
- Tidy the layout with alignment tools.
- Add labels for clarity.
- Make the flow straightforward so that the readers are not confused about the steps.
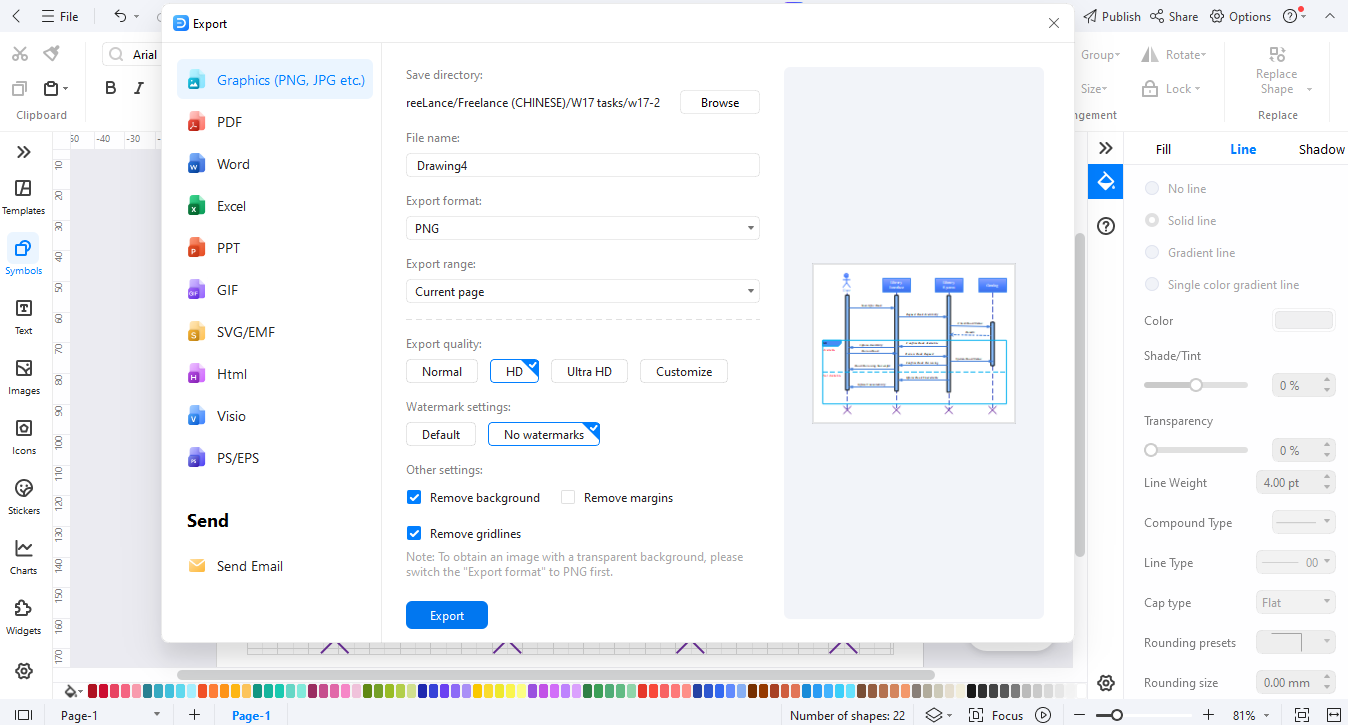
Step7Export the Diagram
- By the time this is done, select Export from the top menu.
- Choose PNG, JPG, PDF, Word, or Visio.
- Share with your team or use in system reports.
Using EdrawMax, everyone can create a sequence diagram of a library management system. Start designing the workflow today.
Conclusion
A library management system sequence diagram helps to put things into perspective. It demonstrates the processes of searching, borrowing, and returning books step by step. This assists in enhancing work processes and ensures that both developers and librarians can perform more effectively.
It is even simpler to create such diagrams with EdrawMax. The tool is easy to use, includes pre-made templates, and you can begin free of charge. Try EdrawMax and create your sequence diagrams now.
AI Diagram Generator
Enter your prompt. Upload files if needed. Generate diagrams, charts, or slides instantly.


