


A state chart diagram shows the dynamic state changes of an object. It illustrates how the object’s state changes according to the particular event or condition.
A state chart diagram is used to model the dynamic nature of a system. It aids comprehension, design, and documentation of how objects respond over time. Transition visualization gives a blueprint of the system's behavior under different circumstances.
State chart diagrams visualize the states, events, and transitions. These are the parts that describe how an object behaves, changes, responds to, and interacts with other objects driven by either internal or external conditions.
Overall, state chart diagrams are suitable to describe the behavior of real-time systems. They promote clarity in code. This makes communication easier for developers. They also help maintain an understanding of how objects are managed throughout their lifecycles. This makes them fundamental to the construction of dependable, event-based software systems.
In this article
- State Chart Diagram for Animal Breed Identification
- State Chart Diagram for Bluetooth Conferencing
- State Chart Diagram for Calendar Appointment
- State Chart Diagram for Chess Game
- State Chart Diagram for DICOM Hosted App
- State Chart Diagram for Java Thread
- State Chart Diagram for Product Page
- State Chart Diagram for System Test
- State Chart Diagram for Document Review
- State Machine Diagram for Water State
- Components of a State Chart Diagram
- FAQ
State Chart Diagram for Animal Breed Identification
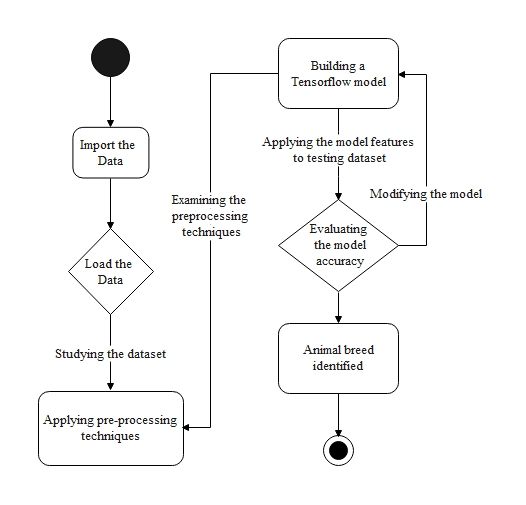
This diagram shows how to identify an animal breed using TensorFlow and machine learning. It starts with importing and loading data. Then, we study and preprocess the dataset to ensure quality input. Once prepared, a TensorFlow model is built and tested. The model's accuracy is checked.
If it doesn’t perform well, we tweak it and retrain. This process continues until accuracy is achieved. Once validated, the model successfully identifies the animal breed. The diagram visualizes a machine learning system. It starts with raw data preprocessing and ends with final prediction outcomes.
State Chart Diagram for Bluetooth Conferencing
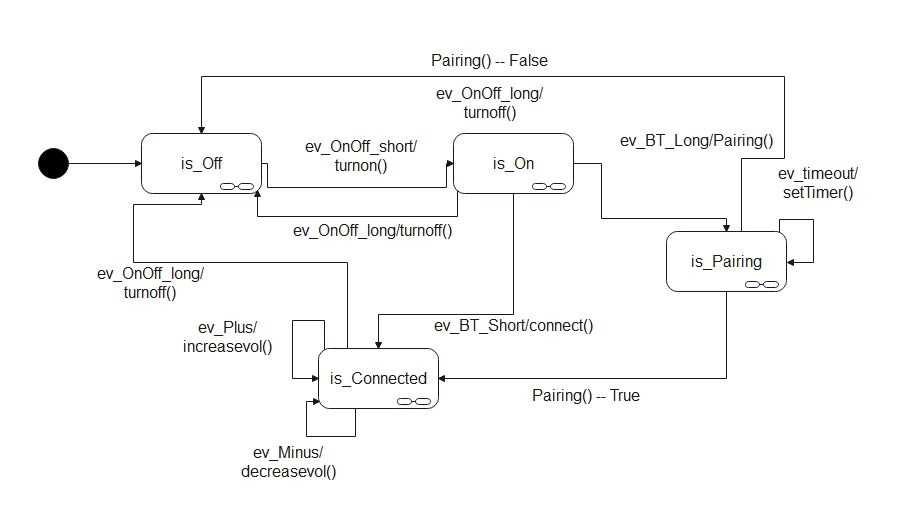
This diagram shows the states and transitions in a Bluetooth conferencing system. The process starts with the device in the "Off" state. A short press turns it "On." Next, a long Bluetooth press puts the device into pairing mode. After a successful connection request, it shifts to the "Connected" state.
In this state, you can adjust the volume. At any time, a long press can turn the system off. Timeout conditions reset pairing attempts. This state chart illustrates how Bluetooth devices move between off, pairing, and connected states.
State Chart Diagram for Calendar Appointment
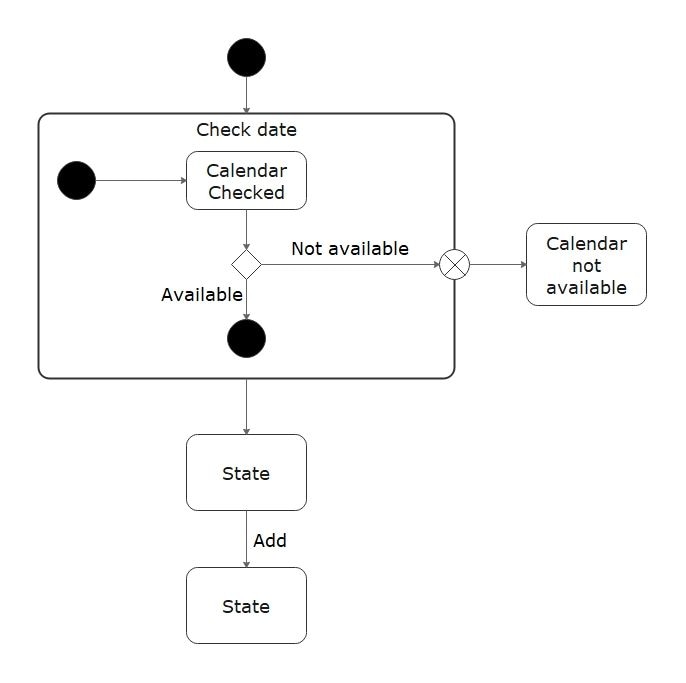
This state machine diagram illustrates how to check and manage calendar availability for scheduling. The process starts by verifying the calendar's status. If the calendar is not available, it shows an error. If it's available, the flow moves to managing appointments. Once confirmed, the user can begin scheduling.
Appointments are added one after another in the system. This state chart clearly illustrates how system states support appointment creation. It covers everything from checking availability to adding events, ensuring smooth scheduling while effectively handling unavailable calendar situations.
State Chart Diagram for Chess Game
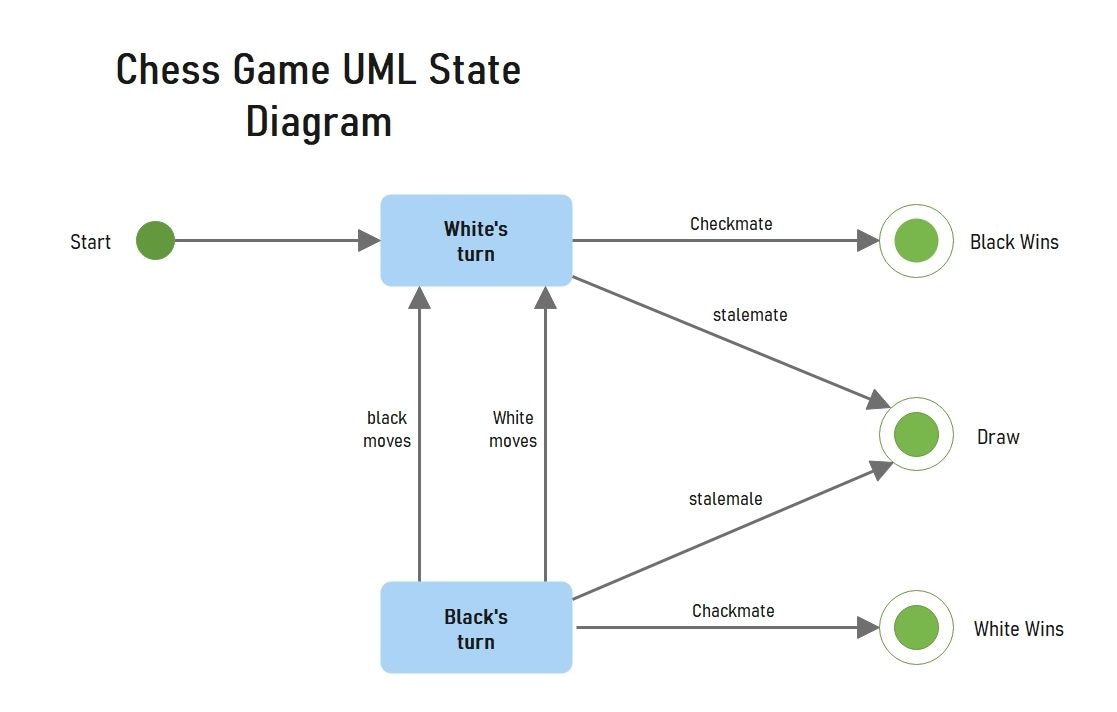
The Chess Game UML State Diagram outlines the stages and outcomes of a chess match. It begins at the start, alternating between White’s turn and Black’s turn. Players take turns based on whose move it is.
Transitions happen due to outcomes like checkmate or stalemate. Checkmate means the opposing player wins. A stalemate results in a draw. This diagram illustrates the flow of turns, key decisions, and end states. It clearly shows how a chess game progresses and concludes.
State Chart Diagram for DICOM Hosted App
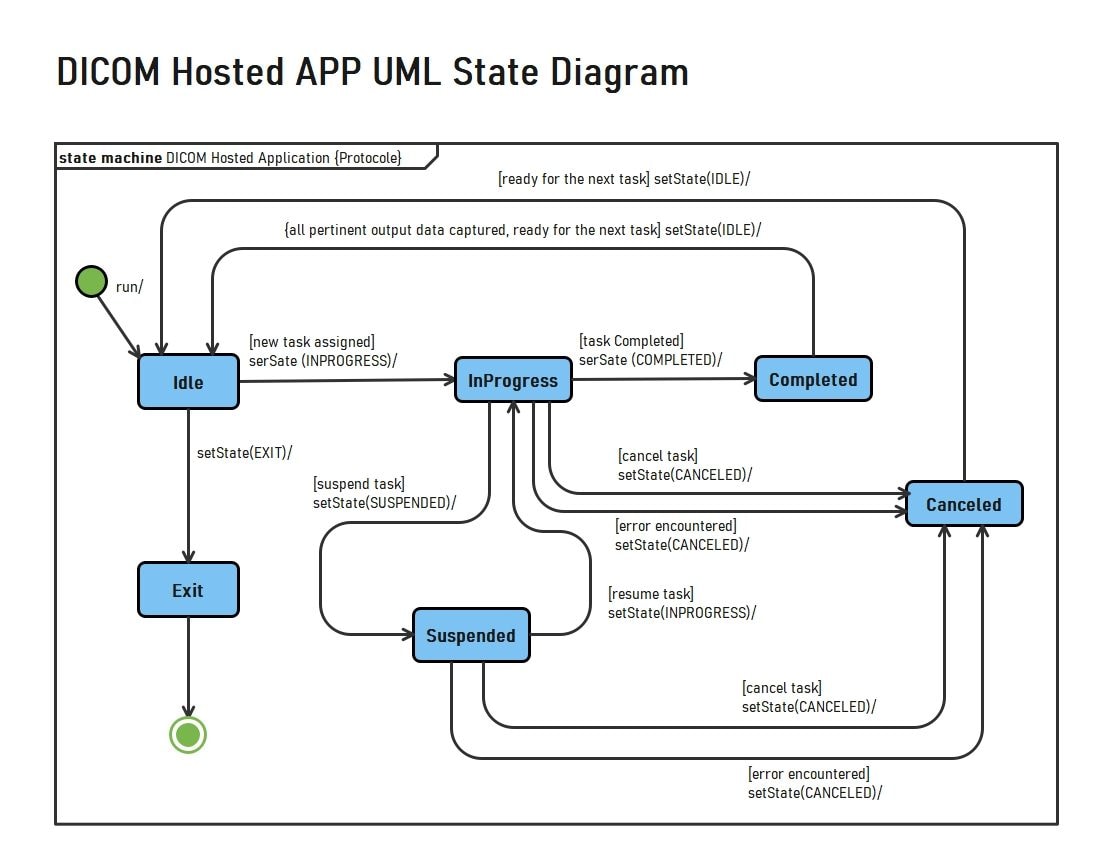
The DICOM Hosted App UML State Diagram illustrates the process behind how a hosted medical imaging app operates. It first enters the Idle state and switches to In Progress whenever a new job arrives. It moves to the Completed, Canceled, or Suspended states, depending on what the task accomplished.
Each state is associated with events such as tasks done, suspended, cancelled, or any errors. Tasks can be resumed or cancelled from the Suspended state. This state chart makes it simple to see how the system reacts to user input and users' mistakes, giving you an idea of how medical imaging apps work and stay stable.
State Chart Diagram for Java Thread
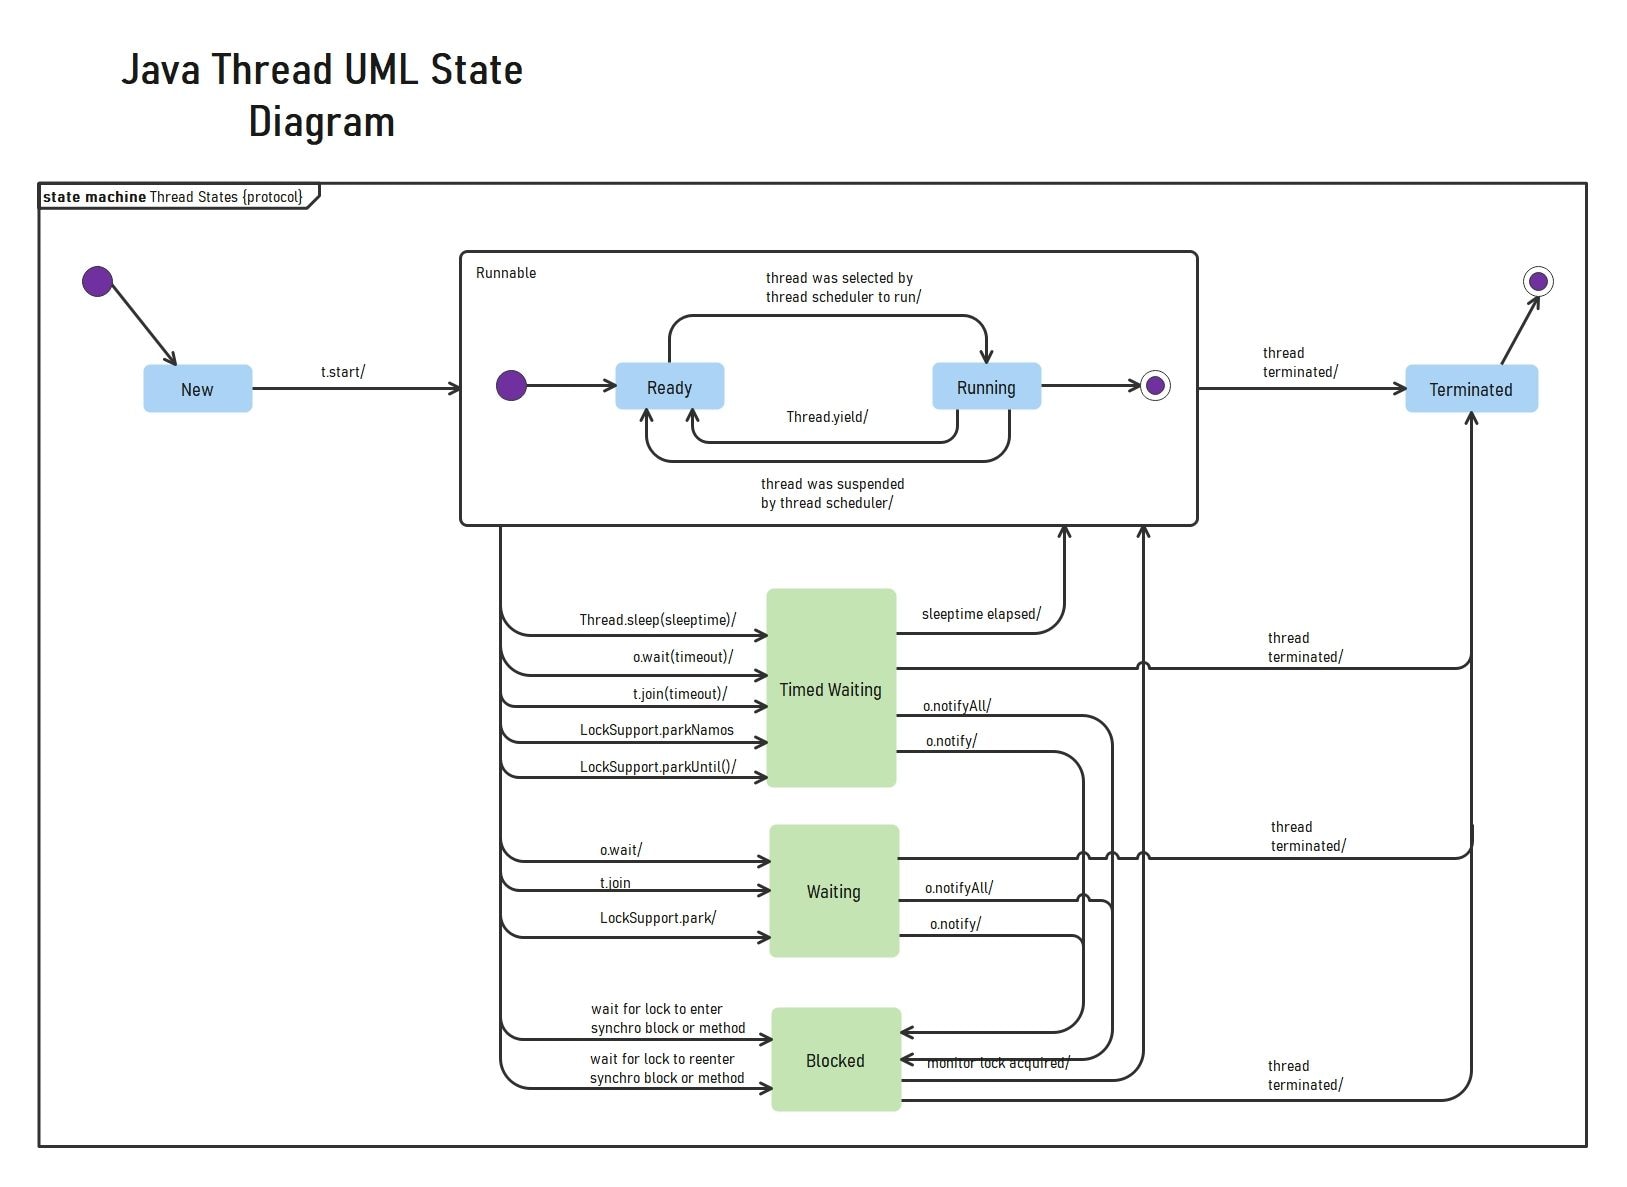
The UML State Diagram for Java Thread shows the complete lifecycle of a Java thread. It starts in the New state. Then it moves to Ready, waiting for the scheduler to select it. From Ready, it transitions to Running when executed. It can also shift to Waiting, Timed Waiting, or Blocked based on synchronization and method calls.
Each waiting state can return the thread to running once conditions are met. Finally, the thread moves to Terminated after it completes. This diagram clearly visualizes Java's concurrency model, detailing how threads operate, pause, and finish in a managed environment.
State Chart Diagram for Product Page
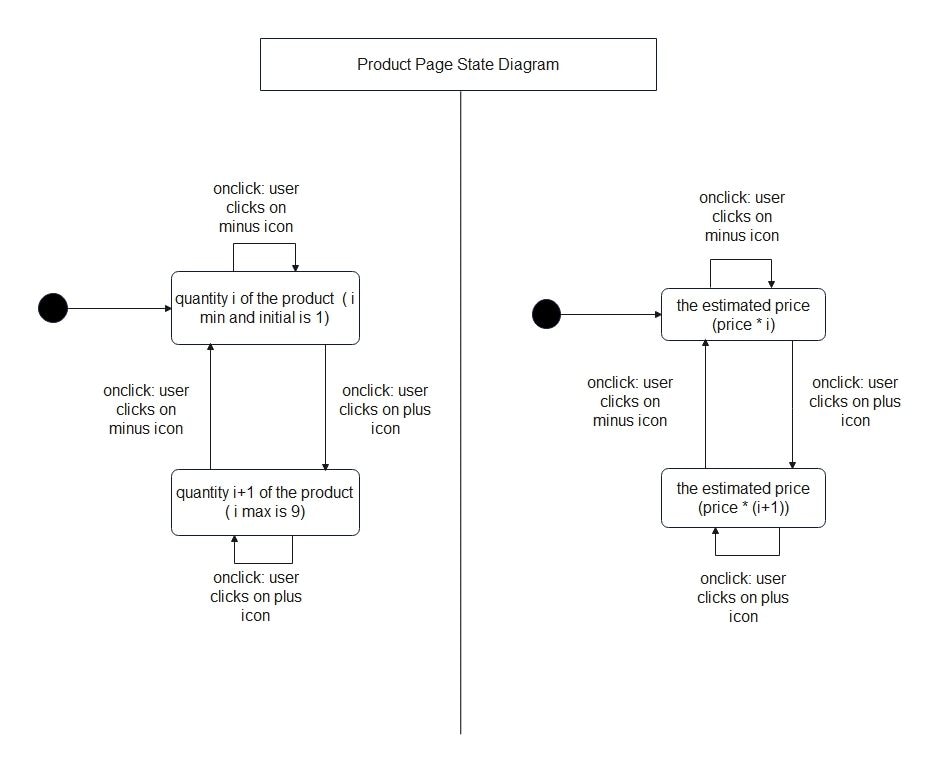
This state machine diagram shows how a product page functions. Users adjust product quantities and see updated prices. It starts with a quantity state of one and changes when users click plus or minus icons.
Each change updates the quantity and estimated price, shown in another diagram. The quantity can’t go below one or above nine, keeping product selection controlled. This diagram highlights how the user interface reacts to clicks, helping customers see costs while changing order amounts.
State Chart Diagram for System Test
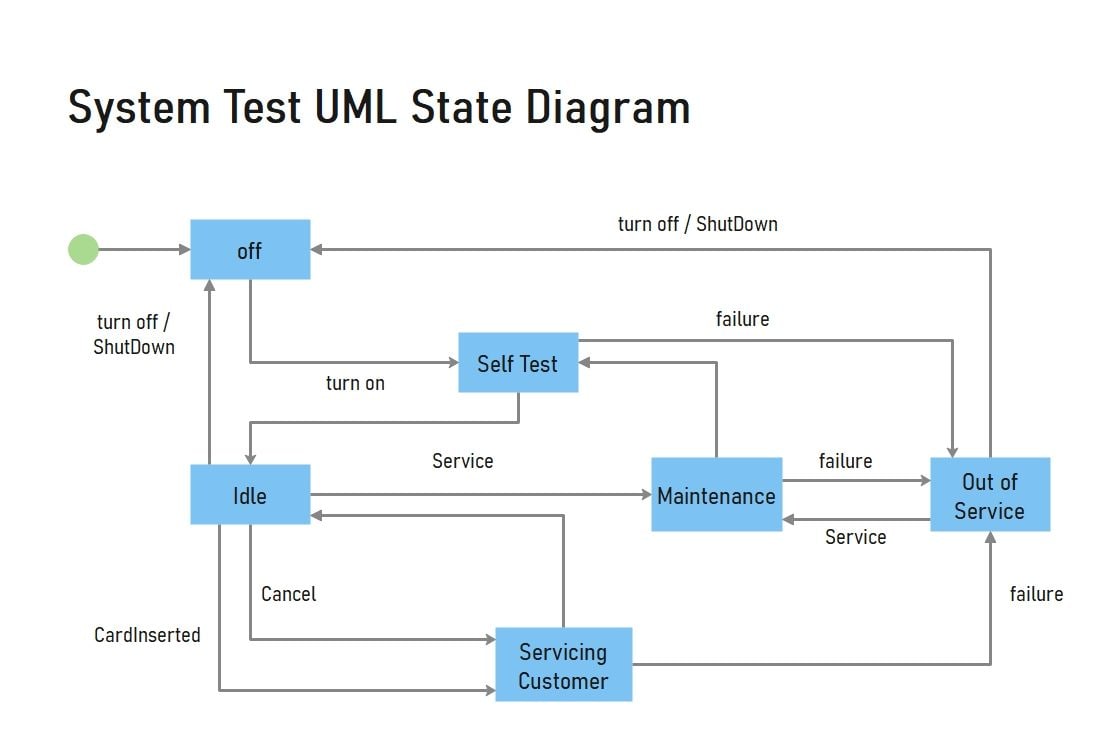
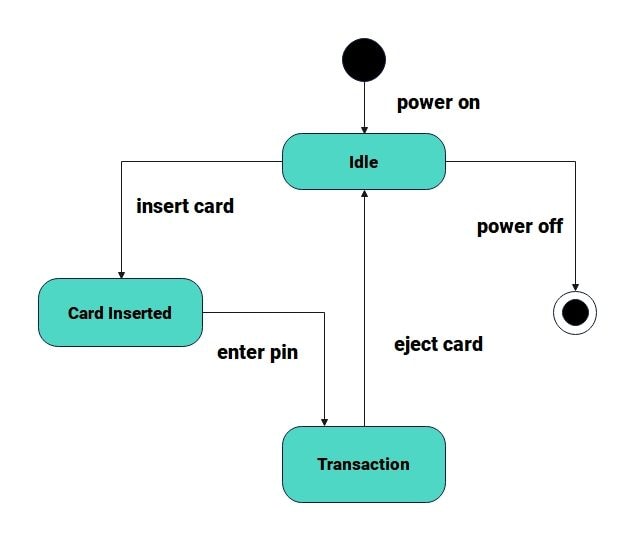
This UML state diagram shows the system's operational states and its responses to events. It starts in the “off” state and moves to “self-test” when powered on. If the test succeeds, the system goes to “idle,” ready for input or maintenance. Inserting a card shifts it to “servicing customer.”
Selecting a service leads to “maintenance.” If any failures occur, the system switches to “out of service” to ensure safety and reliability. Users or admins can turn off or shut down the system at any time. This diagram models fault-tolerant workflows and highlights clear error handling, testing, and maintenance in automated systems.
State Chart Diagram for Document Review
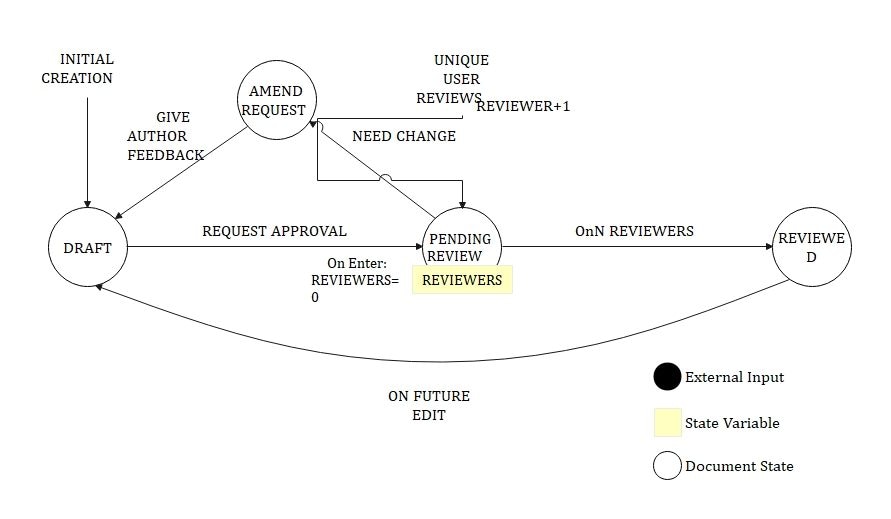
This state machine represents the complete lifecycle of a document. It starts out in a "draft" state where authors can request approval or feedback. The document transitions into a state of "pending review" on the occasion of a request and counts the number of reviewers.
Reviewers could request modifications, forwarding the document to “amend request” before it’s resubmitted. When all of the reviewers have accepted, the document becomes in the “reviewed” state. Edits in the future revert it back to a draft to be updated. This figure makes a clear distinction of structured review workflows, identifying paths for feedback, approval, and revisions to guarantee the quality output of documents.
State Machine Diagram for Water State
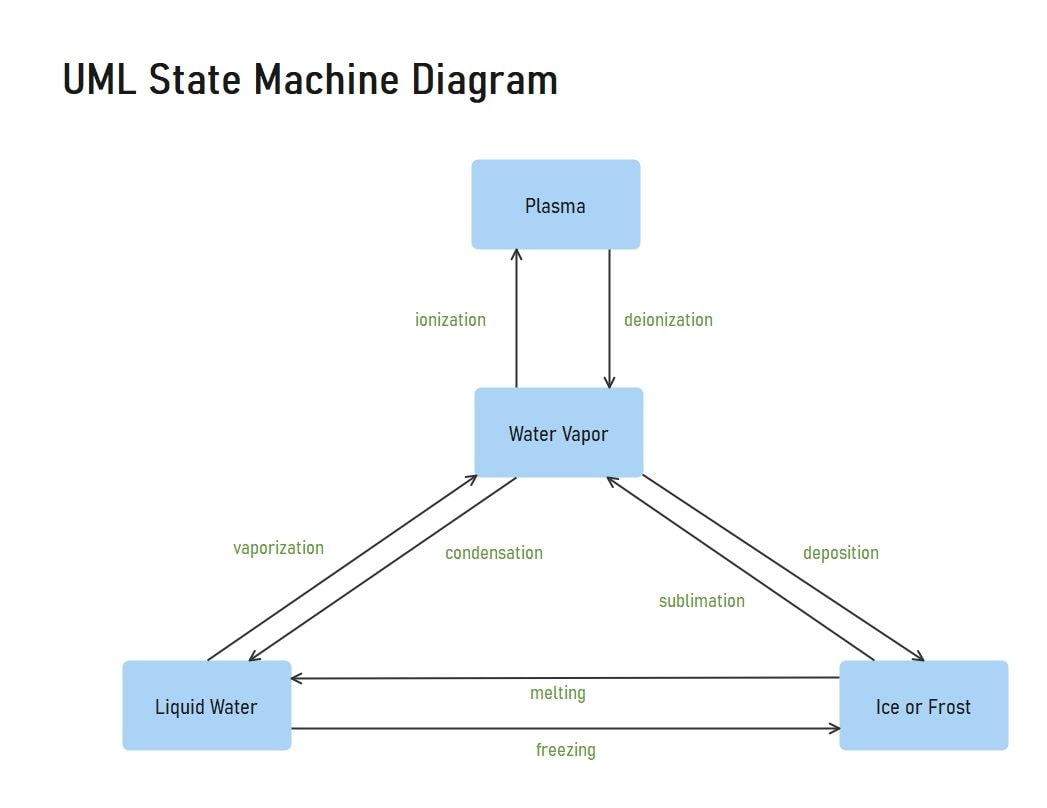
This UML statechart diagram example shows the states of water and changes of state. States of water include liquid, solid (ice or frost), vapor, and plasma. The diagram illustrates the transitions between phases, and the accompanying terms to describe energy changes during phase changes (melting, etc.) are at the top.
Arrows indicate reversible processes, explaining how the state of water can change with temperature and pressure. This diagram shows phase transitions. It demonstrates the process of water changing forms. This occurs under normal and extreme conditions, such as high-energy environments that form plasma.
Components of a State Chart Diagram
A state graph can be drawn with just a few regular building blocks:
- States: Atomic states: Example, Available, Borrowed. Composites: Larger states that contain embedded sub-states.
- Initial and Final States: The filled black circle corresponds to the initial state. The final state, depicted as a target sign, represents the end of its course.
- Transitions: Arrows for movement between states of the system. They are named after the event that triggers the change.
- Events/Triggers: Ways transitions begin, such as “button pressed” or “payment approved.”
- Effects: Actions taken when entering, exiting, or while in a specific state.
- Guards (Conditions): Conditions in square brackets under which the transition can happen. Example: [balance > 0].
- Notes: Comments for documentation or clarification.
Taken together, their pieces create a visual sketch of what something does: not only where it goes, but also how and why it changes.
FAQ
-
What is the main purpose of a state chart diagram?
A state chart diagram shows how a system behaves over time. It shows how objects change states because of events, actions, or conditions. -
Why are state chart diagrams important in software development?
They make complex behaviors easier to understand. They improve communication among developers. They ensure documentation is accurate. They also help design reliable event-driven systems. -
What types of systems benefit most from state chart diagrams?
Real-time, event-driven, and interactive systems benefit the most from state chart diagrams. This includes games, scheduling tools, Bluetooth devices, and machine learning workflows.
AI Diagram Generator
Enter your prompt. Upload files if needed. Generate diagrams, charts, or slides instantly.


