


Creating graphs in Visio can be an effective way to visually represent data and information. Visio offers a wide range of advantages for creating graphs. Here, we will discuss the advantages of creating graphs in Visio, the types of graphs that can be created in Visio, tips for effective Visio graph creation, and more.
In this article
Part 1. Advantages of Creating Graphs in Visio
Creating graphs in Visio is extremely popular. There are several advantages of creating a Visio graph.
- User-Friendly Interface:Visio provides a user-friendly interface that allows for easy manipulation and customization of graphs. Users can easily drag and drop shapes, connectors, and text to create visually appealing and informative graphs.
- Integration with Microsoft Office:Visio seamlessly integrates with other Microsoft Office applications, such as Excel and PowerPoint, allowing for easy import and export of data and graphs. This integration streamlines the process of creating and sharing graphs within various documents and presentations.
- Customization Options:Visio offers a wide range of customization options for graphs, including color schemes, styles, and formatting. Users can tailor their graphs to suit their specific needs and preferences, creating professional-looking visuals.
- Collaboration Features:Visio enables collaboration among multiple users, allowing for real-time editing and sharing of graphs. This feature is particularly useful for team projects and presentations, as it promotes efficient collaboration and feedback.
Part 2. Types of Graphs That Can Be Created in Visio
There are various types of graphs that can be created using Visio. This versatility of Visio is one of the many reasons why it’s so popular.
- Bar Graphs:Visio allows for the creation of traditional bar graphs, which are useful for comparing values across different categories.
- Line Graphs:Line graphs can be easily created in Visio to show trends and changes over time, making them ideal for visualizing data with a temporal component.
- Pie Charts:Visio supports the creation of pie charts, which are effective for displaying proportions and percentages within a whole.
- Organizational Charts:Visio offers a variety of templates and shapes for creating organizational charts, including hierarchical structures and reporting relationships.
- Flowcharts:Visio is well-suited for creating flowcharts to illustrate processes, workflows, and decision-making pathways.
Part 3. Tips for Effective Graph Creation in Visio
Creating graphs in Visio involves a straightforward process. With some helpful tips for effective Visio graph creation, one can easily create graphs in Visio.
- Use Consistent Formatting:Maintain a consistent color scheme, font style, and sizing across all elements of the graph to ensure visual coherence and clarity.
- Label Clearly:Clearly label all axes, data points, and categories to provide context and understanding for the viewer.
- Simplify Complexity:Avoid clutter and complexity by simplifying the graph to highlight the most important data points and trends.
- Utilize Templates:Visio offers a range of pre-designed templates for various graph types, which can serve as a starting point for customization and graph creation.
Visio users can use the application to create effective process flow diagrams. For creating process flow diagrams in Visio, some best practices should be followed.
- Identify Process Steps:Clearly define and label each step of the Visio PFDto provide a comprehensive overview of the workflow.
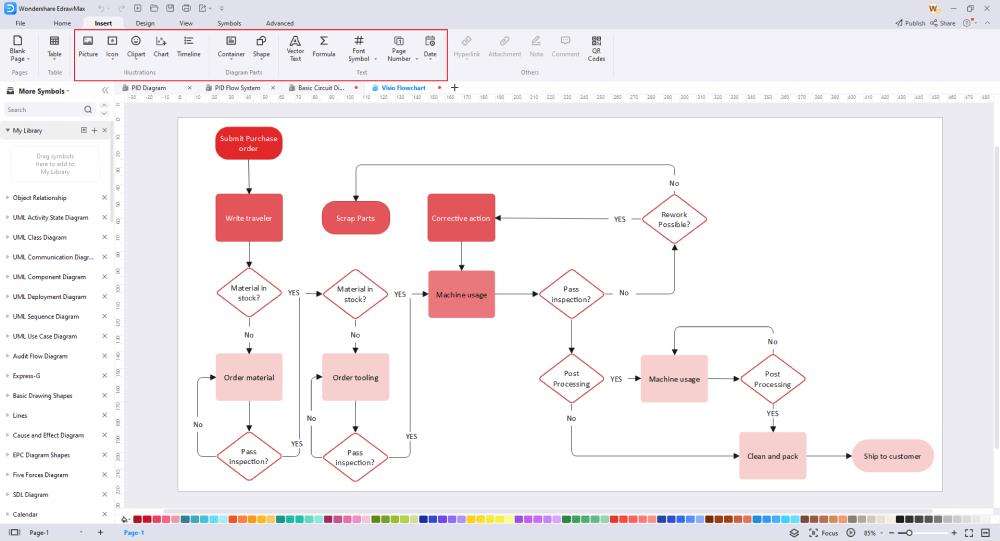
- Use Standard Symbols:Visio provides a library of standard symbols and shapes for process flow diagrams, ensuring consistency and clarity in representation.
- Consider Logical Flow:Arrange the process steps in a logical sequence to illustrate the flow of activities and decision points.
Part 4. Create an Effective Flowchart with EdrawMax
Wondershare EdrawMax is the best tool for creating diagrams because it offers a wide range of templates, intuitive drag-and-drop functionality, extensive customization options, collaborative features, and cross-platform compatibility, making diagram creation easy, efficient, and professional. Here are the steps to create a diagram using the tool:
Step 1: Log into your EdrawMax account to begin creating a flowchart using a Wondershare EdrawMax template. To access the platform, enter your credentials and click the login button.

Step 2: Find and click the "New Document" button in the upper left corner of the screen after you've logged in. You'll be able to begin constructing your flowchart right away when a blank canvas appears.

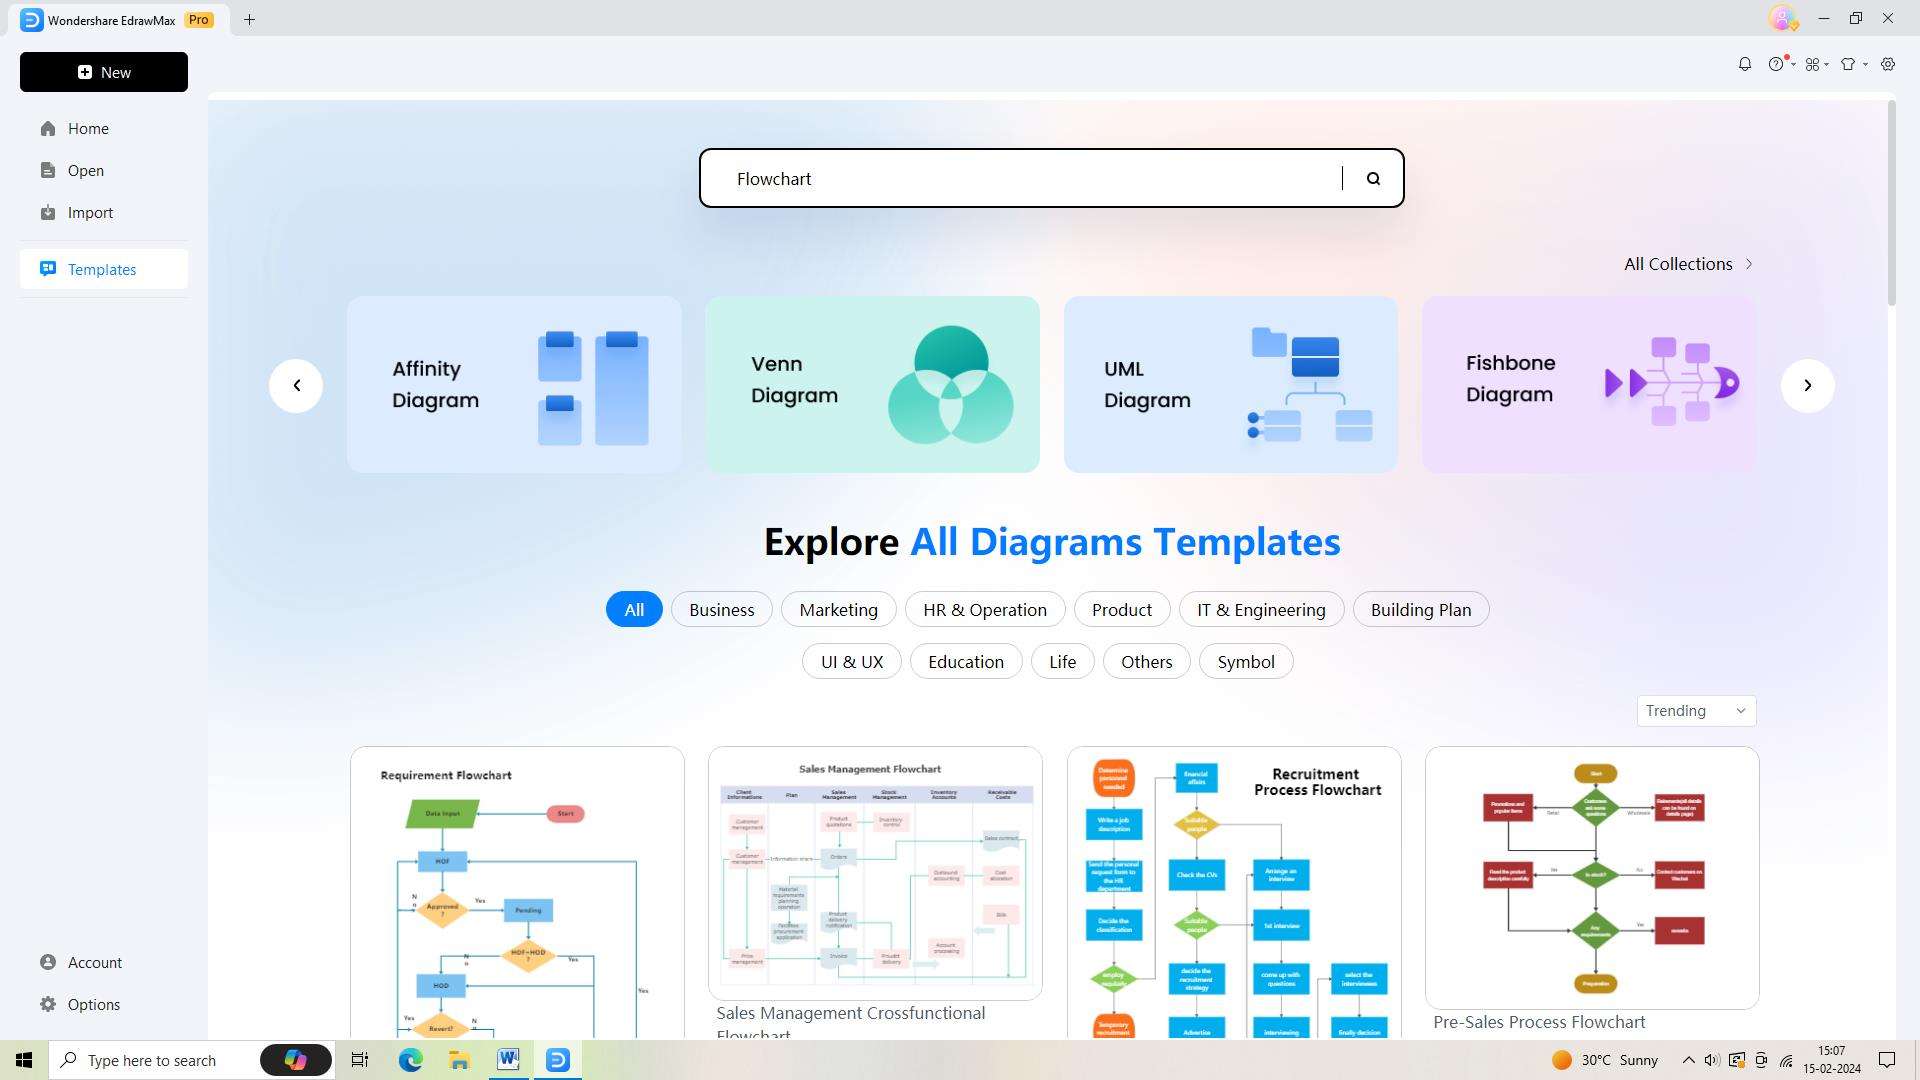
Step 3: Proceed to the template section by selecting the "Templates" tab located in the left sidebar. Press Enter after typing "Flowchart" into the search field. A selection of flowchart templates will be shown by EdrawMax. Select the one that best fits your requirements, then click it to open it.
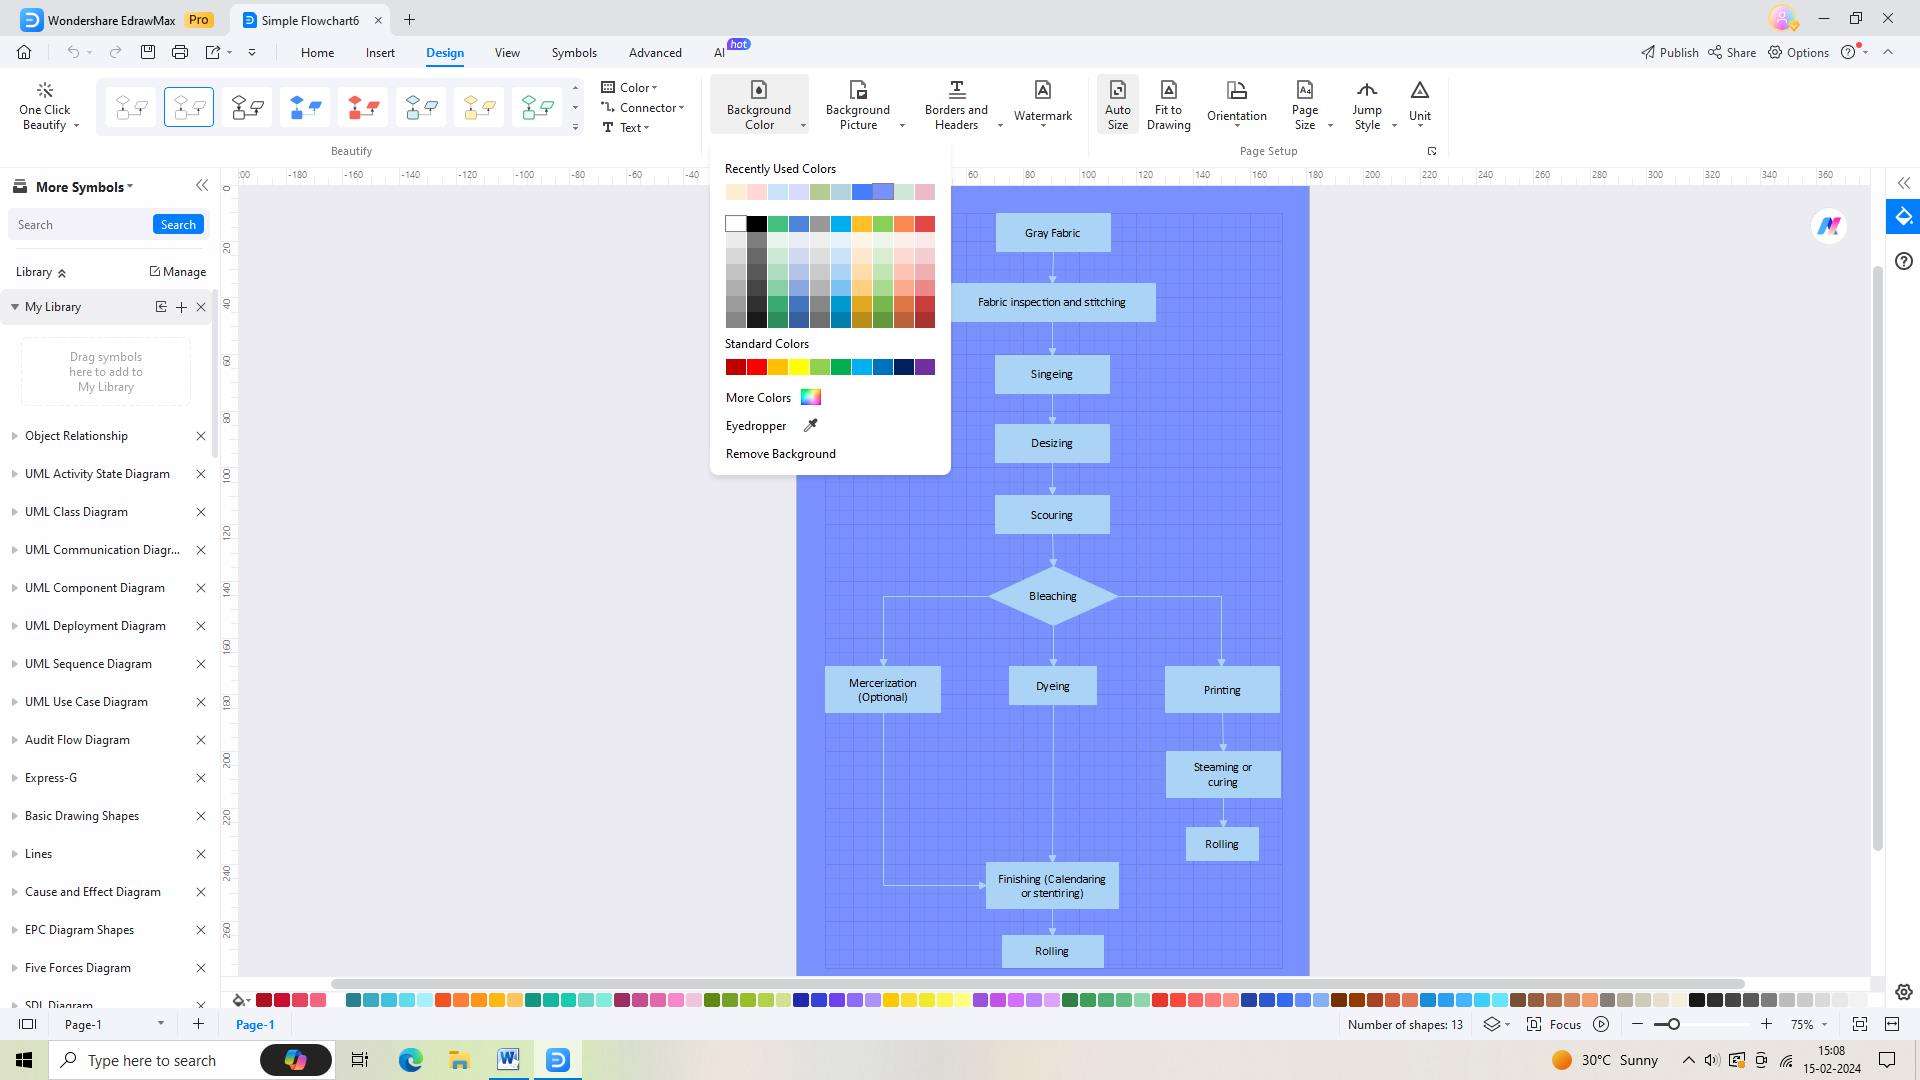
Step 4: Now that you have the template open, you need to modify it to fit your needs. You may alter the fonts, colors, and styles to fit the look you want.
Step 5: Save your flowchart as soon as you're happy with the modifications. Select the "Save" button from the upper toolbar. Choose a place for your flowchart to be saved on your computer or in cloud storage and give it a name.

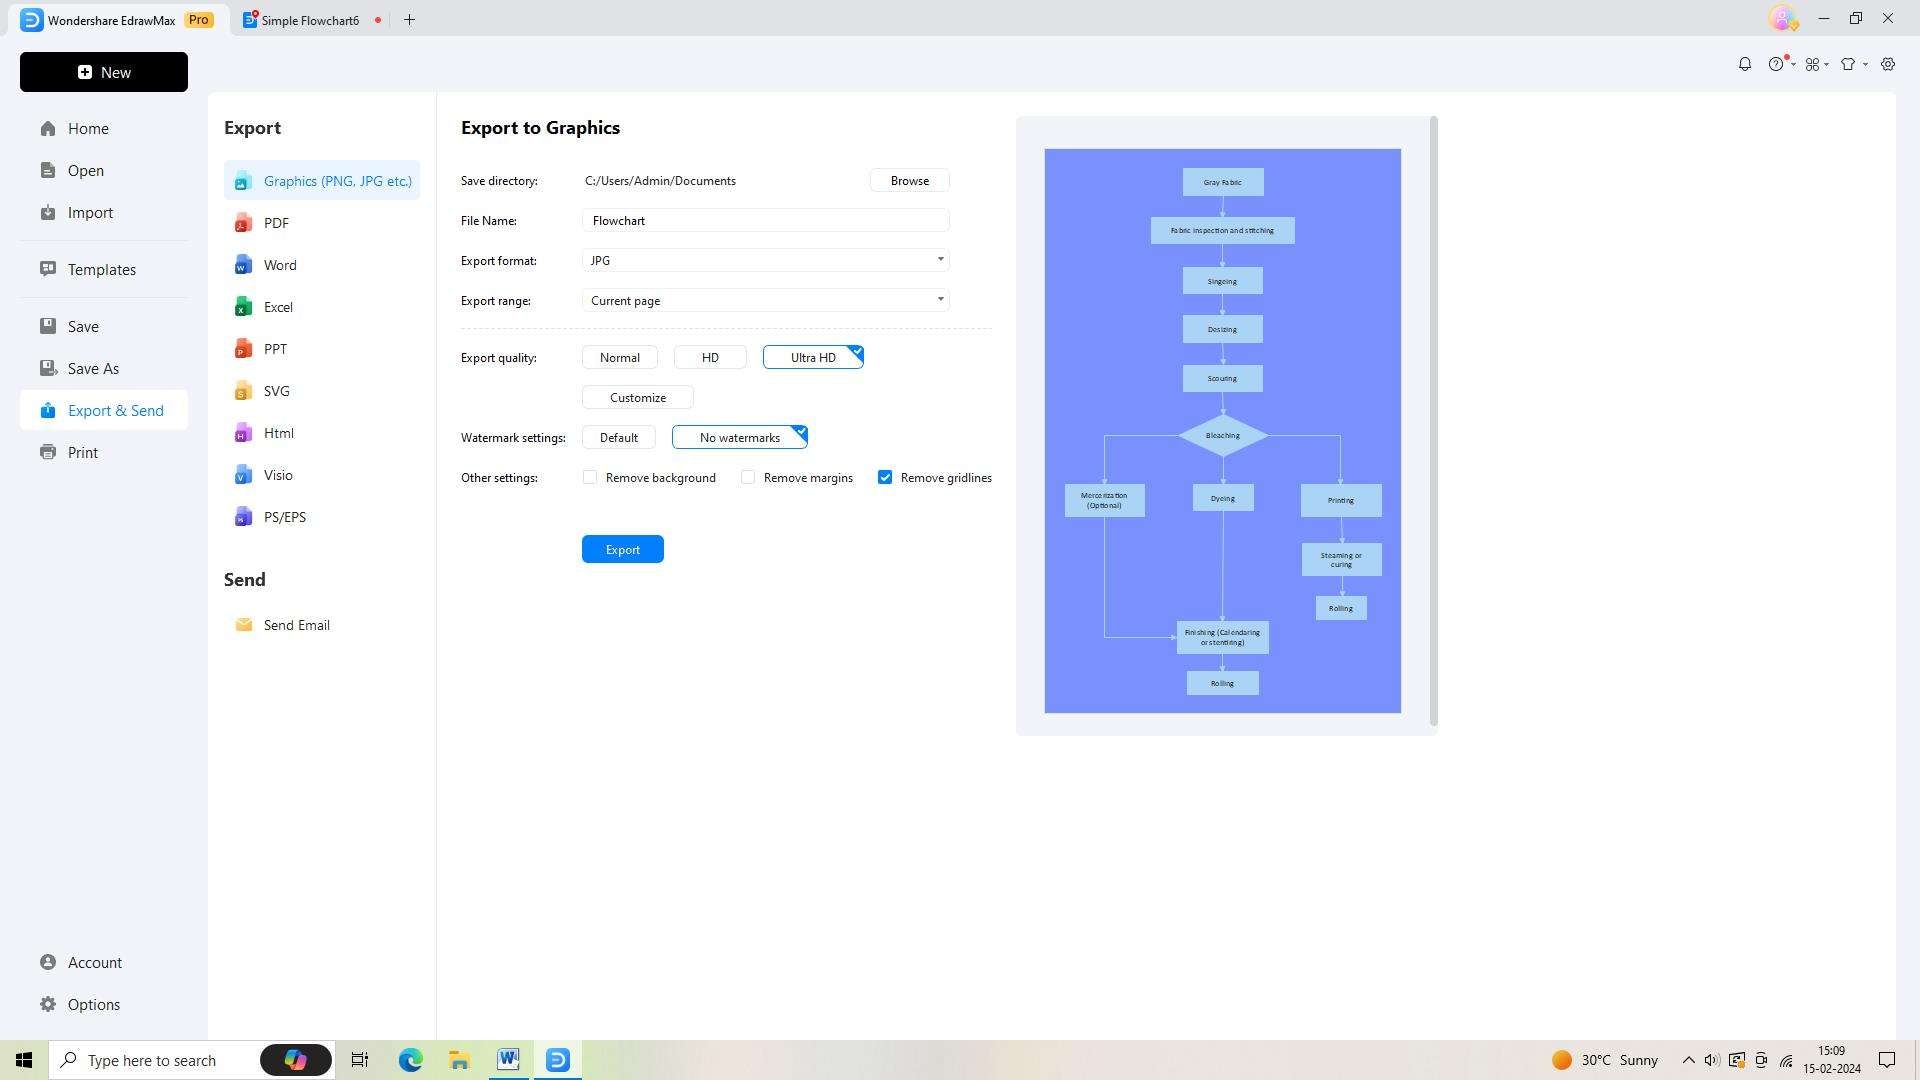
Step 6: You'll need to export your flowchart in order to share or utilize it outside of EdrawMax. In the top toolbar, click the "Export" button and select the desired file format.
Conclusion
Creating graphs in Visio offers numerous advantages, including a user-friendly interface, diverse graph types, and effective tips and best practices for Visio graph creation. By utlizing these features, users can produce visually compelling and informative graphs and process flow diagrams to effectively communicate data and information.

