


LaTeX is a powerful typesetting system widely used for academic and scientific documents. Creating diagrams in LaTeX, especially with TikZ, can be challenging for beginners. While it's great for text formatting and equations, its syntax-heavy nature can slow down productivity.
That’s why many users turn to Wondershare EdrawMax. The platform is a more visual, beginner-friendly diagram tool that works with LaTeX through image exports. Let’s get started!
In this article
Basics of Creating Diagrams in LaTeX
In this section, we’ll break down the basics to help you start drawing diagrams using LaTeX, focusing on the most popular package: TikZ
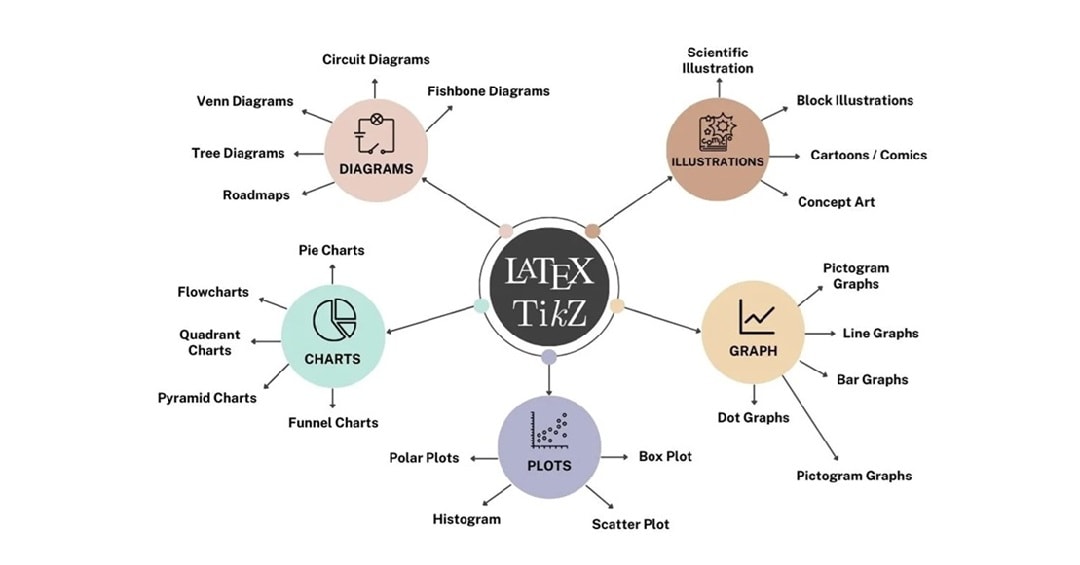
What is TikZ
TikZ is a powerful tool for creating graphics directly within your LaTeX document. It designs everything from simple shapes to complex illustrations like circuit diagrams or geometric figures.TikZ uses a code-based system where each element, such as shapes, lines, and labels, must be specified with commands.
Basic Steps of Creating Diagrams
Step 1Include the TikZ package
Add the following line in the preamble of your LaTeX document:
\usepackage{tikz}
Step 2Create a TikZ picture environment
All your drawing commands will go inside this environment:
\begin{tikzpicture} % Drawing commands go here \end{tikzpicture}
Step 3Basic Drawing Commands
- Lines: Use the \draw command followed by coordinates connected by --
\draw (0,0) -- (2,0); % Draws a horizontal line from (0,0) to (2,0)
- Rectangle:
\draw (0,0) rectangle (2,1); % Draws a rectangle with corners at (0,0) and (2,1)
- circle:
\draw (1,1) circle (0.5); % Draws a circle centered at (1,1) with radius 0.5
- Nodes: Use the \node command to place text or shapes at specific coordinates.
\node at (1,0.5) {Hello}; % Places the text "Hello" at (1,0.5) \node[draw, circle] at (0,0) {A}; % Draws a circle with "A" inside at (0,0)
Step 4Customize
Here’s how you can draw a simple square using TikZ:
\documentclass{article}
\usepackage{tikz}
\begin{document}
\begin{tikzpicture}
\draw (0,0) -- (4,0) -- (4,4) -- (0,4) -- (0,0);
\end{tikzpicture}
\end{document}

This snippet draws a square by specifying coordinates. Every element must be defined through code, including shapes, positions, and labels.
The document must be compiled—typically with PDFLaTeX or XeLaTeX if you want to view the output.
This process generates a PDF showing your diagram. However, without real-time previews, users must compile the file repeatedly to check adjustments. For many, this back-and-forth makes LaTeX diagramming time-consuming, especially for complex figures.
Limitations of Drawing in LaTeX Manually
While LaTeX’s TikZ packages offer powerful diagramming capabilities, they also present several limitis:
- Steep learning curve: Needs understanding of TikZ commands, coordinates, and LaTeX structure.
- No real-time preview: You must compile the document repeatedly to see your changes.
- Trial-and-error workflow: Positioning elements often takes many attempts.
- Hard to modify visuals: Editing complex diagrams means changing lines of code manually.
- Time-consuming for beginners: Simple tasks can take much longer than with visual tools.
These challenges can make LaTeX diagramming inefficient and overwhelming, especially for those who are new to the platform or need to create diagrams quickly.
Draw Easily With Wondershare EdrawMax
Why wrestle with TikZ code when you can create beautiful, LaTeX-ready diagrams in minutes using Wondershare EdrawMax? It uses a drag-and-drop interface, built-in templates, and export options. The platform is a smarter, faster solution for students, researchers, and professionals alike.
EdrawMax will show you a faster, visual way, and it is perfect for beginners and non-coders.
In the next section, you’ll get to know how to use EdrawMax to create diagrams. Also, learn how to export them for use in your LaTeX documents.
How To Use EdrawMax To Create Diagrams for LaTeX
If you’re looking for a more intuitive and efficient solution, EdrawMax is the perfect alternative. It provides a visual, drag-and-drop interface that allows you to create diagrams effortlessly. Once your diagram is ready, you can export it in a LaTeX-compatible format (SVG or PNG) for seamless integration into your LaTeX document.
Here is the step-by-step guide to using EdrawMax:
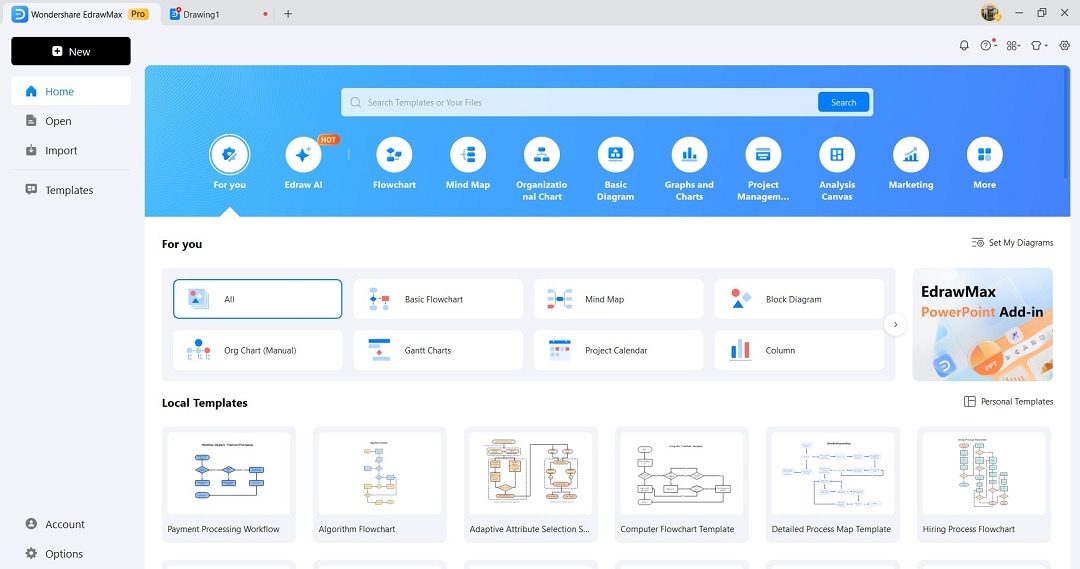
Step 1 Launch EdrawMax
- Download and install EdrawMax on your computer, or just try it online.
- Launch the tool and log in or register a Wondershare account.
- Click + New and choose Blank Drawing or from a template.
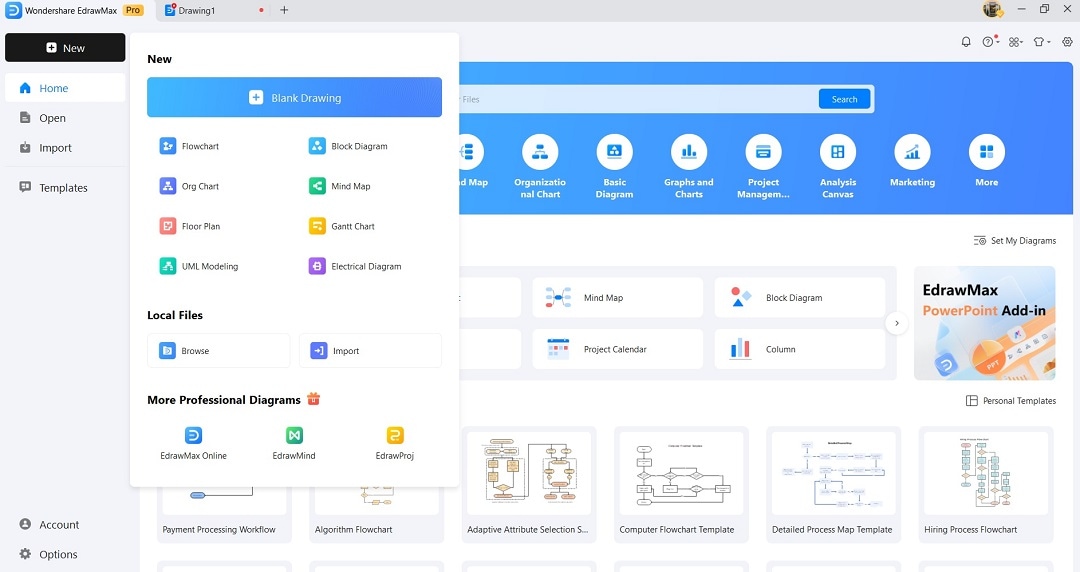
Step 2 Pick Favotite Template
If you’re using a template,
- Choose “Flowchart,” “Mind Map,” or “Block Diagram” depending on your needs.
- Wait for EdrawMax to transport you to the editing window.
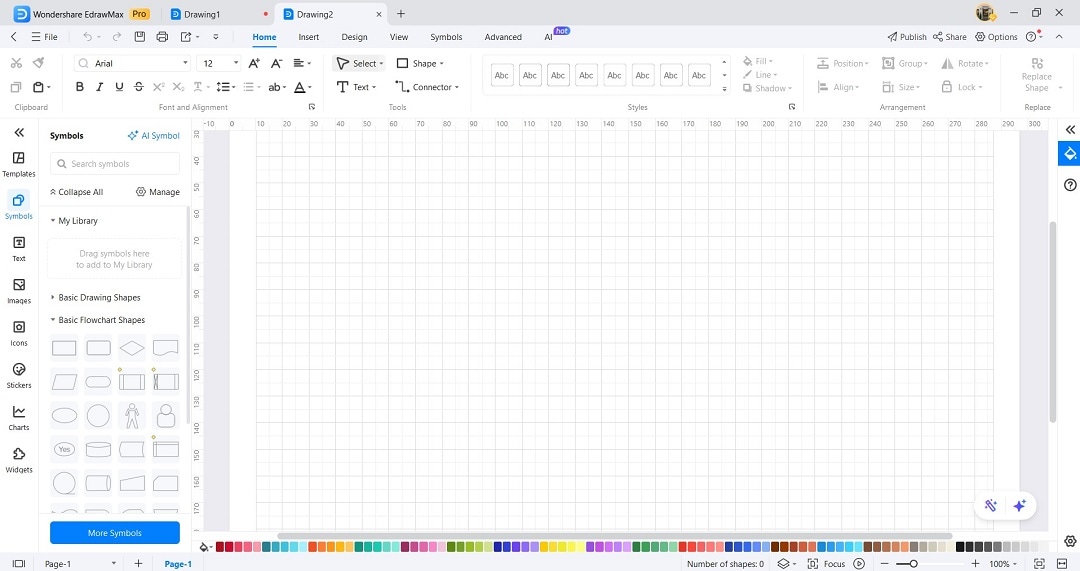
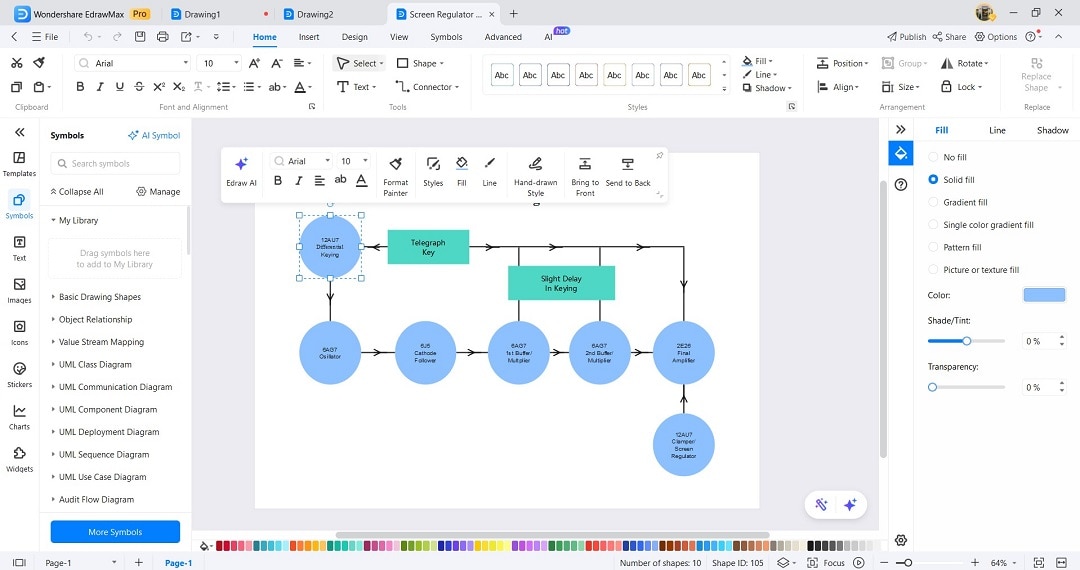
Step 3Use Drag-and-Drop Editing
- Add shapes, arrows, labels, and icons just by dragging them onto the canvas.
- Position and customize them using the alignment guides and style tools.
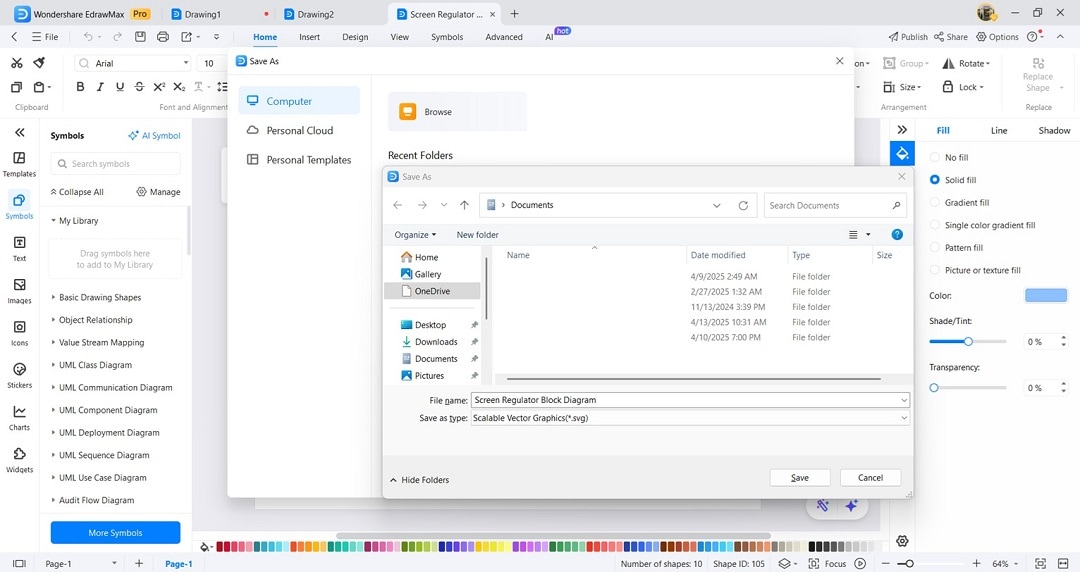
Step 4Export Your File
Once your diagram is ready,
- go to File > Export > Export As.
- Choose SVG (best for LaTeX with \includegraphics) or PNG.
Step 5Insert in LaTeX
In your LaTeX document, include the diagram using:
\usepackage{graphicx}

\includegraphics[width=\linewidth]{your-diagram.svg}
You get pixel-perfect diagrams without touching code. Plus, edits take seconds instead of minutes. Whether you're a student, researcher, or engineer, EdrawMax lets you focus on your content instead of syntax.
Conclusion
LaTeX remains the gold standard for technical documents, and tools like TikZ offer deep customization. However, for those seeking a faster, more intuitive workflow, EdrawMax is a game-changer.
EdrawMax’s visual editing interface and LaTeX-compatible exports make it the perfect companion for creating diagrams in LaTeX. The platform is intuitive and is ideal for beginners or anyone short on time. What are you waiting for? Try EdrawMax now and draw simple diagrams in seconds!
AI Diagram Generator
Enter your prompt. Upload files if needed. Generate diagrams, charts, or slides instantly.


