


My first Textografo diagram took 90 seconds to create. I typed syntax like code, and a flowchart rendered instantly.
But by my fifth project, the cracks began to show. Textografo struggled with features like custom colors for brand guidelines. But EdrawMax did it even more than that with high speed and control.
This Textografo review breaks down what I learned testing it for real projects and why EdrawMax became my default tool for all my diagramming needs.
In this article
What Is Textografo and What Can It Do
Diagram with Syntax
Textografo lets you create diagrams through textual syntax instead of drawing shapes. You write code, and it turns them into flowcharts, mind maps, organigram, etc.
Team-Friendly Workspace
Everything happens online. Edits, notes, and revisions appear instantly across all users. A shared dashboard keeps version control transparent and simple.
What Makes It Useful
Textografo offers syntax-based rendering, shared folders, quick exports, and smooth embedding. Because it's syntax-driven, you can make changes instantly without adjusting shapes manually.
Plan Options
Textografo offers various plans with a 7-day free trial:
- Essentials Monthly: $5
- Premium Monthly: $19
- Essentials Yearly: $48
- Premium Yearly: $168
How to Set Up Textografo
Opening Textografo felt lightweight. The signup took me less than two minutes, no download or plugin needed.
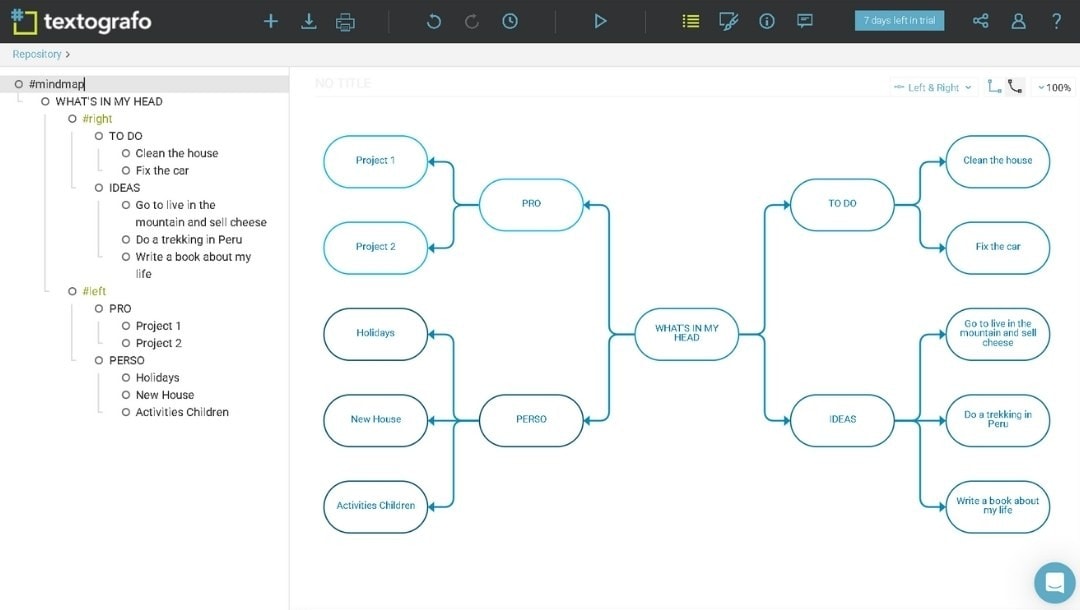
The dashboard has only two main areas: a left vertical menu for syntax and settings, and the right side shows the rendered diagram.
There's no free-form drawing canvas; I write text like "#start → #process → #end" and the system draws it right there.
Above the editor are buttons for themes, zoom, embed, and sharing. The theme switcher lets me change color palettes instantly.
I was struck by how minimal it is. There's no clutter, only what's essential: syntax panel, preview toggle, and diagram controls.
There's a learning curve around nested diagrams and indentation-based structure.
Overall, the setup is almost effortless. The lack of typical visual controls makes it feel unusual, but the design keeps your attention on the content. For users comfortable with editing text syntax, it's a refreshing take.
How to Create a Diagram in Textografo
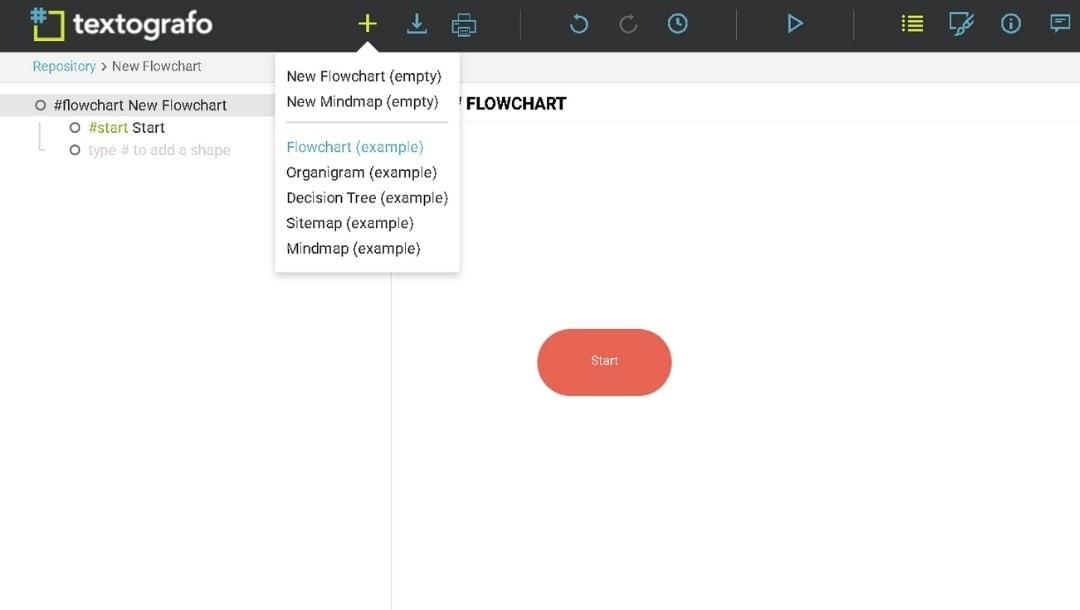
Step1 Launch a New Diagram
- Open Textografo and click the + Create chart button on the main bar menu.
- A dropdown menu appears with diagram type options.
- Select Flowchart (example) or any other from the list of available diagram types.
- The top toolbar contains icon options like save as, export, print, undo, redo, version history, theme pane, share button, etc.
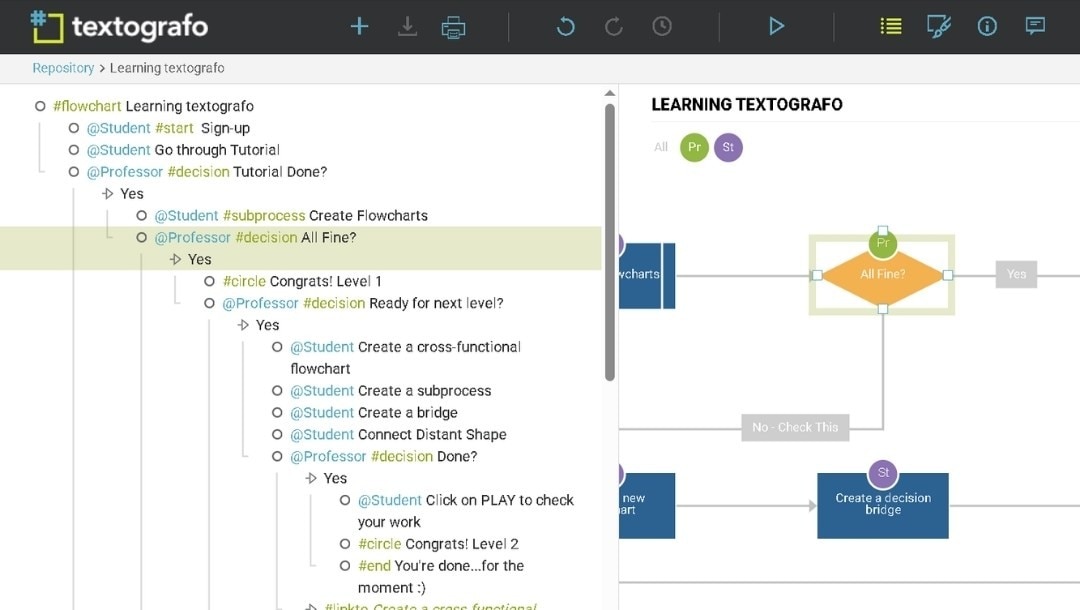
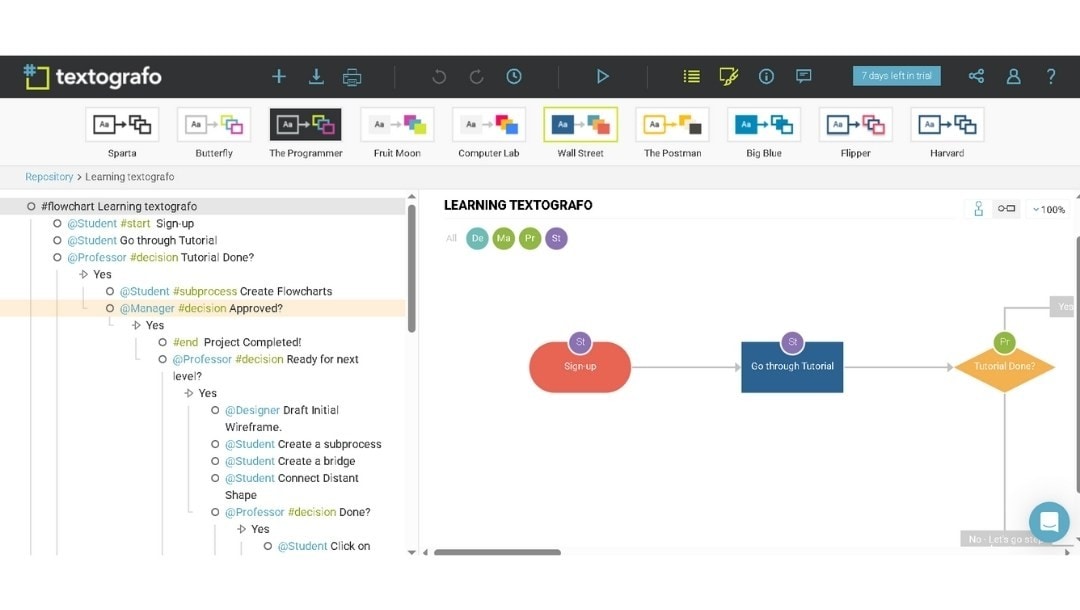
Step2 Understand the Template Structure
Each line in the template defines an element or connection.
Here's how to read it:
- @Student or @Professor = Actor or swimlane (who performs the action)
- #subprocess, #decision, #circle, #end, #linkto = Shape types or flow actions
- Indentation = Hierarchy or flow sequence
- Text after each tag = Node name or instruction
- Example: @Professor #decision All Fine? Creates a decision diamond labeled "All Fine?" under the "Professor" swimlane.
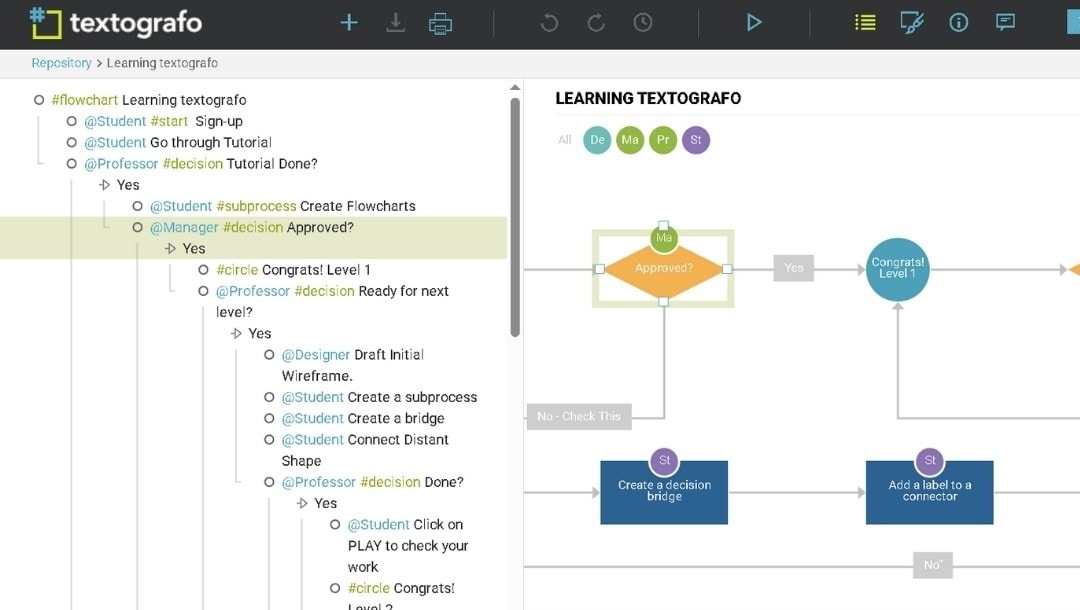
Step3 Edit Text and Labels
- Click inside the text editor (left panel).
- Change the existing labels or instructions to fit your process.
- Example: Replace @Student Create Flowcharts with @Designer Draft Initial Wireframe.
- Modify decision text directly: @Professor #decision All Fine? → @Manager #decision Approved?
- Keep indentation consistent, as it defines which step follows which.
Step4 Add or Remove Steps
To add a step, copy an existing block and adjust the label:
- @Student Create Flowcharts
- @Reviewer #decision needs revision?
- Yes
- @Student update diagram
- No
- #circle approved!
- Yes
To remove a step, delete the corresponding lines. The preview updates automatically.
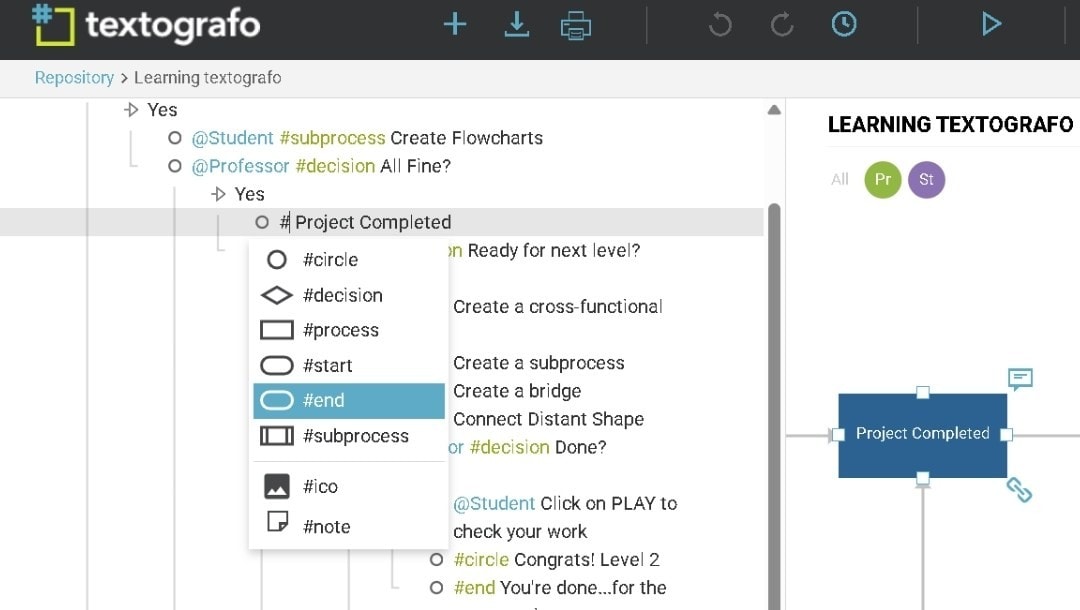
Step5 Change Shape Types
Textografo lets you switch shapes by editing the hashtags:
- #subprocess → process step
- #decision → diamond decision node
- #circle → milestone or result
- #end → flow ending
- #linkto → connector to another section
Example: Change #circle Congrats! Level 1 → #end Project Completed!
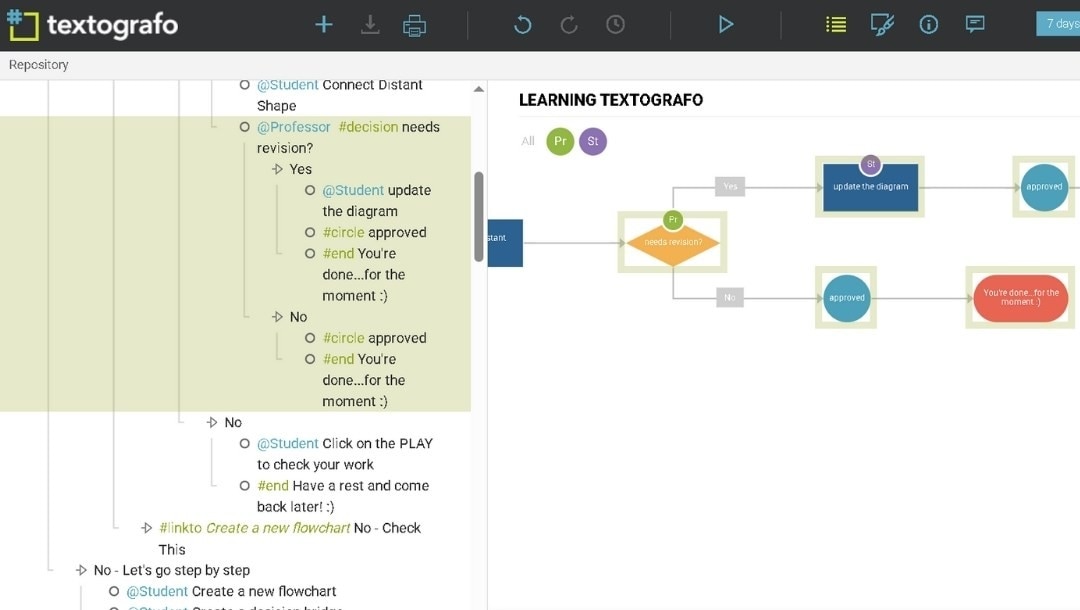
Step6 Use Links and Branches
#linkto connects related parts of the diagram. Example: #linkto Create a new flowchart No - Check This
It means if the answer is "No," the flow jumps to the "Create a new flowchart" node.
You can rename or redirect links by changing the target text after #linkto.
Step7 Adjust Actors and Hierarchy
To rename an actor: @Student → @Designer
To add a new actor/swimlane:
- @Developer #subprocess Implement Logic
- @Tester #decision Passed QA?
Use indentation for nested steps (like "Yes" or "No" paths).
To promote or demote a node, adjust indentation using Tab or Shift+Tab.
Step8 Preview and Fine-Tune The Layout
Watch the right panel. Every edit updates instantly.
Use toolbar options to:
- Zoom in/out
- Change orientation (vertical or horizontal)
- Apply a theme (Default, Ocean, Forest, Corporate)
Right-click nodes to highlight or recolor important parts.
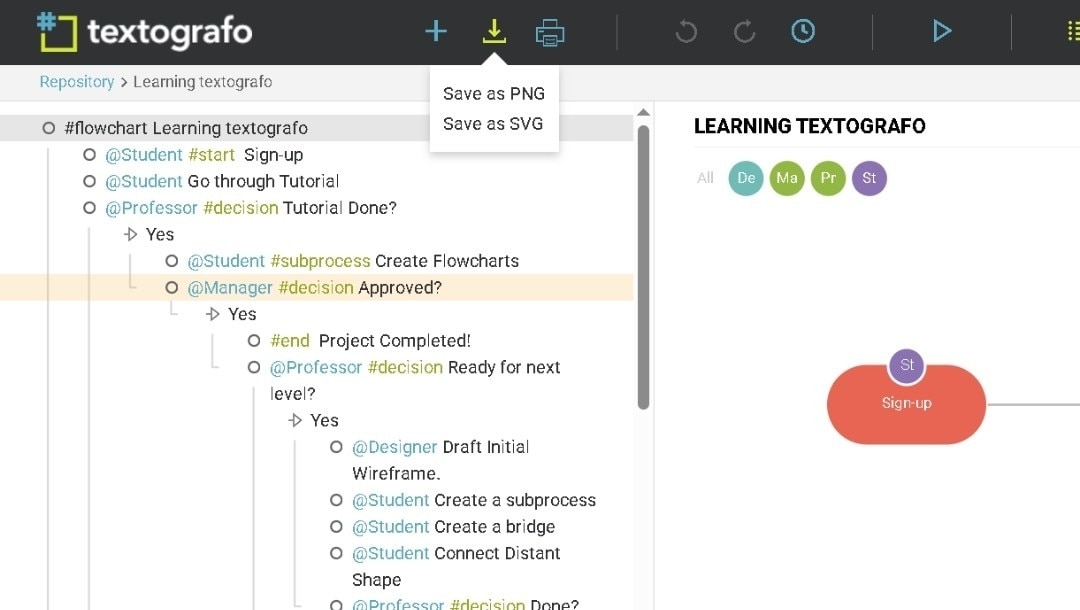
Step9 Export, or Share
When your diagram is ready:
Click the Download icon.
Choose a format: SVG or PNG.
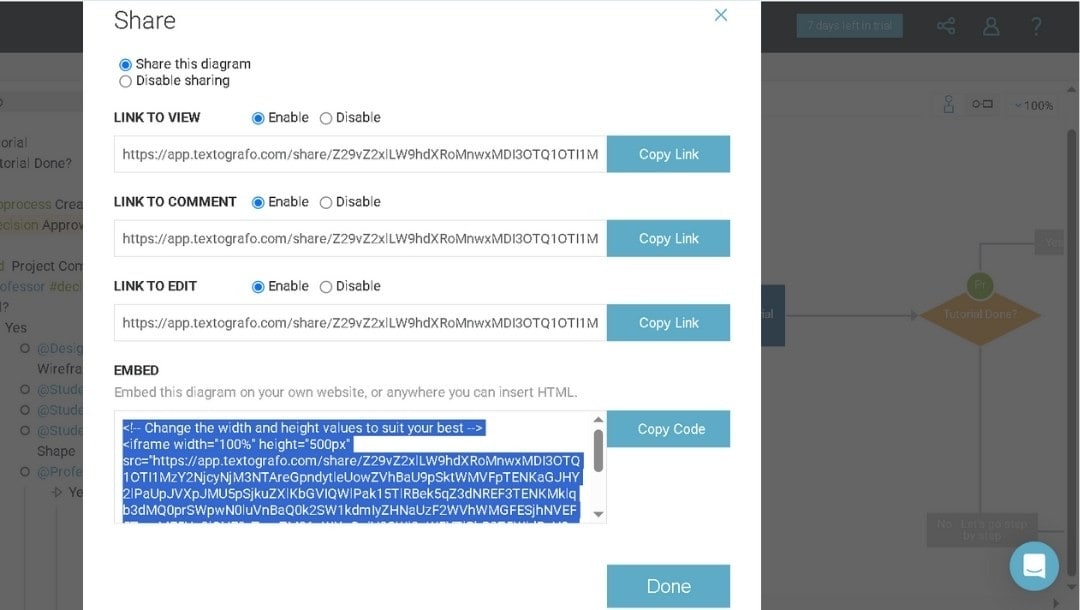
Click the Share icon to generate a view or edit link.
Tap on the Copy Code to copy the embed code if you want to insert it into a webpage or wiki.
My Experience Using Textografo
What Worked Well
The immediate conversion loop kept me engaged. Type a line, and see the diagram update. This tight feedback made iterating feel natural. I experimented more because changes were instantly reversible.
Textografo's collaborative features supported asynchronous work. Team members in different time zones added their sections without waiting for me. In the morning, I saw a completed diagram that three people built across 12 hours.
The simplicity removed decision fatigue. No font choices, limited color options, standard layouts. This might sound limiting, but I could focus on content. I finished diagrams faster because I didn't have to tweak visual details.
Searchability across diagrams was powerful. The workspace search found text within any diagram. When someone mentioned a process name, I instantly located which diagram contained it. It was a better alternative to searching through folders of image files.
The lightweight nature meant zero performance issues. I created diagrams with 100+ nodes without lag. Heavy visual tools sometimes crashed with complex diagrams; Textografo stayed responsive.
What Felt Restrictive
Textografo struggled with handling free-form annotations. I wanted to add explanatory text boxes outside the main flow, but the syntax forced everything into structured positions. This limited how I conveyed context.
Exporting diagrams for print required extra work. Margins, page breaks, and scaling can't be controlled. I often copied diagrams into other tools just to format them properly for printed reports.
The lack of image embedding was noticeable. I wanted to include screenshots or photos within diagrams for context. Textografo only supported basic icons, not custom images.
Overall Feel
Textografo works best when you embrace its constraints. Fighting against the text-based paradigm creates frustration. Accepting it as a different approach reveals its strengths.
I found it most valuable for living documentation, particularly diagrams that are frequently updated. The text format made updates trivial. For static diagrams that rarely change, the benefits were less compelling.
It's a tool that rewards a specific workflow. If that workflow matches yours, you'll love it. If not, it'll feel limiting.
Get the Most Out of Textografo
Know the basics first. Spend a few minutes with the syntax guide before you start. Two-space indentation and don't mix tabs, that’s the golden rule. Start small to avoid syntax headaches later.
Check your exports. Before finalizing, try out different export formats. SVG and PNG are ideal for digital sharing, while PDF offers the best print quality. Always zoom in to check details.
Reuse what works. Create templates for diagrams you often use. It’s a simple trick that saves a ton of time.
Use shortcuts smartly. Learn the ones you’ll use most. For example, Ctrl+F helps you jump straight to what you wanna change.
Be neat with syntax. Always maintain indentation and syntax format. One misplaced symbol can break everything.
Master these habits and you’ll work faster, more professionally, and with greater confidence in Textografo.
What Makes EdrawMax a Better Alternative to Textografo
I ran into a few roadblocks with Textografo, but EdrawMax fixes them all.
- With Textografo, even a single syntax error can ruin the entire diagram. In EdrawMax, everything’s visual; you click, drag, and build without touching code. There's even an AI text-to-diagram feature that instantly turns your ideas into visuals.
- Textografo also locks you to an internet connection. EdrawMax doesn't. I've made edits offline on my laptop.
- For diagram variety, Textografo feels limited. EdrawMax covers over 210 diagram types, offers 15,000+ templates, and still feels beginner-friendly.
- Exporting is another plus; you can save in multiple formats with high precision.
- And if you’ve got old Visio files, no worries. EdrawMax handles them natively, import or export anytime.
3 Different Ways to Create a Diagram in EdrawMax
In EdrawMax, you can build your diagram in three easy ways:
- Use a template: Browse categories, pick one that fits, and tweak the details. The structure is already set up for you.
- Try the AI: Type a prompt or short code, and the AI instantly creates your diagram. You can edit it visually afterwards for a polished look.
- Go blank: If you like starting fresh, open a blank canvas and design freely using guides and grouping tools.
Textografo vs EdrawMax: A Quick Comparison
Here’s a table comparing both tools at a glance:
| Feature | Textografo | EdrawMax |
|---|---|---|
| Diagram Creation | Text syntax-based | Visual drag-and-drop + AI + Templates |
| Templates | Basic library | 15,000+ professional templates |
| Diagram Types | ~20 common types | 210+ including specialized diagrams |
| Collaboration | Shared editing, version history | Cloud sharing, comments, team permissions, version control |
| AI Support | Syntax-to-diagram conversion | Natural language AI generation + optimization and more |
| Best For | Developers, text-oriented workflows | All users, all industries, complex projects |
Wrap-Up
Textografo keeps things simple for coders, but once you hit its syntax limits, creativity stalls. EdrawMax outperforms it.
You can create diagrams from text or data, tweak visuals to perfection, and mix AI with manual editing.
Whatever you’re mapping, EdrawMax makes it smooth and professional.
AI Diagram Generator
Enter your prompt. Upload files if needed. Generate diagrams, charts, or slides instantly.


