


When multiple teams contribute to the same product, communication gaps appear quickly. One group may discuss users, another focuses on services, while others think of APIs. C4 model examples solve this issue. It divides system design into four layers. On assessing various C4 diagram examples, you will know how companies simplify complex systems and exchange ideas easily.
The C4 model examples also point out the strength of layering. They offer a uniform method of representing systems within the industries and project domains. Moving on, we will talk about the four levels in a C4 diagram. We will present some examples, discuss how to make diagrams in EdrawMax, and show you why developers rely on this approach.
Let’s get to it!
In this article
The C4 Model in Simple Terms
These four levels form the backbone of the C4 model. This step-by-step approach allows teams to describe systems without getting confused in the details. The layers provide a clarity that simplifies complicated designs.
Context (C1)
The most general stance is level 1. It exhibits who gets access to the system and which other systems are attached to it. This level is not about details. It is concerned with exhibiting associations among individuals, tools, and frameworks. It assists the teams in defining the mission of a system without pointing out technical sections.
Container (C2)
The second level is concerned with databases, applications, and services. Every container is a building block of the system. Containers can be a web app, a mobile app, or an API service. This level describes the interaction of these containers and the data flow among them. It is particularly handy in the case of architects who design the connectivity of services.
Component (C3)
The third level peeks into a single container. It demonstrates which components are running the container. The components can be modules, libraries, or microservices. This perspective assists developers in knowing what is required within a container. It helps visualize how tasks are partitioned. It also demonstrates the way these components are connected.
Code (C4)
The last level is optional. It magnifies classes and approaches. This is not required on every project. However, when code-level detail matters, this view allows the new developer to learn more quickly. It adds accuracy to designs, although it must be applied when it is necessary.
Top 5 C4 Model Diagram Examples
Here are some key factors to look for while searching for a flawless C4 diagram tool:
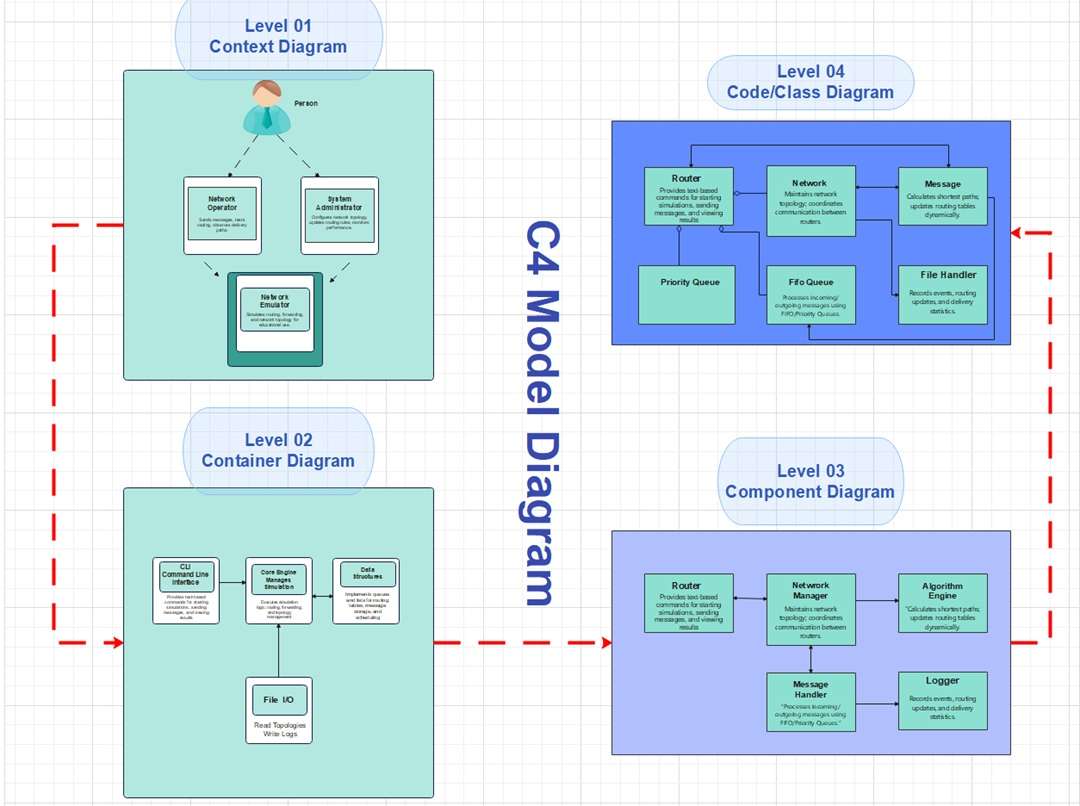
Network Simulation C4 Model Diagram
This C4 represents an end-to-end mapping of a network simulator. Context indicates a person, a network operator, and a system administrator using the emulator. Container lists CLI, core engine manager, and file I/O. Component displays router, network manager, and logger. Finally, the code view highlights queues, handlers, and message flow. Together, they clarify how simulations are managed and executed.
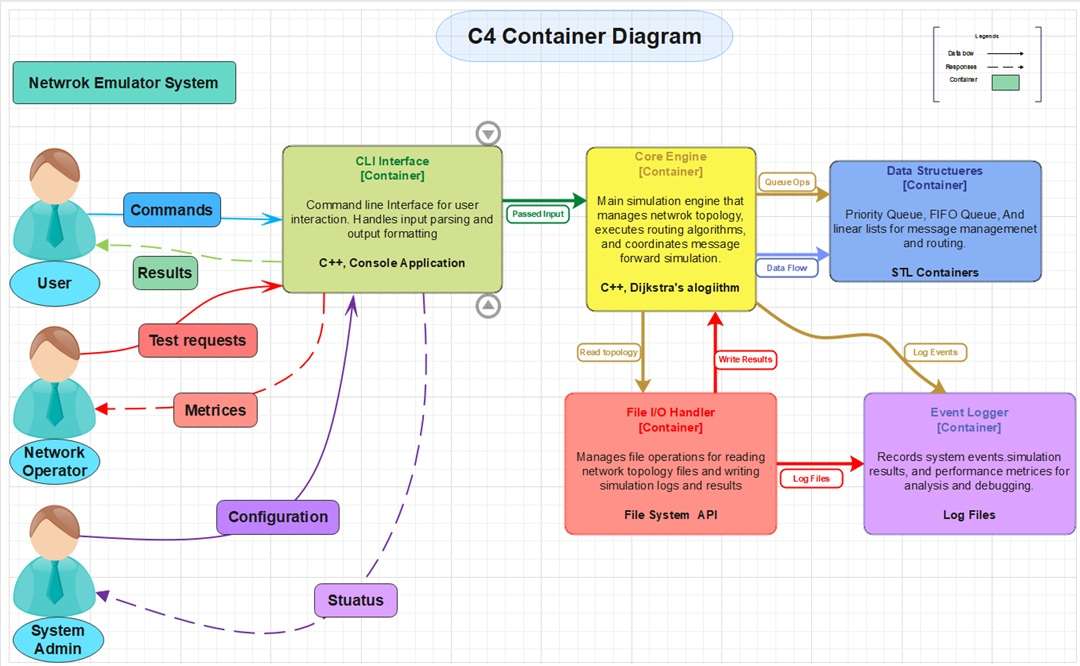
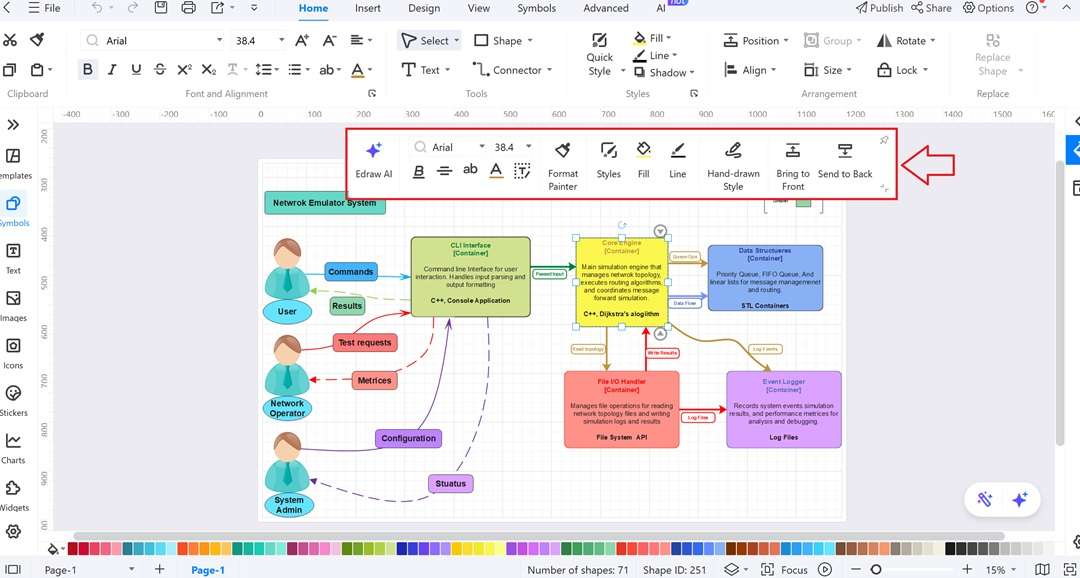
Network Emulator Container View Diagram
This diagram describes the organization of a network emulator system on a container level. CLI Interface executes input and output formatting. The Core Engine performs routing algorithms and organizes the simulation. Topology files and logs are processed by the File I/O. Handler and system events and metrics are recorded by the Event Logger.
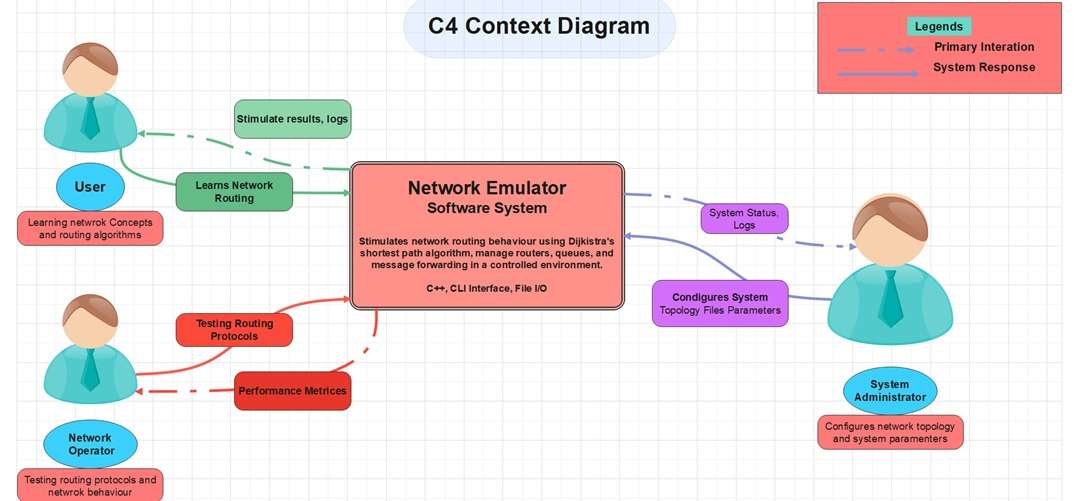
Network Emulator Context View
This context diagram illustrates the interaction between various roles and the emulator. The User investigates the principle of routing and obtains the observations of logs. The Network Operator is concerned with protocol testing and behavioral monitoring of the system. The Network Emulator is the heart. It coordinates the simulation process. Moreover, it handles queues, routers, and controlled message forwarding.
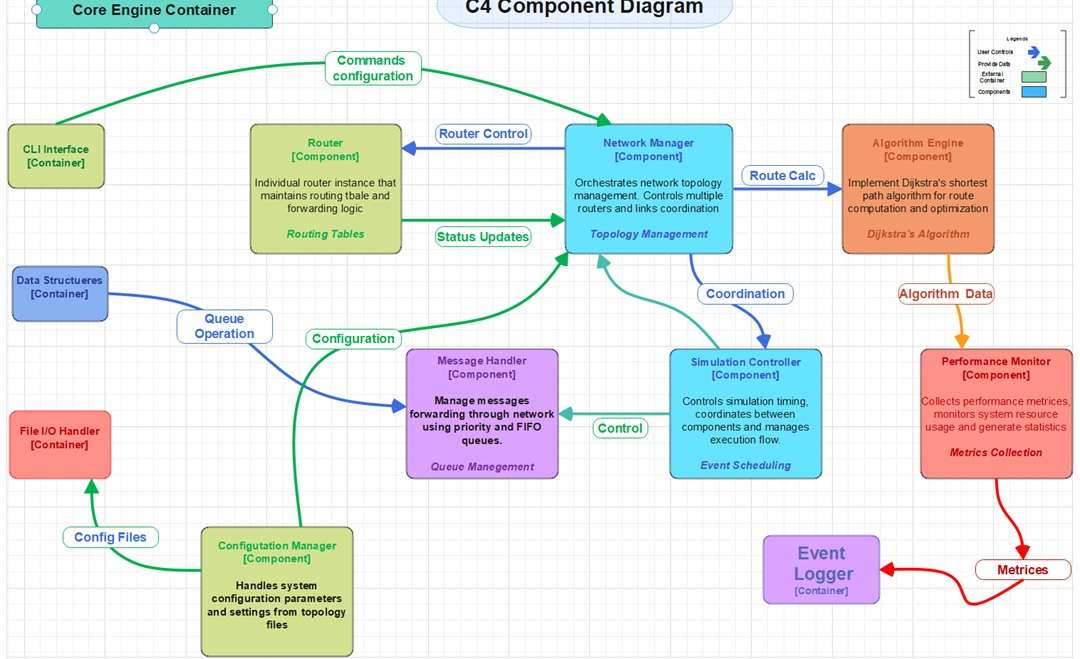
Performance Monitoring Component Diagram
This component diagram describes the modules that ensure the emulator is running. We can see the forwarding logic in the Router. Path computations are carried out on the Algorithm Engine. The Message Handler is used to organize data queues, and the Simulation Controller is used to control the execution flow. Lastly, there is the Event Logger that has activity records.
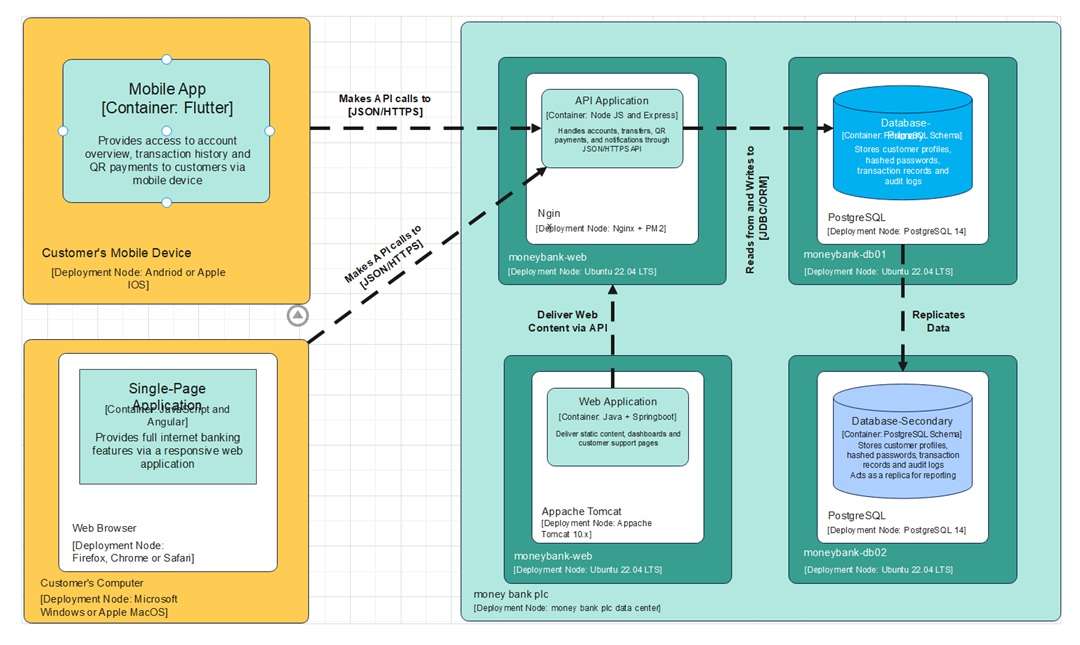
Online Banking System Deployment Diagram
This diagram depicts a mobile and web-constructed banking system. The Single-Page Application and the Mobile App provide the customers with access to their accounts and payment services. Transfers and notifications are handled by an API Application. Web Application lets you use dashboards. The information gets stored in a Primary Database to get backup and reporting in a Secondary Database.
How to Create Your Own C4 Diagram in EdrawMax
EdrawMax is more than just a one-trick drawing tool. It has a robust templates community with fruitful C4 diagrams. Drag-and-drop editor allows for inserting containers, components, and relationships. Each level of the C4 model can be tailored to your project by adding text, icons, and colors to suit your project.
With EdrawMax, you can share your diagram with your team to review. This helps them understand your POV. Furthermore, it lets you export your project in PDF, PNG, and even Visio. This makes it easy to integrate the diagrams into the report or presentation.
Now, let’s look at the steps to build a C4 diagram in EdrawMax.
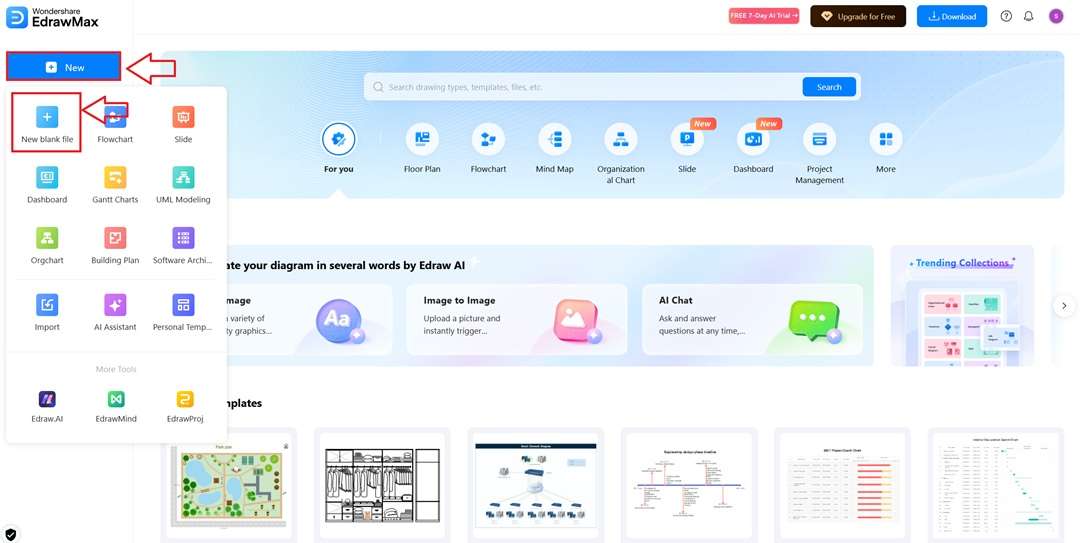
Step1 Start Working with a New File
Log in to EdrawMax with your Wondershare credentials.
Click on the New button. A dropdown menu will appear.
Select New Blank File. This option gives you a clean canvas.
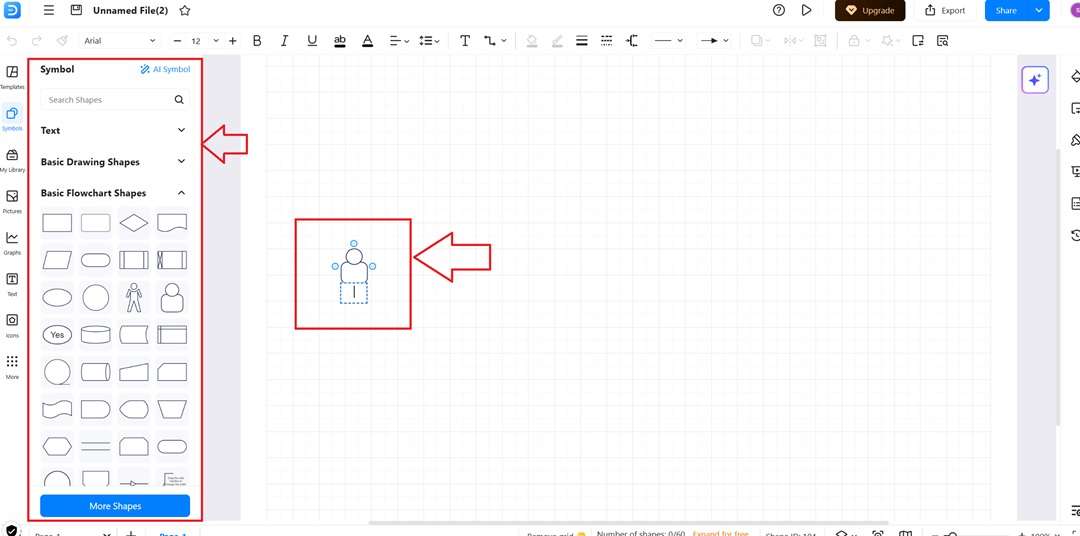
Step2 Add Shapes to the Canvas
From the left panel, select the shapes you need for your C4 diagram.
Drag and drop them onto the canvas. This way, you can place users, systems, or containers exactly where you want.
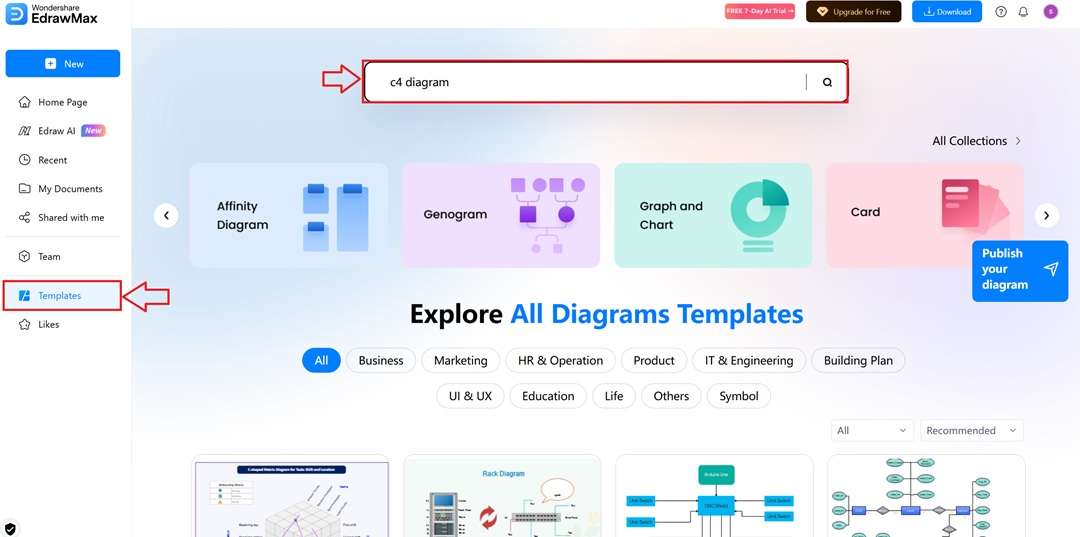
Step3 Pick Templates for Faster Work
Go to the Templates section on the left-hand panel. Use the search bar to browse C4 diagrams.
Pick a template that matches your project. Click Use Immediately to customize it instead of building everything from scratch.
Step4 Edit and Customize Your Diagram
Click on any object in the template. A floating bar will appear on it.
Use it to adjust text, colors, lines, and styles. You can resize shapes, change fonts, or apply fill options.
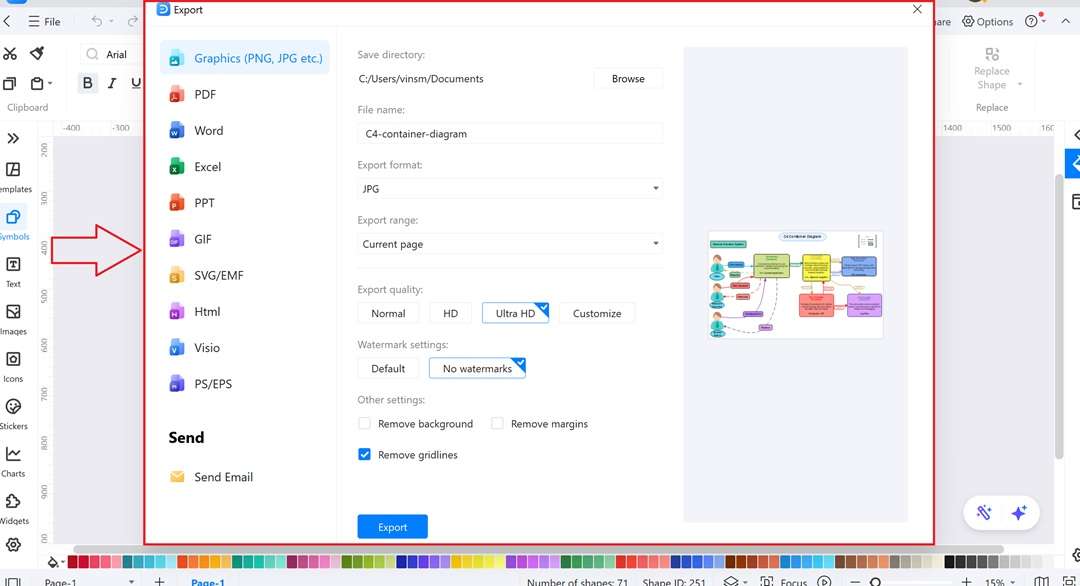
Step5 Download in Your Preferred Format
Go to the File option in the top-right corner. Click the Export option and choose the format you need.
You can select from PDF, PNG, PPT, and other available formats.
Why C4 Diagrams Are a Developer’s Best Friend
Now, let's talk about the ease that comes with C4 diagrams. They can slice through distraction, keep all members on track, and conserve time when it is needed. That is why developers continue referring to them as their secret advantage.
Crystal-Clear System Overview
The context layer provides the developers with an instant picture of the system. It displays the users, the external systems, and the flow of interactions. Teams are able to view the large picture within seconds as opposed to reading long documents. This will help you guys understand what the diagram is all about without going into the technical details.
Smarter Design and Debugging
Developers not only create with the help of C4 diagrams, but they also use them to correct problems. Diagrams are used to identify areas of problems by mapping relationships between components and containers. They save your time in the process of debugging and result in more dependable fixes.
Team Talk Turbocharged
It dismantles silos and brings common perceptions to your team. C4 diagrams serve as the lingua franca of devs, designers, and bosses. Everyone views the same configuration, both in general terms and in detail. With C4 diagrams, debates turn into quick nods. The plans synchronize, and projects are accelerated with no endless meetings.
Easy Integration With Tools and Workflows
C4 diagrams are not fixed to a particular format. They may be distributed in the form of pictures, included in the documentation, or exported into the project tools. Such flexibility makes sure that diagrams remain a part of daily work rather than being stored in a different file.
Wrapping Up
We’ve gone from context to code, and the pattern is clear. C4 diagrams reduce the complexity to what the team can work with. Rather than lengthy descriptions, now you can have a structure that demonstrates who consumes the system, how the services relate, and where the details are.
The C4 diagram examples that we investigated demonstrate that this model is applicable in industries. Looking at various C4 model examples, one can understand why layering is the way to clear things and achieve mutual understanding. And if you want the same ease in your work, EdrawMax provides templates, smooth editing, and simple export features to make building diagrams effortless.
Give EdrawMax a shot and see how it transforms your diagram creation journey!
AI Diagram Generator
Enter your prompt. Upload files if needed. Generate diagrams, charts, or slides instantly.


