


Any software system is a living system. Its pulse is dependent on servers, nodes, and data flows. This heartbeat is exposed in a C4 deployment diagram. It visualizes the location of code in the real environment. It tells how the individual containers are connected to hardware or virtual machines.
The C4 model deployment diagram takes it one step further by gathering containers and communication paths into a single map. It focuses on dependencies and areas of concern that require attention before the launch. In this article, we will get more details about the C4 deployment diagram, discuss its components, and how to create one in EdrawMax.
Here’s what you need to know next!
In this article
What Is a C4 Deployment Diagram
The C4 model allows teams to read software from a new perspective. It has four main layers.
- A context diagram indicates the system and its users.
- The Container diagram divides the system into containers for databases.
- The Component diagram defines what is inside each container.
- The Code diagram focuses on classes or functions.
Where Deployment Fits
There is one more layer in the C4 deployment diagram. It links the design and the real world. Whereas all the other diagrams emphasize logic and structure, this one describes the locations of actual code executions. It displays the deployment of containers within machines, servers, or in the cloud. This makes it crucial for system planning.
Showing the Infrastructure
A deployment chart is similar to a ground reality map of the system. It shows nodes, which may be physical or virtual machines. These nodes have containers that contain software. Lines depict the connection and flow of data between two nodes. They help engineers to identify vulnerable points and scale planning easily.
Core Pieces of a C4 Deployment Diagram
Each C4 deployment diagram comprises some building blocks. They all provide some detail that simplifies how the system is explained and handled. Let's break them down clearly.
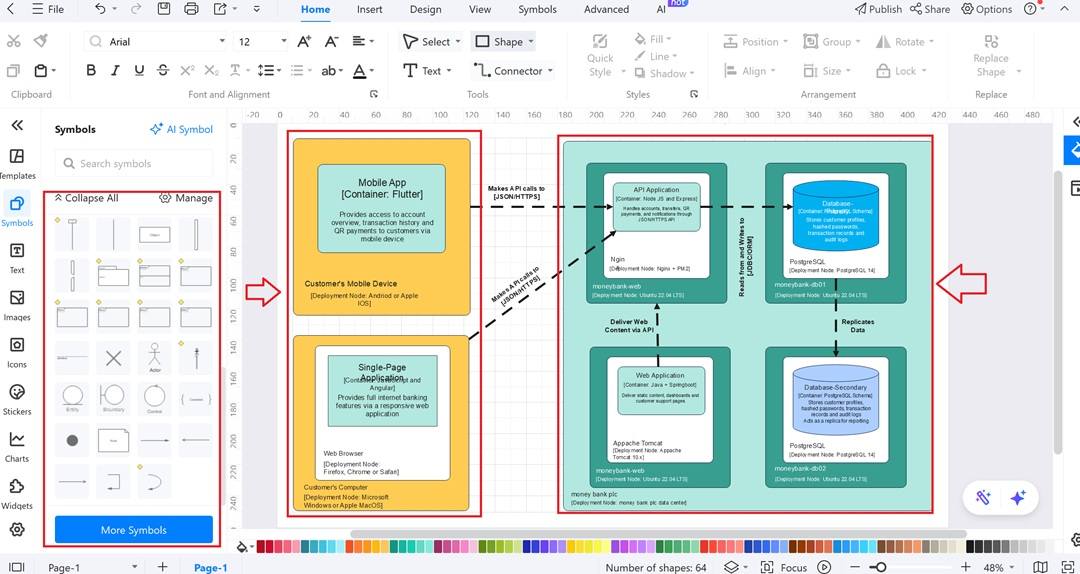
Nodes: The Ground Beneath Your Code
The C4 deployment diagram is based on nodes. They represent either physical servers, virtual machines, or cloud instances to which the applications are deployed. Having them there allows you to understand what environments your system depends on. It tells whether the system is dependent on an on-premise data center or a cloud provider.
Containers: The Actors on Stage
The software pieces that run on nodes are called containers. One container may be a web server. Another can be a nearby database. The containers have their own functions, similar to the parts of actors. They work in the node environment. The containers display what is running in your system. In their absence, nodes are mere blank stages.
Connections: The Wires of Communication
Nodes and containers are connected with the help of connections. A connection could be an HTTP call between servers or a database query between containers. They draw communication protocols or dependencies. These lines make the system hum. They demonstrate the way in which pieces speak in real time.
Boundaries: Drawing the Lines
Boundaries bring together nodes. One boundary is given to a production cluster. A staging setup gets another. They are fences on a map; they divide landscapes. Borders explain node locality. They assist teams in being setup-oriented. This classification eliminates confusion in rollouts. It is an easy method to maintain order.
Annotations: The Sticky Notes
Annotations bring a practical advantage to the diagram. They provide more context (such as IP addresses, software versions, or supported protocols). The absence of such notes can leave a diagram looking clean but with no data required to do real deployment work. A high-level sketch is annotated to form a guide for day-to-day operations.
Why C4 Deployment Diagrams Are a Game-Changer
Clear Path Through the Tech Jungle
C4 deployment acts as a tour guide in a wild tech forest. They display the location of software in hardware. Containers and nodes show you the way. It is a guiding map. With a deployment diagram for system architecture, you don't have to wander through configs.
Bridge Between Dreamers and Doers
Such diagrams interrelate planners and builders. Designers are visionary. Engineers identify needs in the real world. It turns ideas into action. Everyone works as one unit. Mistakes are cleared out. Shared vision makes projects come to fruition more quickly.
Spotlight on Hidden Weak Spots
The C4 deployment diagram identifies bottlenecks in advance. Connections reveal risks during data flow. Teams fix issues early. It saves time and stress. This way, you don't have to worry about big surprises, and problems remain small. Systems remain robust and become immune to errors.
Guides Scaling Decisions
Climbing a ladder without a roadmap is like moving blind. Growth is designed with deployment diagrams. Teams can review which nodes have the capacity to process and which need upgrades. This prevents unnecessary waste and helps in scaling the efforts where it is needed.
How to Make a C4 Deployment Diagram in EdrawMax
EdrawMax simplifies the drawing of complicated diagrams. In the case of C4 deployment diagrams, it presents you with nodes, containers, and connections. You can also choose symbols from its library and place them on the canvas instead of drawing everything manually. The drag-and-drop layout makes the process more fun.
EdrawMax allows quick labeling of IP addresses, versions, and environments. This makes your diagram detailed and visual. All of these attributes save time and minimize errors. Now, let's go to EdrawMax and design a simple C4 diagram example.
Step1 Log In to EdrawMax
- Start your creative journey by logging in to EdrawMax.
- Sign in with a quick sign-in using Google, Apple, or Facebook.
- Proceed to the editor.
Step2 Start with a New Blank File
- On the left-hand panel, click on New.
- Choose New Blank File.
- It will then give you a clean canvas.
- Start dropping nodes, containers, and connections to your C4 deployment diagram.
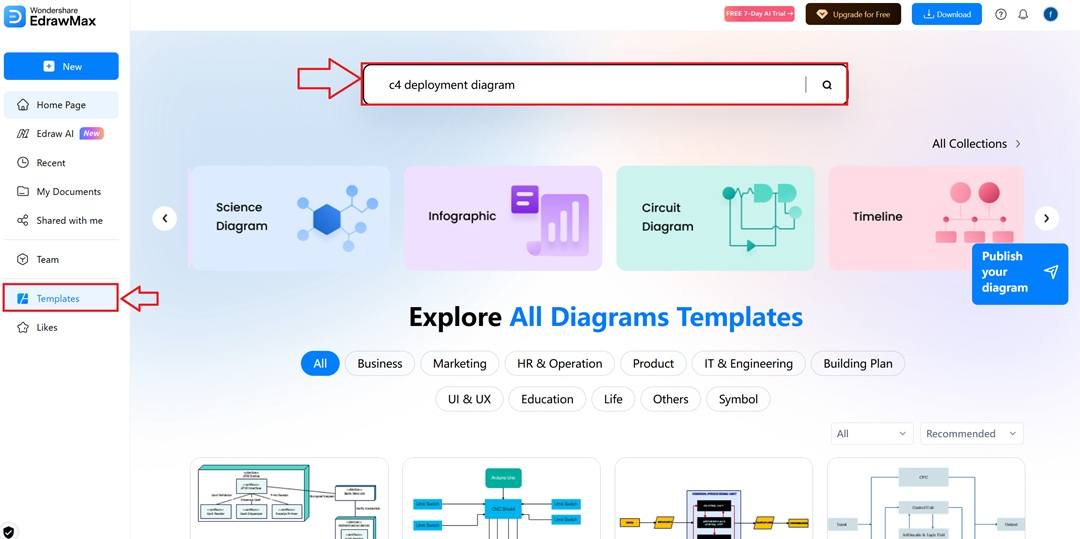
Step3 Use Templates for a Quick Start
- Select the Templates section.
- Use the search box to enter 'C4 deployment diagram.'
- Select one of the templates that suits your purpose
- Open it to make some quick edits.
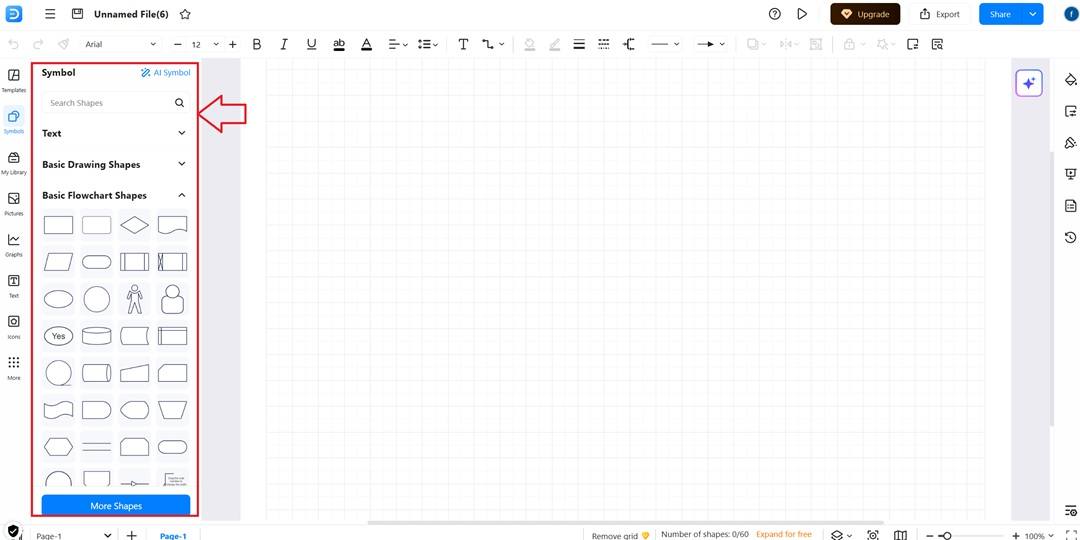
Step4 Add Nodes, Boundaries, and Connections
- Draw nodes, boundaries, and connections with the symbols.
- You can find various symbols in the More Symbols option.
- Organize them to show the workings in your C4 deployment diagram.
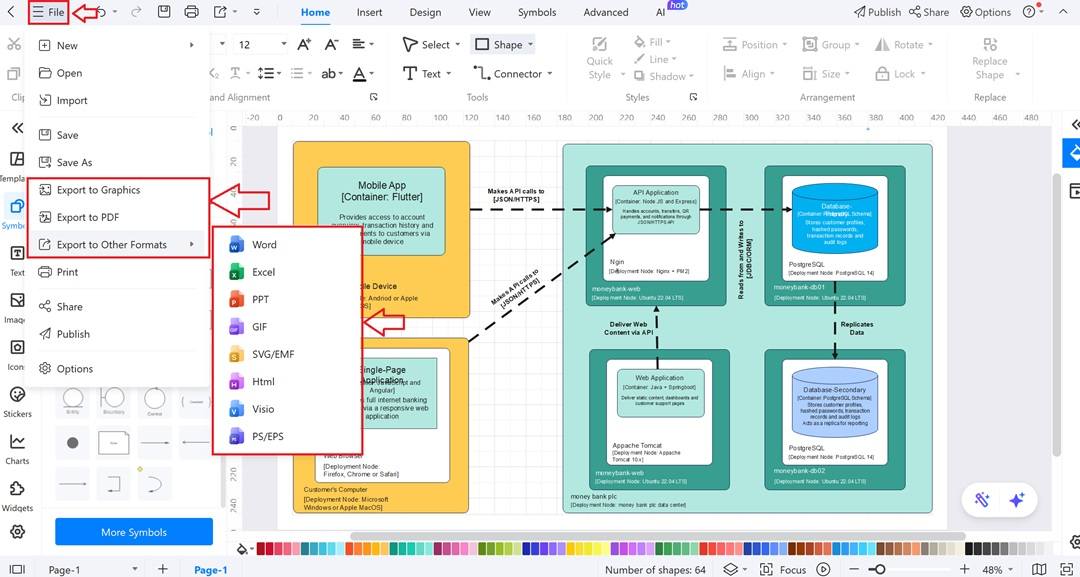
Step5 Export and Save Your Diagram
- Complete the diagram
- Go to the File menu.
- Select Export
- Choose one of your preferred formats of PDF, Word, Excel, or PPT.
Final Insights on C4 Deployment Diagrams
We have gone through what a C4 deployment diagram does and how it brings transparency to system design. Now you have an understanding of how nodes, containers, connections, boundaries, and annotations are used to simplify deployment.
The C4 model deployment diagram connects all these details so that you can plan smarter and avoid weak points. With EdrawMax, building one doesn’t feel heavy or technical; it feels doable. Build your own diagram and notice how decisions become easier. Give it a shot today!
AI Diagram Generator
Enter your prompt. Upload files if needed. Generate diagrams, charts, or slides instantly.


