


In this article
What is an Euler Diagram
The Euler diagram is the representation of set theory. It illustrates visual set relationships from real life. Most people get confused between it and the Venn diagram due to their resemblance. Like Venn diagrams, Eulerian diagrams use circles to illustrate the logical interaction between items.
Though both diagrams are part of the set theory, the Euler diagram only shows a part of the relationship. This relationship is applicable in practical scenarios only. However, the Venn diagram is applicable in all possible practical and theoretical interactions between sets.
For instance, let us take two categories: a superset of mammals and a subset of birds. A Venn diagram will show the intersection between the two sets, even if the shaded area is empty. In contrast, the Euler diagram will only have two separate circles for mammals and birds. It is because they are not intersecting.
Basic Venn diagrams allow visualization of the set theory, making them apt for education. However, Euler diagrams are flexible and have extra structural elements like dots, graphs, and written labels. Therefore, Euler diagrams are best known for depicting hierarchies, making decisions, and analyzing perspectives.
History of Euler Diagram
Eulerian circles were first Introduced by the Swiss mathematician Leonhard Euler in the 18th century. He used these diagrams to depict logical relationships between two categories. Following this, the Venn diagrams were recognized in the 19th century.
In the 1960s, educators used both these diagrams to develop an understanding of set theory. Later, John Venn, Peirce, and Leibniz contributed to Euler diagrams development. Today, you can apply them to real-life complex hierarchies.
A typical Eluerian circle separates categories enclosed by a curve or circle. Each curve has two zones, also known as regions, inside and outside. The inside region illustrates the elements of the set, whereas the outside region is not a part of the set. This entire arrangement portraying the intersection of sets is called the Eulerian diagram.
Unlike the Venn diagram, non-overlapping sets are not shown through shaded empty spaces. Instead, it completely separates the two circles and represents the disjoint sets.
Euler Diagram Example
Now that we have established the Euler diagram concept, let us proceed and see some Euler diagram examples.

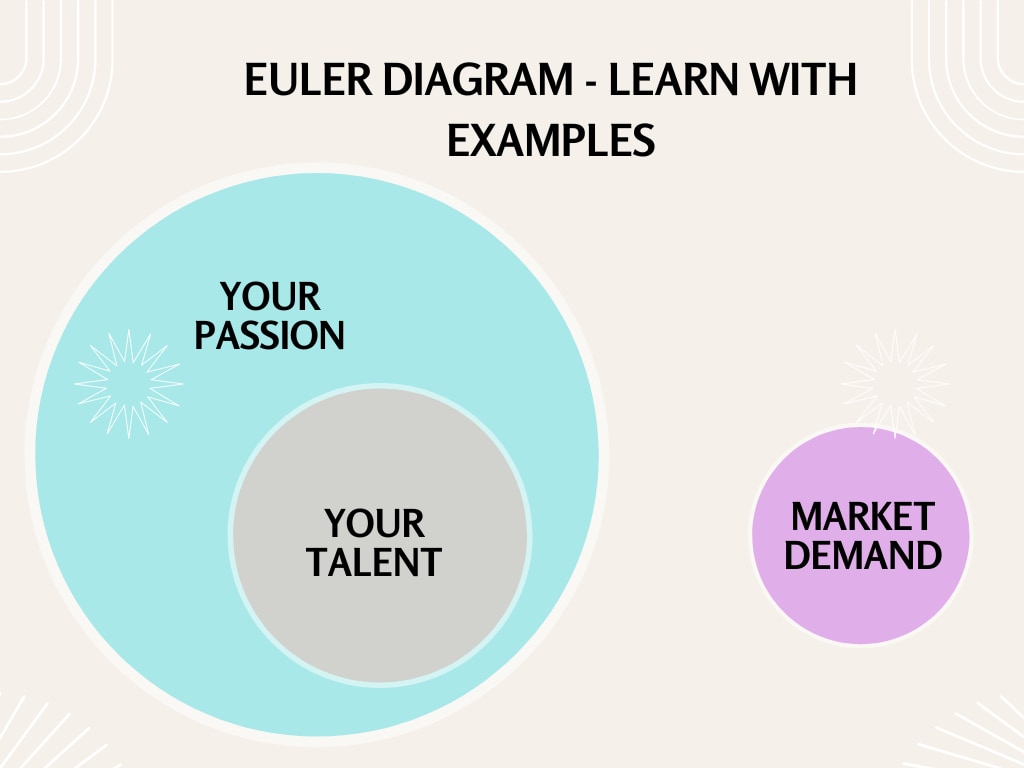
 below.
 A one-liner for this Euler diagram is simple; “All road signs are stationary objects; Cars are not stationary.”
We can make the following assumptions from this hierarchy structure between the two categories.
- All road signs are stationary objects. You can see it through the road sign subset present inside the stationary objects superset. It is a visualization of overlapping in Euler diagrams.
- Cars are not stationary objects. Here, the car subset is lying outside the superset containing stationary objects. It is an example of non-overlapping or disjoint sets with no shaded empty spaces.
- No road signs are cars, meaning these two categories are unrelated. Hence, they are in different separated circles.
This example depicts a relationship between stationary objects and moving vehicles on the road. It can help understand the traffic and road ethics of anyone planning to drive. Moreover, educators can use this example to inform the class of the road vocabulary.
Difference Between Euler Diagram and Venn Diagram
Belonging to the set theory, Euler and Venn diagrams use different outlooks to define logical relationships. The Venn diagram has an overlapping empty shaded area, while Euler diagrams have no such area, which makes them more flexible and advanced.
Venn Diagram Vs. Euler Diagrams
Although their shapes are similar, both are completely different. Here are some of its main differences.
Overlapping
- Venn Diagram - use a shaded shared region.
- Euler Diagram - use overlapping and nested shapes; it may not have any shared region in case of no overlapping.
Completeness
- Venn Diagram - shows all logical set relationships (can be theoretical).
- Euler Diagram - only shows possible relationships between sets (existing in real life).
Complexity
- Venn Diagrams - are challenging to read and comprehend, especially when there are above three categories.
- Euler Diagrams - are comprehensible. Thus, they are suitable for interpreting complex class structures and interactions.
Expression
- Venn Diagrams - have a few set relationships, including union, difference, and intersection.
- Euler Diagram - offers an illustration of wider dependencies between sets. Hence, they are great for showing complicated hierarchies.
Euler Diagram and Venn Diagram Examples
Nothing clears up the confusion better than an example. Here are examples of Venn and Euler diagram examples to clear up the confusion:

This Venn diagram illustrates the relationship between junk food and plants. There is an overlapping of some elements, suggesting that both belong to the edible food category. However, it also illustrates that not all plants are edible.
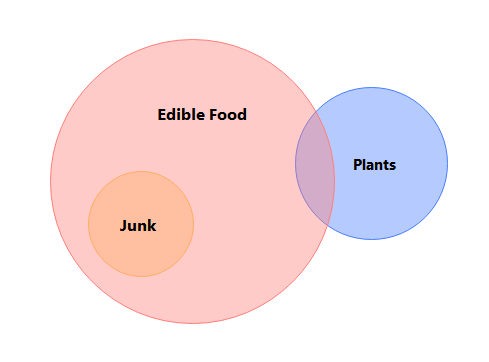
Now, let us look at the same relationship but in an Euler arrangement. One-line statement for this example would be, “All junk and some plants are editable food.”
Here are the following assumptions from this example.
- “All junk food is edible food”. This is because edible food is a superset, and junk food is a subset. The junk food circle is in edible food, showing a strong overlapping relationship between the two categories.
- “Some plants are edible food”. This is because a subset consisting of plants is partially overlapping with edible food. It suggests that only some plants are good for eating.
- “No junk food is the plant,” as both junk food and plants have separate supersets or circles in the diagram. These two categories illustrate a disjoint in this example.
How to Create an Euler Diagram
Despite the close resemblance with the Venn diagram, Euler diagrams use a different arrangement. So, their creation process is a little different. Here is a step-by-step guide on how to create an Euler diagram from scratch.
Before you start, it is always better to note down the data on paper. Let us follow the process using the following example.
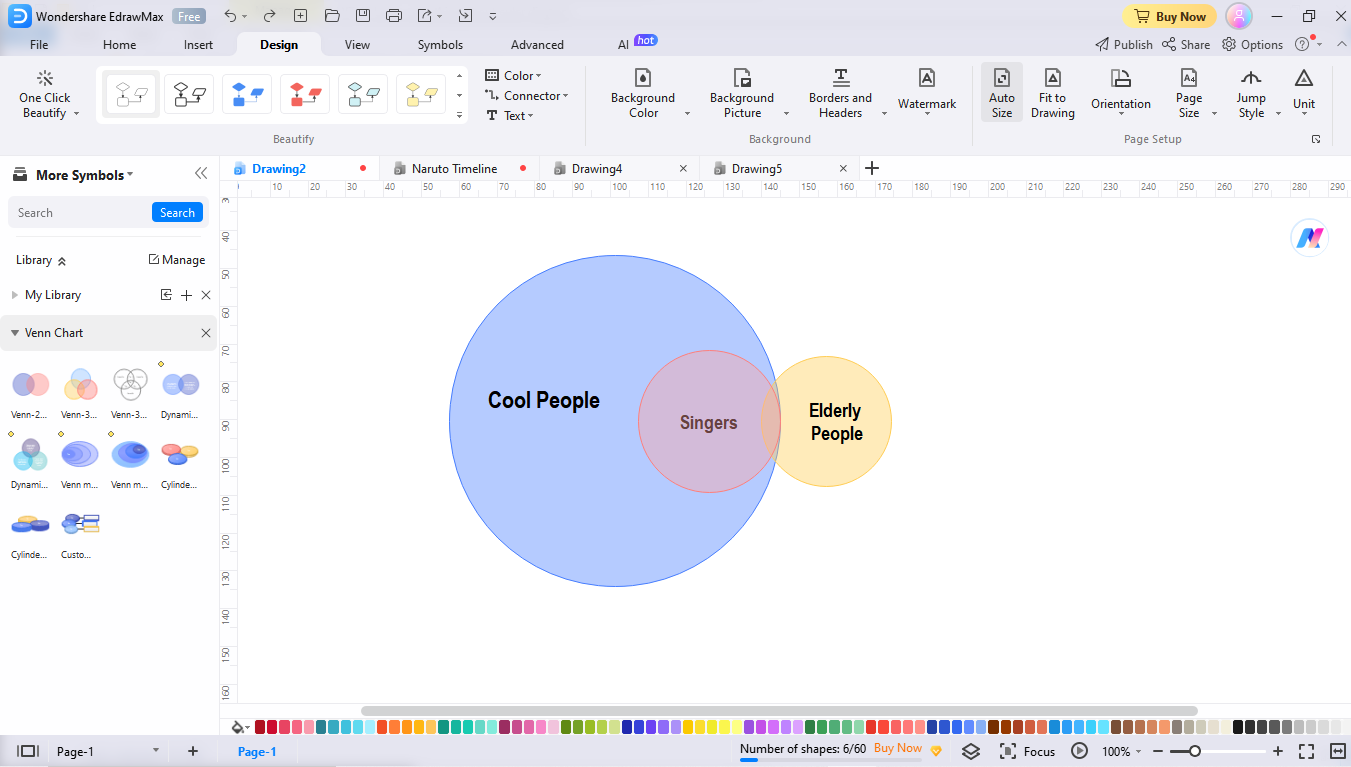
- Statement 1: All singers are cool people.
- Statement 2: Some elderly are singers.
- Statement 3: Some elderly are cool people.
Take your time in writing these statements, as they will lead the further drawing process. Missing any of these statements may disturb the entire diagram-creation process.
Step 1: Draw Three Categories
Go to an online canvas or take a sheet of paper and draw three circles. Whatever you choose, make sure it is erasable so you can add and remove shapes with each step. Now, label each circle with the required category. Here, the circles will be singers, guys, and cool people. Overlap these three circles.

Step 2: Move Circles to Match the First Statement
After this, go back to the first step and check the written data. Read the first statement and move the corresponding circles. Here, the first statement is that “all singers are cool people.” So, change the cool people circle into a superset and place a subset consisting of singers in the former circle.
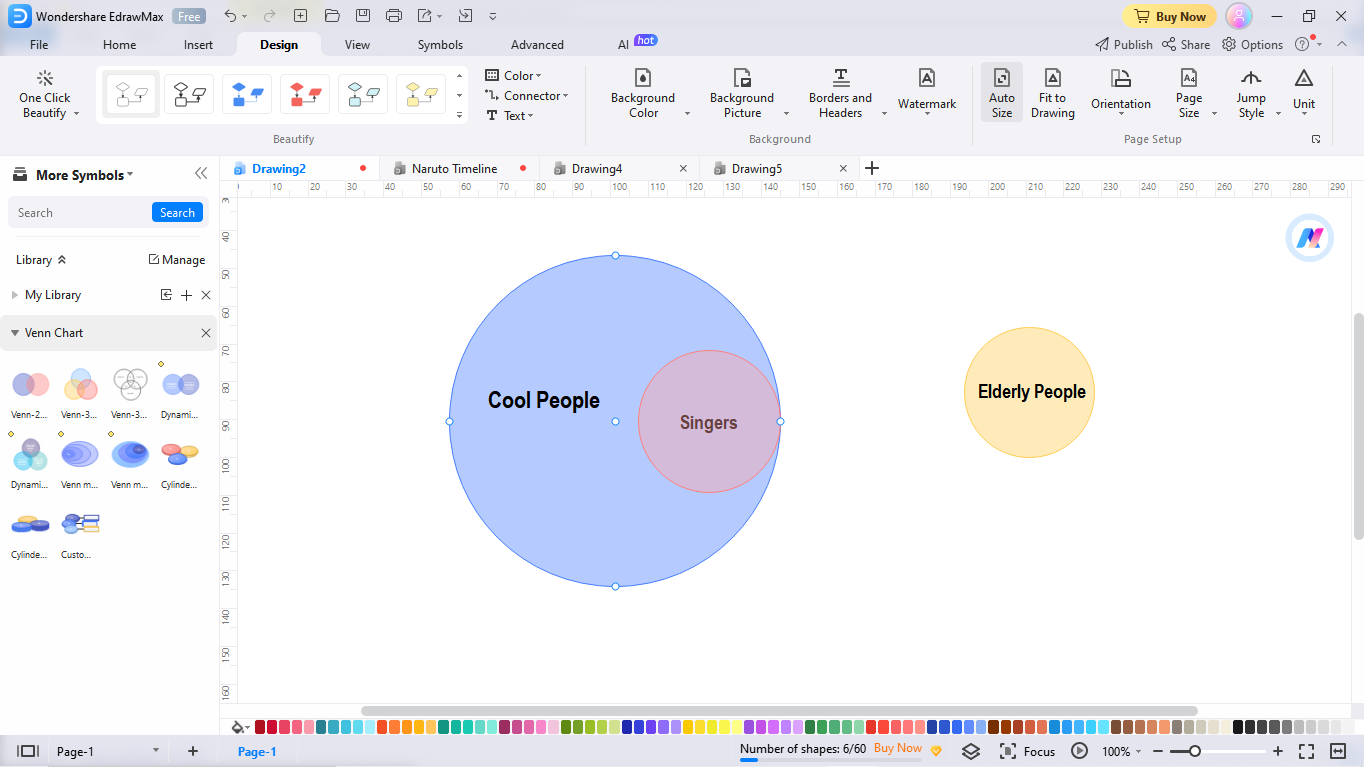
Step 3: Move Circles to Match the Second Statement
Now, move forward and read the second statement, “Some elderly are singers.” So, shift the second subset containing the elderly and overlap it with the subset containing singers.
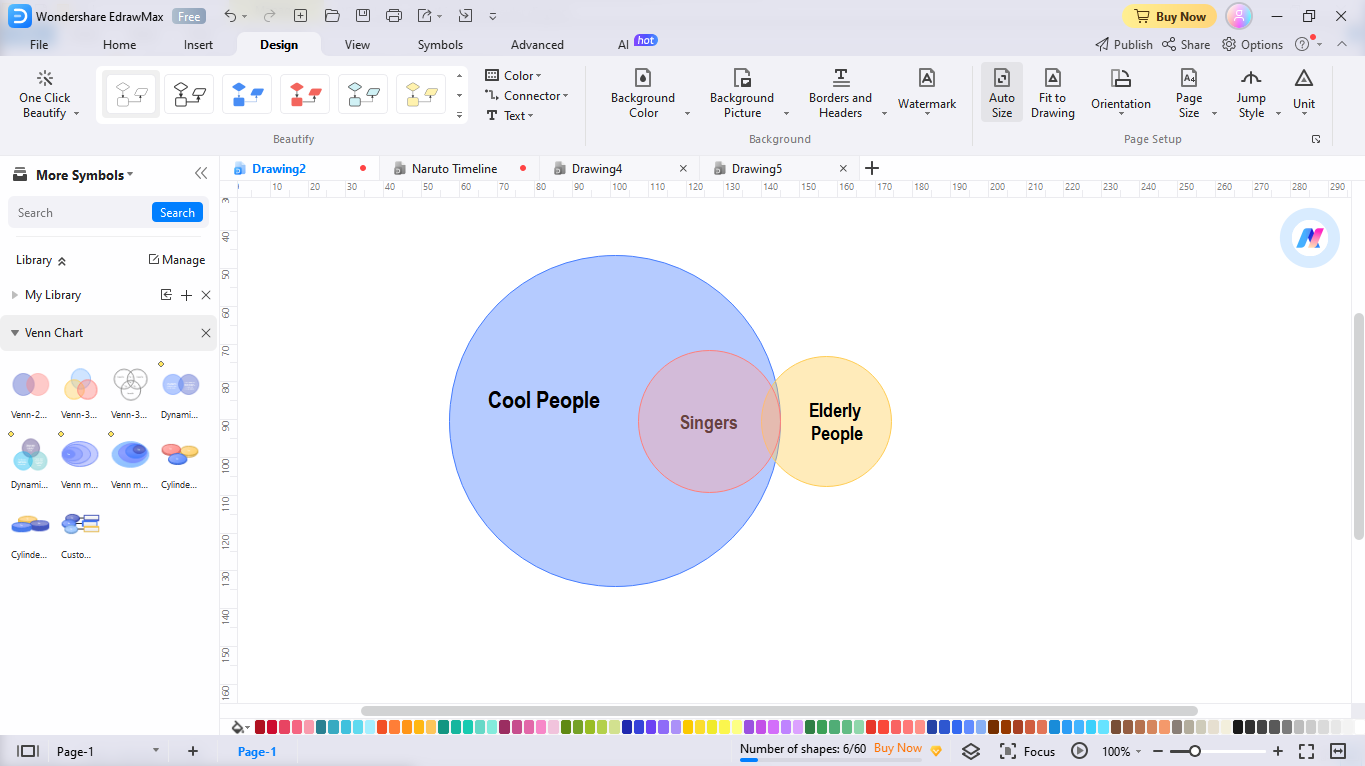
Step 4: Move Circles to Match the Third Statement
Finally, revert to the last statement, “Some elderly are cool people.” It means that the subset containing the elderly must be present in a superset containing singers. So, check the arrangement and adjust the circles. Congratulations, your Euler diagram is good to go.
Conclusion
Eulerian diagrams are great for visualizing different perspectives and depicting complex hierarchies. These diagrams use circles and closed curves to represent the set interactions.
The uncanny resemblance of Euler and Venn diagrams confuses most people. But don’t worry if you are one of them. Despite their similarities, Euler diagrams have extravagant structural elements and flexible arrangements. This is why they are accurate for real-life situations.
So, all you need to do is track these differences. Check out this guide to differentiate them from Venn diagrams and identify their application scope.
AI Diagram Generator
Enter your prompt. Upload files if needed. Generate diagrams, charts, or slides instantly.


