


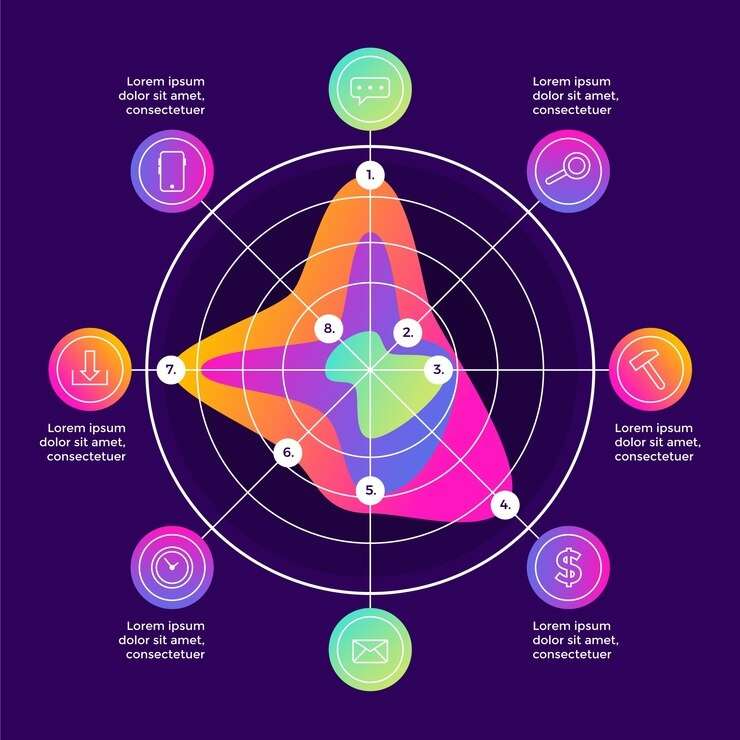
A spider chart is a visual tool that displays data in a 2D space. They're also known as a radar or star chart. It uses multiple axes from a central point to represent different variables. It allows for a comprehensive analysis of various factors simultaneously. This type of chart effectively showcases strengths and weaknesses across different categories.
Spider charts provide a holistic view of complex data sets. They enable you to identify patterns, trends, and relationships between variables. The visual appeal and simplicity make them accessible to a diverse audience as well. Here's why you should use a spider chart online maker to start immediately.
- Ease of use. Online tools make it easy to create spider charts for creatives with varying levels of expertise.
- A free online spider chart maker allows you to create and edit charts from any device with internet access. It promotes collaboration and flexibility in data visualization.
- Time efficiency. Most online tools have free spider chart templates and intuitive features. They streamline the chart creation process. It saves you valuable time in generating impactful visuals.
- Customization Online spider chart makers often provide a range of customization options. It enables you to tailor your diagrams with colors, labels, and data points.
In this article
Part 1. How To Draw Spider Chart on EdrawMax Online
Creating spider charts on EdrawMax Online is a straightforward process. Whether starting with a template or building one from scratch, follow the steps below to learn how.
Method 1: Starting With a Template
Step 1: Open EdrawMax Online. Log in or sign up for an .
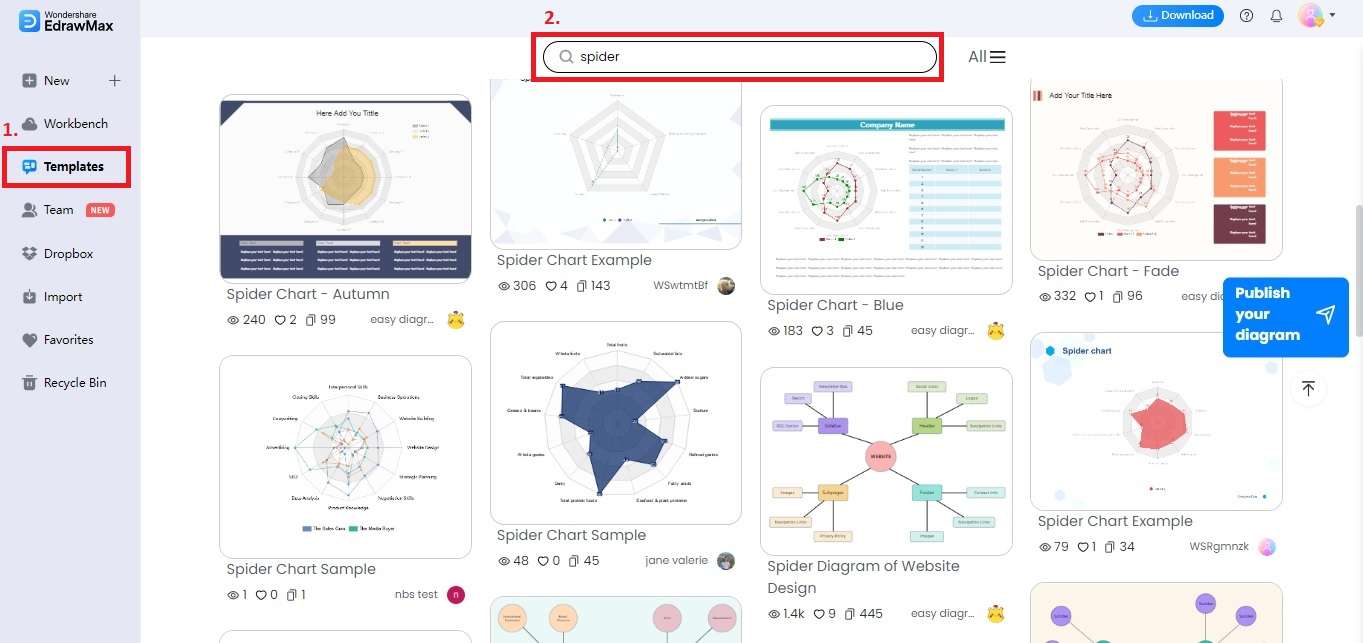
Step 2: Click Templates and use the Search bar to look for spider chart diagrams. Browse through the available templates and select the one that best suits your needs.
Step 3: Input your data into the template by clicking on Manage Data. Adjust labels and values on the Manage Data panel accordingly.
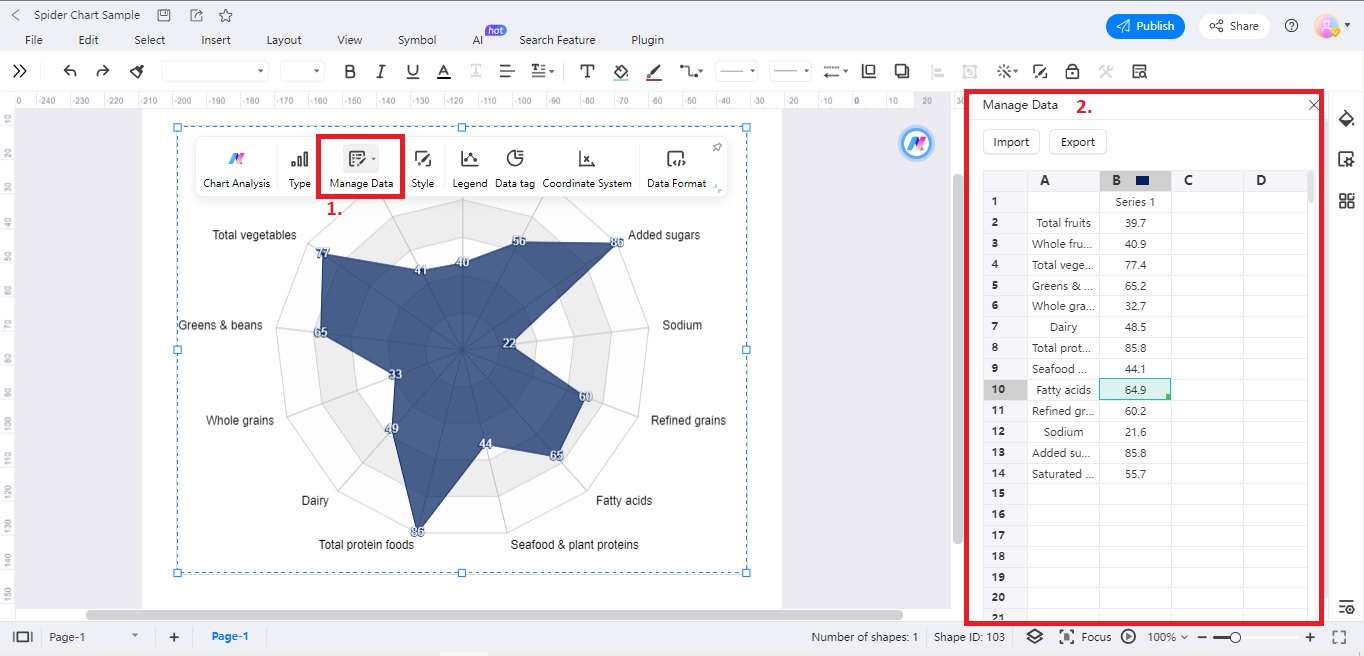
Note: Your spider chart will automatically adjust the diagram based on input.
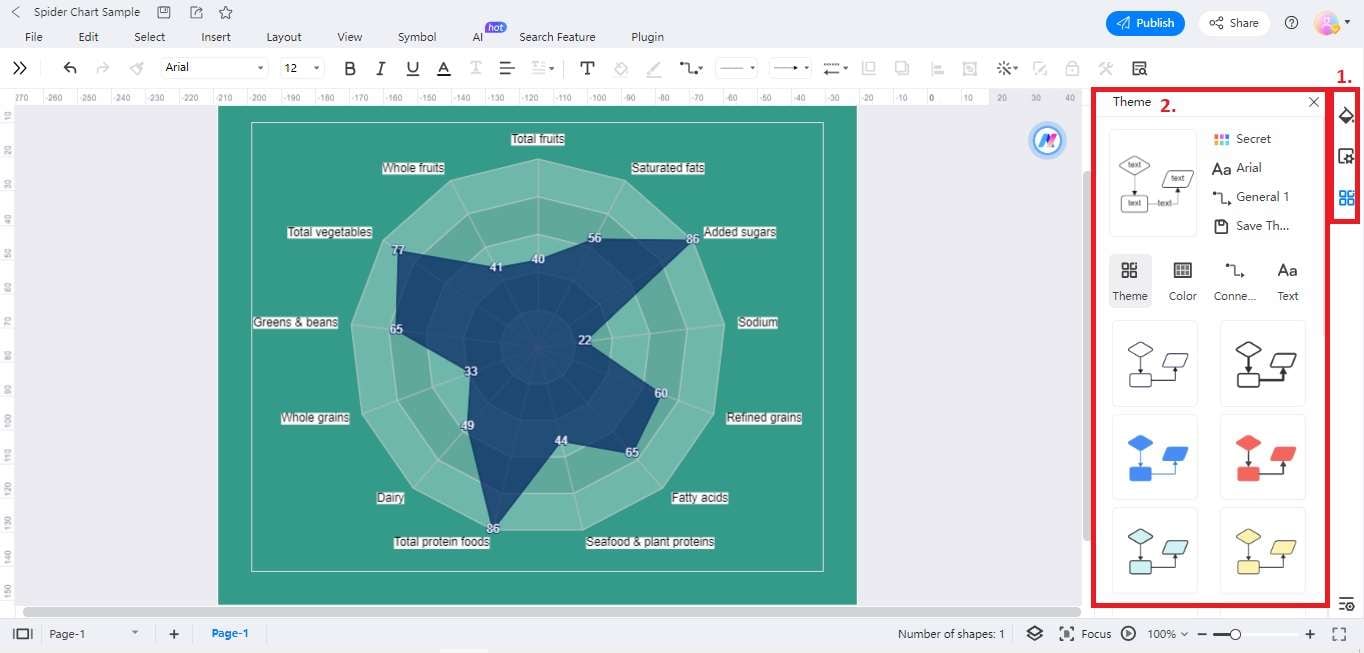
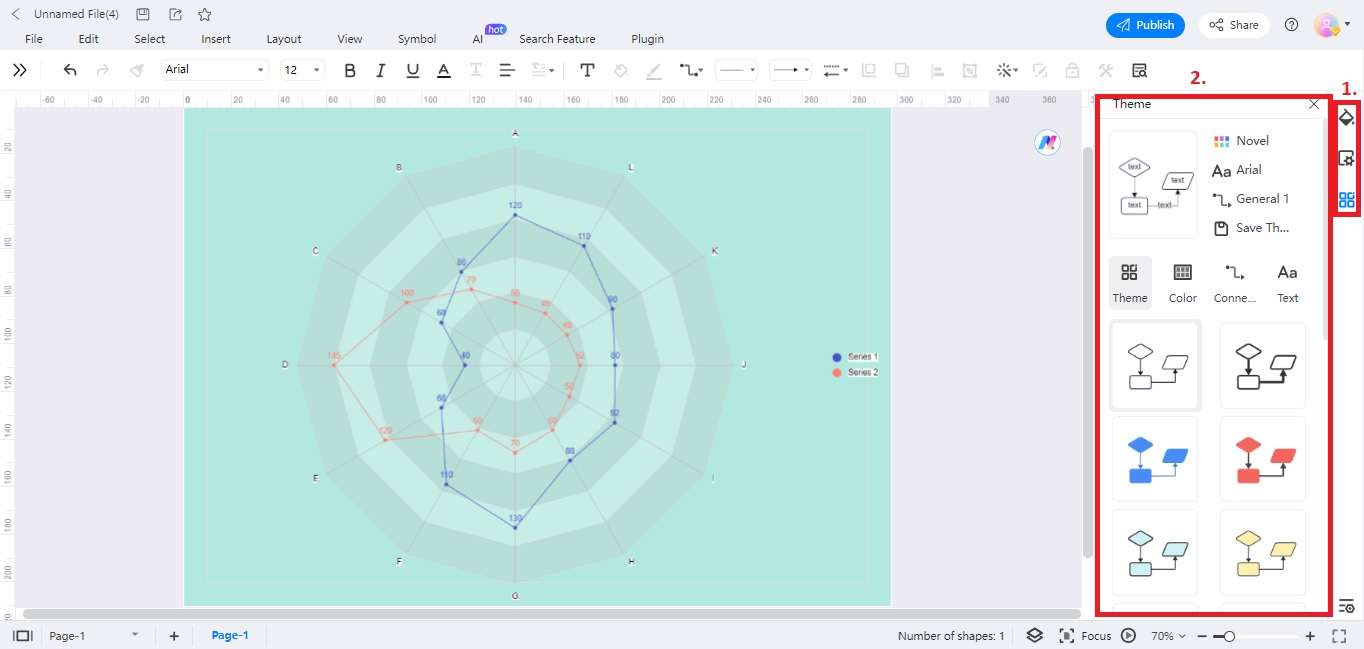
Step 4: You can customize the design by changing colors, labels, and additional elements. Click the right-side panel and customize the spider chart's style, page settings, and theme.
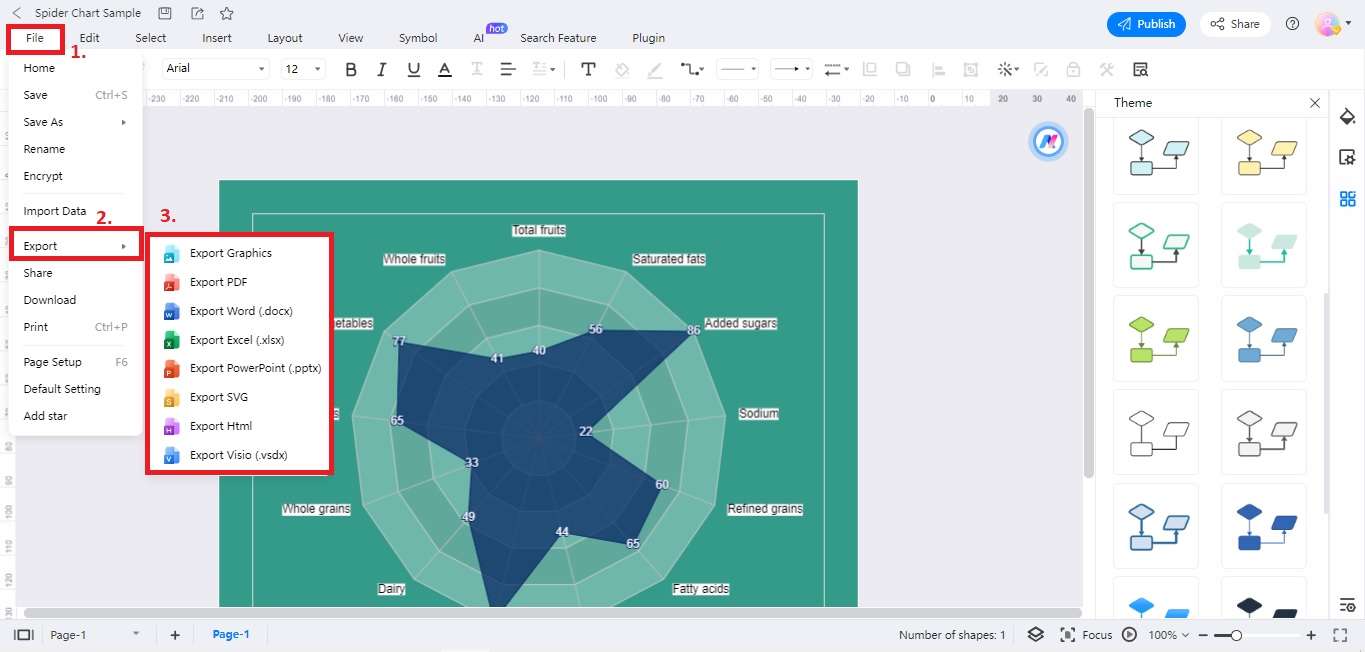
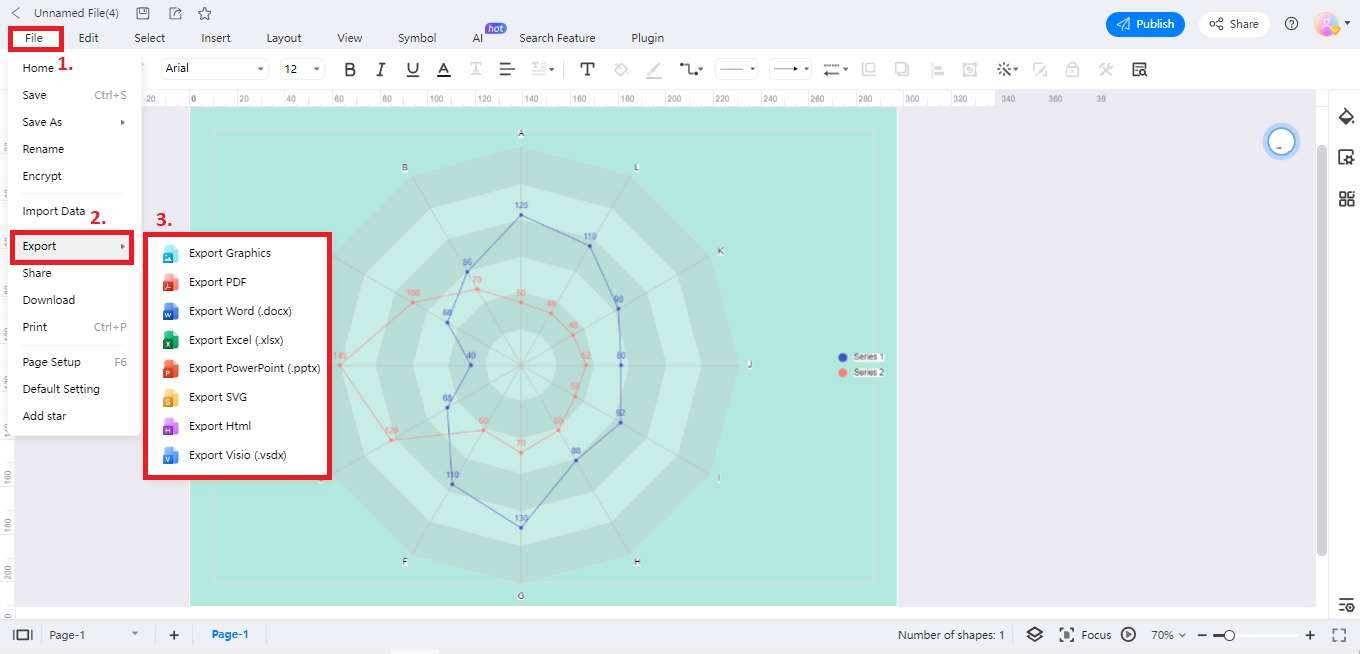
Step 5: Save your work or export the chart for use in presentations or reports. Click File > Export and choose your preferred format.
Method 2: Starting From Scratch
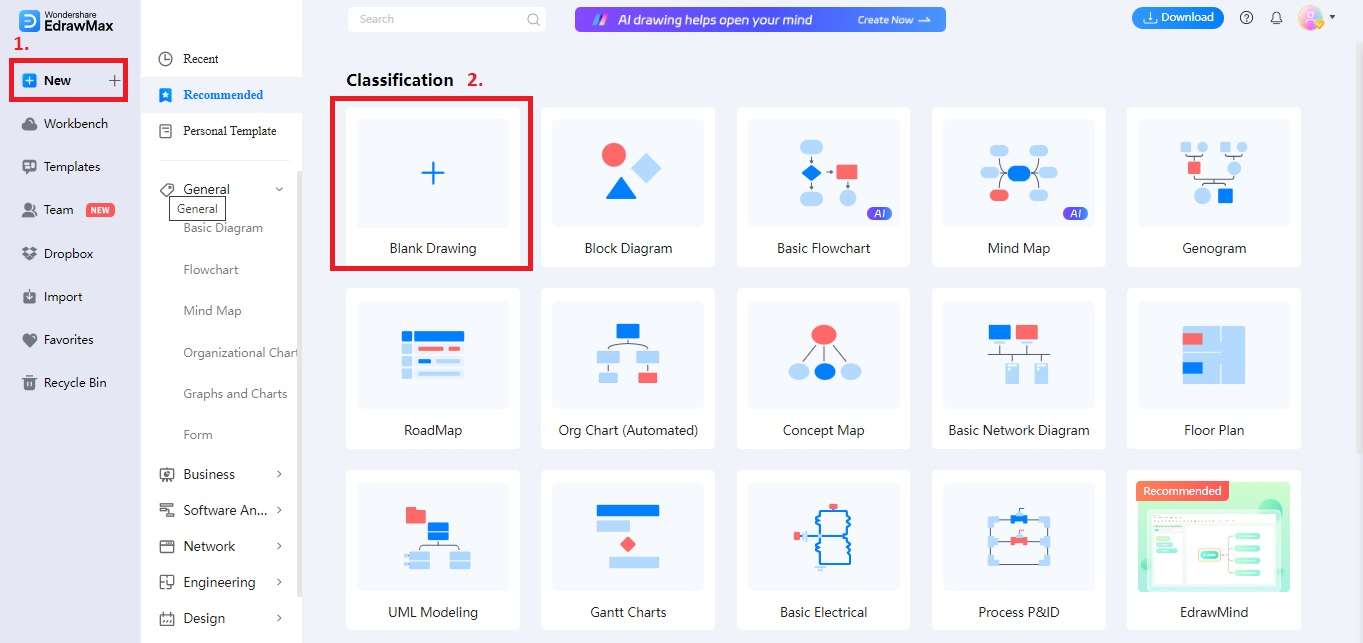
Step 1: Open EdrawMax online. Click New > Blank Drawing to start creating a spider chart from scratch.
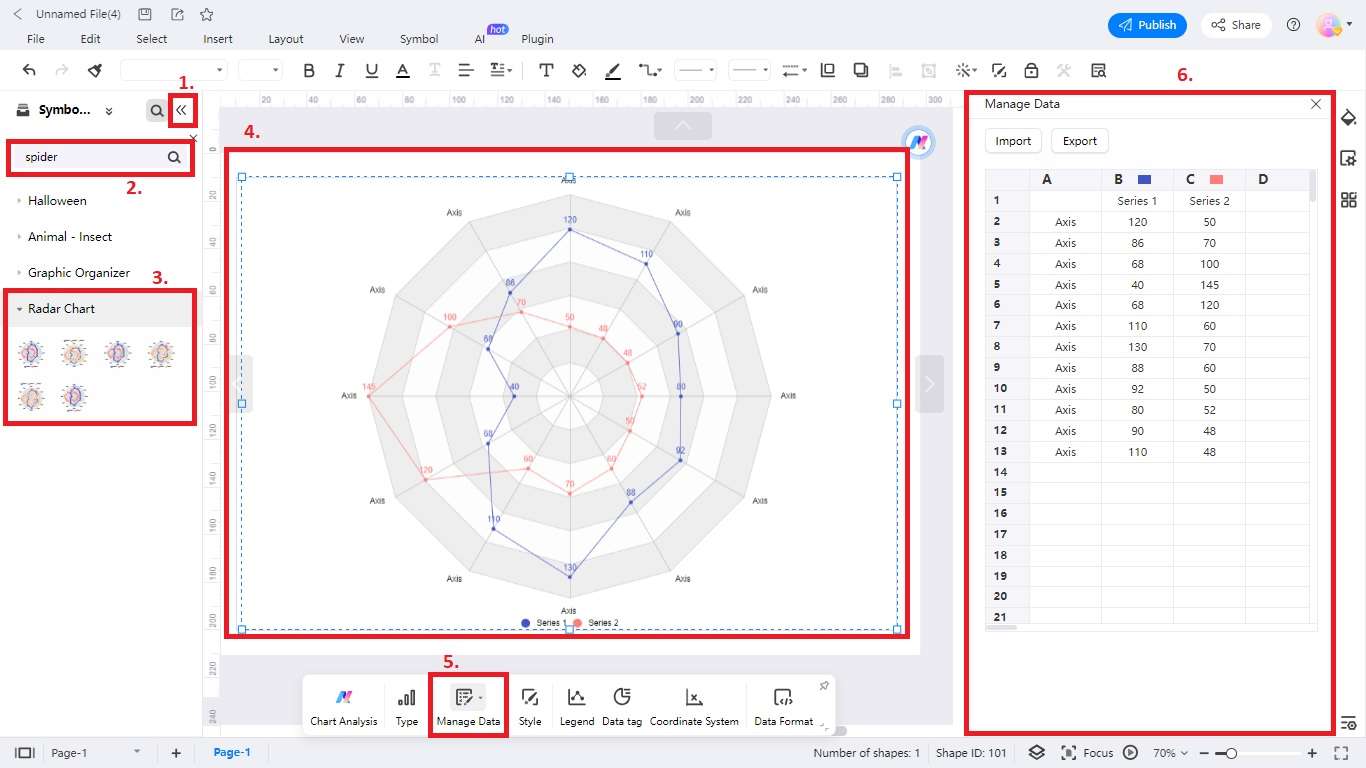
Step 2: Click on Symbols Library. Next, add a spider chart on the canvas. Click on the chart and choose Manage Data. Add details representing different variables. Include a legend or title to provide additional information or context.
Step 3: Enhance the chart's visual appeal by adjusting colors, line styles, and fonts.
Step 4: Save your work or export the spider chart for further use.
Part 2. Why Choose EdrawMax as Spider Chart Maker
EdrawMax Online is a versatile and user-friendly platform. It surpasses traditional tools like PowerPoint or Excel for creating spider charts with a rich collection of templates and other powerful functions. Its streamlined platform redefines chart creation, making it more efficient and professional. You can elevate your visualizations with EdrawMax's innovative approach to spider chart design. Below are its key highlights.
Key Features
- Diverse diagram support. EdrawMax supports over 210 types of diagrams and tables. The tool provides a comprehensive solution for various visual representation needs, including spider charts.
- Unified canvas. Unlike PowerPoint or Excel, EdrawMax allows you to place everything on the same canvas. It streamlines operations and makes visualizing and editing your spider chart easy.
- Presentation ready. EdrawMax enables you to create and export slides directly. It facilitates the seamless integration of spider charts into presentations for a polished and professional look.
- Extensive templates library. With over 10,000 free templates available, EdrawMax offers a rich resource to kickstart your visualization projects.
- Abundant symbols. Boasting a collection of 26,000+ symbols, EdrawMax provides a diverse array of visual elements. It allows for detailed and customized spider chart .
Other Useful Features
Below are the extended features of EdrawMax that make it flexible for different groups of users. You can even see it combines cutting-edge AI technology.
File Recovery
EdrawMax includes a file recovery feature, safeguarding your work against unexpected disruptions.
Online and Offline Versions
Whether you prefer working online or offline, EdrawMax caters to both preferences. It offers flexibility in your diagram creation process.
Free Version
EdrawMax provides a completely free version. It's accessible to users with budget constraints while delivering powerful diagramming capabilities.
EdrawMax AI
The platform incorporates AI technology. It enables the creation of stunning diagrams like flowcharts or mind maps with a single click. EdrawMax's AI enhances efficiency and creativity in your projects.
Part 3. Tips for Making Spider Charts
Following these essential tips, you can create spider charts that effectively convey complex information. They can facilitate understanding and drive informed decision-making among your audience.
Image Name: second-example-of-spider-chart.jpg
Image Alt: tips-for-making-spider-charts
Define Clear Objectives
Clearly outline the purpose of your spider chart. Ensure that it aligns with your communication goals and conveys the intended message.
Choose Appropriate Variables
Select variables that are relevant to your analysis. You should avoid unnecessary complexity. Focus on key factors to maintain clarity and impact.
Consistent Scaling
Maintain consistent scales across all axes to ensure accurate comparisons between variables. Inconsistent scaling can distort the visual representation of data.
Use Colors Strategically
Employ colors to enhance readability and emphasize important data points. Consistent color-coding aids in interpreting the information presented.
Prioritize Data Point
Highlight critical data points by adjusting their size or using markers. This draws attention to specific elements and facilitates a more focused analysis.
Limit Categories
Keep the number of categories manageable to prevent overcrowding. Too many axes can overwhelm the viewer and dilute the chart's effectiveness.
Provide Contextual Information
Include titles, labels, and legends to provide context and guidance. It ensures that viewers can easily understand the chart and its components.
Regularly Update Data
If the spider chart represents dynamic data, update it regularly to maintain relevance and accuracy. This is crucial for decision-making based on real-time information.
Consider Your Audience
Tailor the complexity of your spider chart to the audience's familiarity with the subject matter. Strike a balance between detail and simplicity based on the viewers' expertise.
Test and Refine
Before finalizing, test your spider chart with a sample audience and gather feedback. Use this input to refine the chart for optimal impact and comprehension.
Conclusion
Crafting spider charts online involves a strategic blend of clarity, relevance, and visual appeal. You can create charts with precision by following objectives, selecting variables, and making thoughtful design choices.
For a seamless and efficient experience in creating spider diagrams online, consider using EdrawMax. Its interface, templates, and customization tools ensure that your data presentations are effective and hassle-free. Elevate your diagrams with EdrawMax's intuitive tools for creating dynamic spider charts online.
FAQs
Explore commonly asked questions about Spider Charts. The section below discusses their intriguing name for leveraging EdrawMax's features for seamless data visualization.
1. Why is it called a Spider Chart?
A Spider Chart gets its name from the web-like appearance created by multiple radiating axes. This visual representation resembles a spider's web. It's where each axis signifies a different variable, resulting in a comprehensive overview of data.
2. What makes Spider Charts effective for data visualization?
Spider Charts display multivariate data, allowing for a simultaneous analysis of various factors. This visual tool is useful in showcasing strengths and weaknesses. You can map out different categories in a comprehensive and easy-to-understand manner.
3. How does EdrawMax enhance Spider Chart creation?
EdrawMax simplifies spider chart creation with its user-friendly interface. Users can either start from scratch or choose from a variety of templates. The platform supports dynamic data input as well. It ensures your spider chart stays current and responsive to changes.
[没有发现file]AI Diagram Generator
Enter your prompt. Upload files if needed. Generate diagrams, charts, or slides instantly.


