


In this article
Part 1: What is an IT Organizational Chart
An IT organizational chart is used to show the structure being employed by IT departments or companies. It details roles, reporting relationships, and the functions that each role performs. Naturally, this kind of org chart will include IT-related roles, too. Below are six typical roles found in IT companies and what they typically do:
- CIO / IT Director: The top-level executive oversees all IT operations. They are usually in charge of aligning the department or organization’s goals. They are also tasked to make infrastructure, security, and budget decisions to improve the company’s outlook.
- IT Managers: These managers are just right below the CIO or IT director. They report to the CIO and manage different departments individually. Thus, they are sort of the “mid-level” executives.
- Team Leads: These professionals guide specific teams within a department. They handle task assignments, support collaboration, and act as the go-between for their team and upper management.
- Specialists: Now, these are the people who do most of the work. These specialists are hired because of their ability to develop software and administer systems. Sometimes, they are called database engineers, network architects, or software engineers.
- Support Staff: These support staff are the “frontliners” of IT companies. They are often called customer service representatives. They handle technical issues raised by users or other employees.
- Project Managers: Recently, the trend has been to have “project managers” to whom specialists or support staff report. These managers are directly connected with the CEO of the company and often align the technical side of the IT department with the goals of the company.
An IT org chart helps clarify who does what and supports better team communication. It also helps new hires, external partners, and decision-makers understand the company’s structure at a glance.
Part 2: IT Org Chart Examples
An IT org chart clearly shows how technical teams are structured within a company. Whether you're managing a startup or a large enterprise, having a well-defined chart helps everyone understand roles, reporting lines, and areas of responsibility. These charts can vary by company type, size, and focus—some highlight development and engineering, while others center around infrastructure, cybersecurity, or support services.
IT org charts are handy in several key scenarios:
- Team Structuring: When forming or reorganizing teams, org charts help ensure balanced workloads and proper leadership coverage.
- Onboarding: New hires can easily see who they’ll work with and who to contact for specific tasks or approvals.
- Workflow Planning: Knowing how departments connect improves coordination between development, QA, support, and operations.
- Project Assignments: Managers can quickly identify available resources and assign roles based on skillsets and hierarchy.
- Compliance Audits: For companies in regulated industries, org charts support transparency by showing who holds what responsibilities and how oversight is maintained.
Now that you know about their usefulness, below are some examples that you can follow when making your IT org chart, along with some insights:
7 Free IT Org Chart Examples
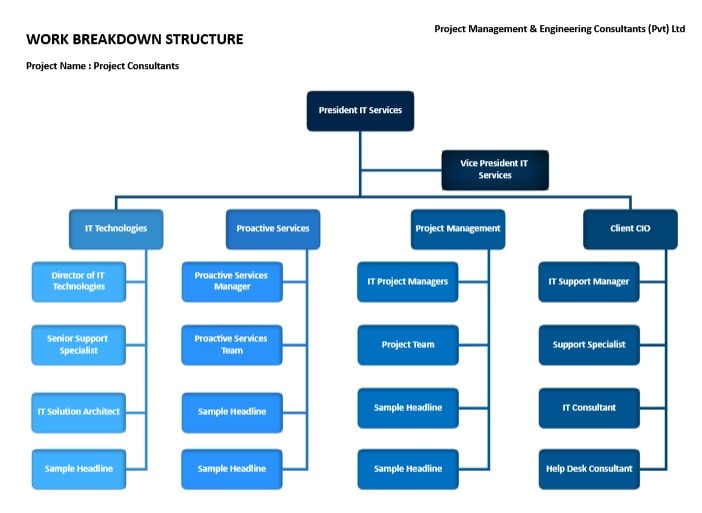
IT Org Chart With Departmental Layout
This IT org chart uses a departmental layout, dividing the structure into key areas like IT Technologies, Proactive Services, Project Management, and Client Support. It clearly shows how leadership flows from the President down to team members. For growing IT firms, this layout helps streamline communication, reporting, and task ownership across departments.
 below.
  below.
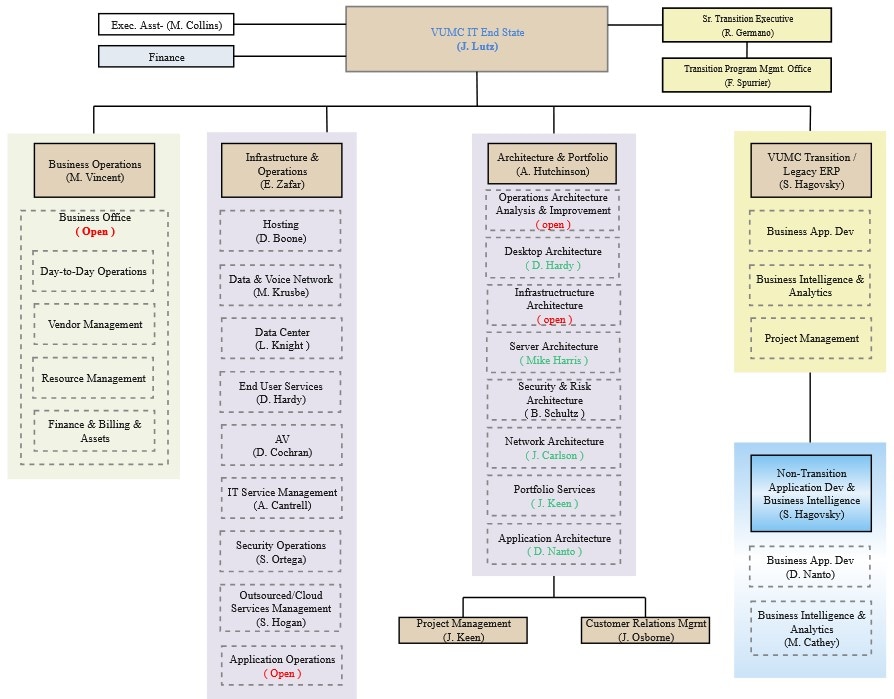
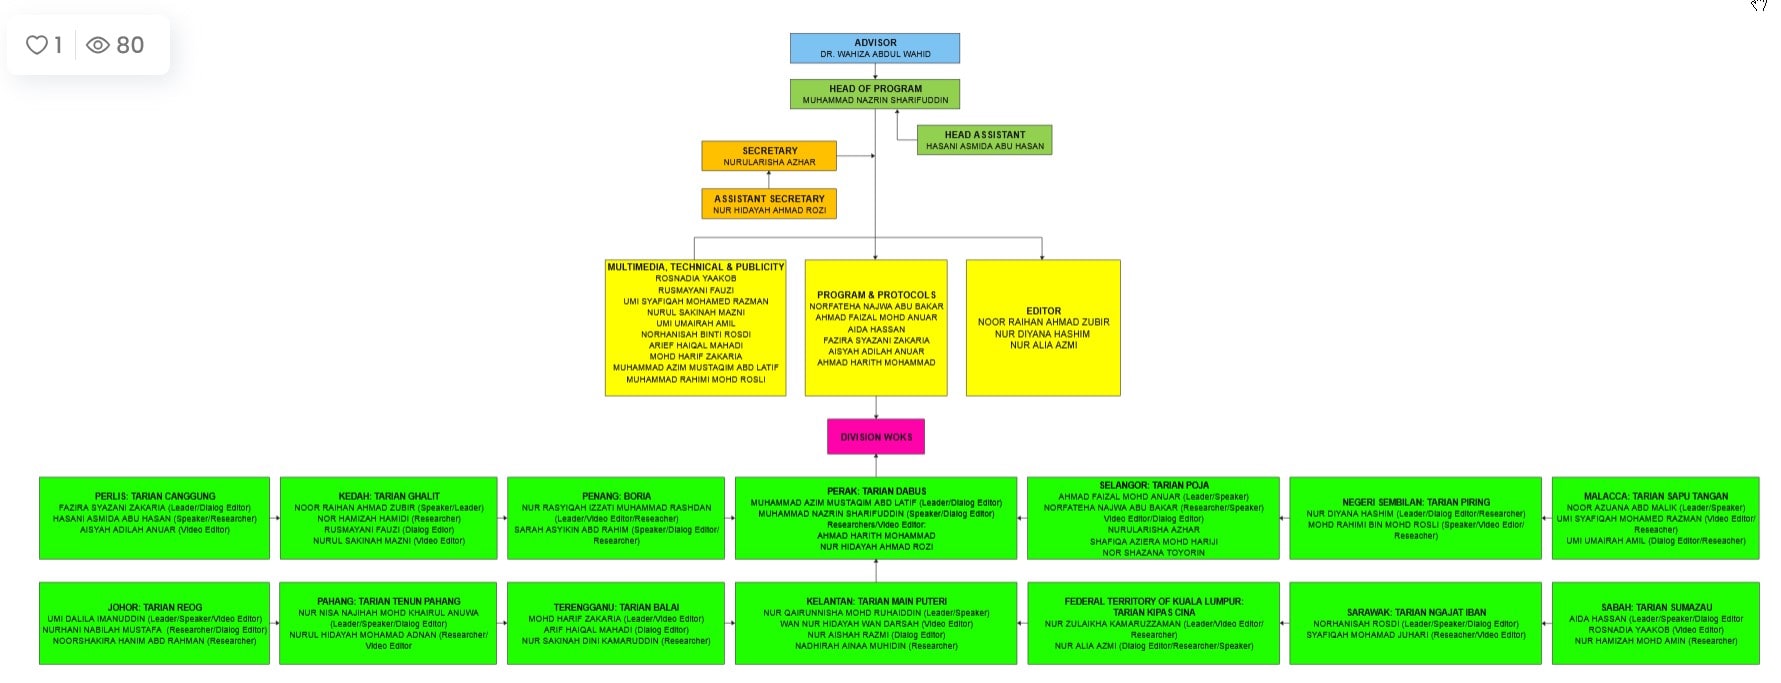
 Color-Coded IT Organizational Chart
Next up is this creative-looking IT organizational chart. It uses pastel colors to color-code the different departments. For example, the business operations department uses a cream-colored code. Thus, looking at the org chart makes it easy to see the various departments. You can also notice here that names are placed below some roles.
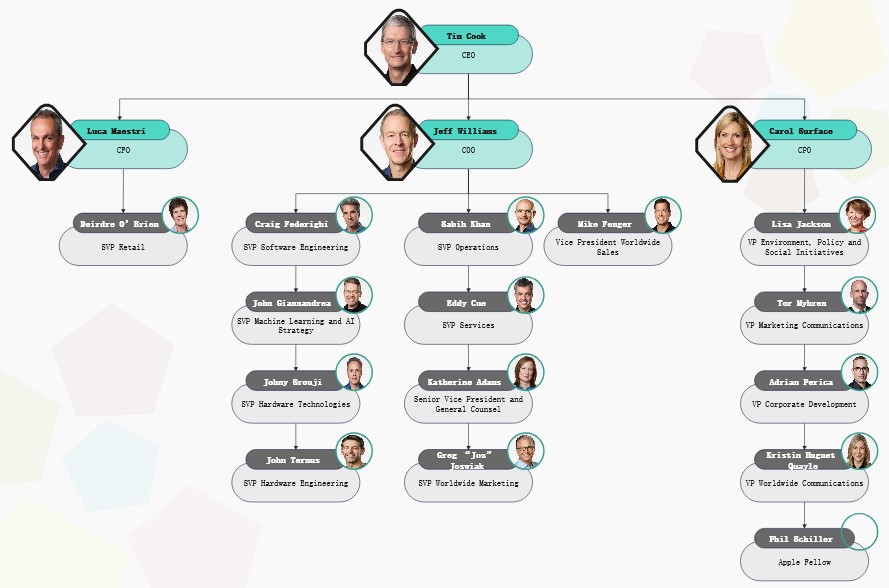
Apple Org Chart
This org chart gives you a real-life example of an IT organizational chart. In this example, Apple’s top executives are shown. Of course, Apple is a large company with more roles, but this org chart only shows the most essential ones, such as the CEO, CPO, COO, and CFO. Some of them are household names that you might recognize, too.
Google Org Chart
Another real-life example is Google’s organizational chart. As an upstart IT company, it’s great to look at and reflect upon the structures that make these big companies successful. You can see here how Google has dedicated departments for almost all key aspects of the company, especially the “People” department through the Chief People Officer.

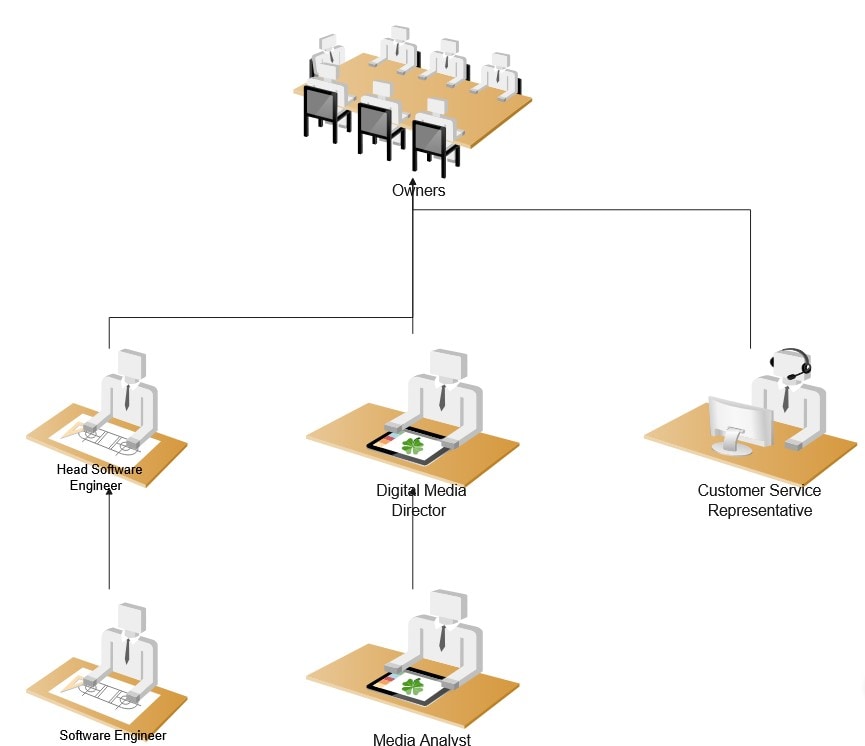
Graphic IT Organizational Chart
A cute idea for your IT organizational chart is to add illustrations that can show how each role works. For example, you can add a tablet device or headphones with the customer service representative to the Digital Media Director. This makes the org chart more intuitive and easier to understand, especially for people who might not be familiar with IT jargon.
Hierarchical IT Organizational Chart
This example shows a hierarchical, top-down view of an IT organization’s structure. It even smartly color-codes each “level” or “tier” of the hierarchy, making it easy to see who’s in charge of whom and who’s responsible for what. This is also a great way to make it easy to navigate the organizational chart.
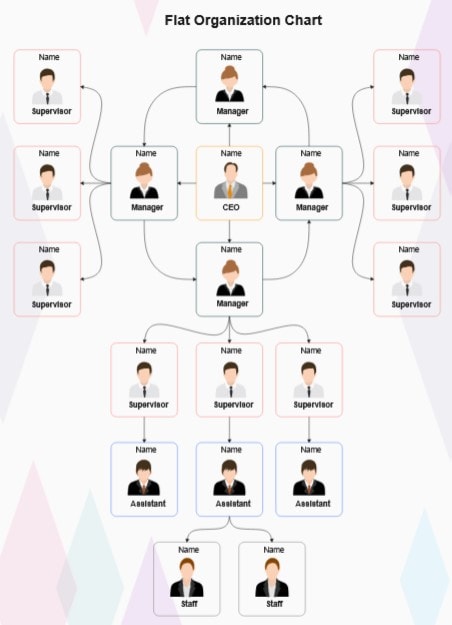
Flat IT Organizational Chart
Lastly, this flat organizational chart shows you another possibility for your IT company. These days, most tech startups employ a flat organizational structure where autonomy and initiative are encouraged. You’ll have different people working as teams and working together towards specific goals. Thus, no one is the “leader,” and everyone has their own “niche” that they work on.
Part 3: How To Create an IT Org Chart
Creating an IT organizational chart starts with understanding your company's structure and the roles within it. Whether you're building a chart from scratch or updating an existing one, the goal is to make your team’s structure easy to understand and navigate.
Identify the Type of Your IT Company Structure
Start by choosing the chart format that fits your company’s way of working:
- Hierarchical Org Chart: This is the most common format. It shows a transparent chain of command, from top executives to staff. Best for traditional companies with defined leadership layers.
- Functional Org Chart: This version groups roles based on specialties—like networking, development, or security. It works well when teams operate independently within their skill area.
- Matrix Org Chart: In a matrix structure, employees may report to more than one manager, a department head, and a project lead. This is common in IT companies with cross-functional project teams.
- Circular Org Chart: Less formal and more visual, a circular chart places leadership in the center and radiates outward. It’s best for companies with flatter structures and a collaborative culture.
Gather Data on Every Person Behind the Roles
Once you've chosen the structure, collect accurate information about your team. This includes names, job titles, departments, and reporting relationships. Verify responsibilities and team connections with department heads or HR to avoid gaps or mistakes. This step is crucial in larger organizations or during restructuring.
Complete the Organizational Chart
With your structure and data ready, you can start building the chart. Use diagramming software, org chart templates, or AI-powered tools to arrange the roles visually. Place top-level leadership at the highest level (or center, depending on format), then organize teams below or around them according to your chosen structure.
Make sure lines between positions clearly show reporting relationships. Using a matrix format, draw connections to reflect dual reporting lines. For clarity, label departments or teams and use consistent formatting.
Once the chart is complete, review it with the IT department and leadership. Keep the chart updated regularly, especially when roles change or new positions are added. A current, well-organized IT org chart improves transparency, boosts team efficiency, and supports better planning across the organization.
Part 4: Make an IT Org Chart with the Right Tool
If you’re looking for a tool to make IT org charts, then look no further than Wondershare EdrawMax. It’s a simple and powerful tool that helps you make visual diagrams like org charts, flowcharts, and mind maps. This is great for professionals and beginners alike, so there’s no problem with its learning curve.
EdrawMax also comes with a good template library. Aside from the pre-built templates, you can explore its Templates Gallery, which has over 30,000 user-made diagrams to choose from, many of which are org charts. It’s a great place to start making your IT org chart.
A key feature is the AI Org Chart Generator. Just enter basic employee details, and the tool builds your chart automatically. This is especially helpful for large teams or companies that often restructure. You can also import data from spreadsheets or cloud storage, making the process faster and more efficient.
Conclusion
IT org charts turn busy workplace into clear structure. They map out who's the boss, who reports to whom, and how your tech teams connect. From CEO to coder, everyone gets their place on the chart. Smart tools like EdrawMax make building these visual guides quick and painless.
AI Diagram Generator
Enter your prompt. Upload files if needed. Generate diagrams, charts, or slides instantly.


