


- What Is a Genogram?
- What Is It Used For And Do You Need This Diagram?
- Symbols of Genogram
- Rules of Making a Genogram
- How To Make A Genogram in EdrawMax?
- Genogram Examples
- Key Takeaways
1. What Is a Genogram?
A genogram is a detailed visual representation of a family's history that goes beyond a traditional family tree. It maps out relationships, medical history, and psychological patterns across multiple generations. Widely used in fields such as medicine, psychology, social work, and genealogy, genograms provide a comprehensive view of family dynamics.
Unlike simple lineage charts, genograms include critical data such as gender, birth and death dates, and significant life events. They also visualize complex information like hereditary diseases, mental health struggles (e.g., depression, alcoholism), and the nature of relationships (e.g., close, estranged). This allows professionals to quickly identify behavioral patterns and hereditary risks that may impact an individual's current well-being.
A genogram brings family history to life by illustrating the complex web of connections between relatives. Families are systems that interact with larger social groups, and understanding an individual often requires analyzing these systemic factors.
By using specific symbols and lines, genograms reveal not just who is related to whom, but how they connect emotionally and socially. This tool enables users to see how historical context, family conduct, and generational trauma shape the present, providing a depth of insight that standard pedigree charts cannot offer.
2. What Is It Used For And Do You Need This Diagram?
While family trees simply list parent-child connections, a genogram reveals the complex interactions within a lineage. It is an essential tool for understanding how family members interact with each other and their support networks, including friends, teachers, and caregivers.
For example, a genogram can illustrate how historical events, such as migration or arranged marriages, influence current family dynamics. It can visually demonstrate patterns like a history of depression or alcoholism across generations, helping to contextualize current issues. Below are the key benefits of using a genogram:
- Analyze Patterns: It allows users to observe relationship dynamics and recognize recurring courses of behavior.
- Medical Risk Assessment: Medical professionals use genograms to identify hereditary health risks and probabilities.
- Therapeutic Aid: Psychologists utilize genograms to assist individuals and couples in understanding their family systems during therapy.
3. Symbols of Genogram
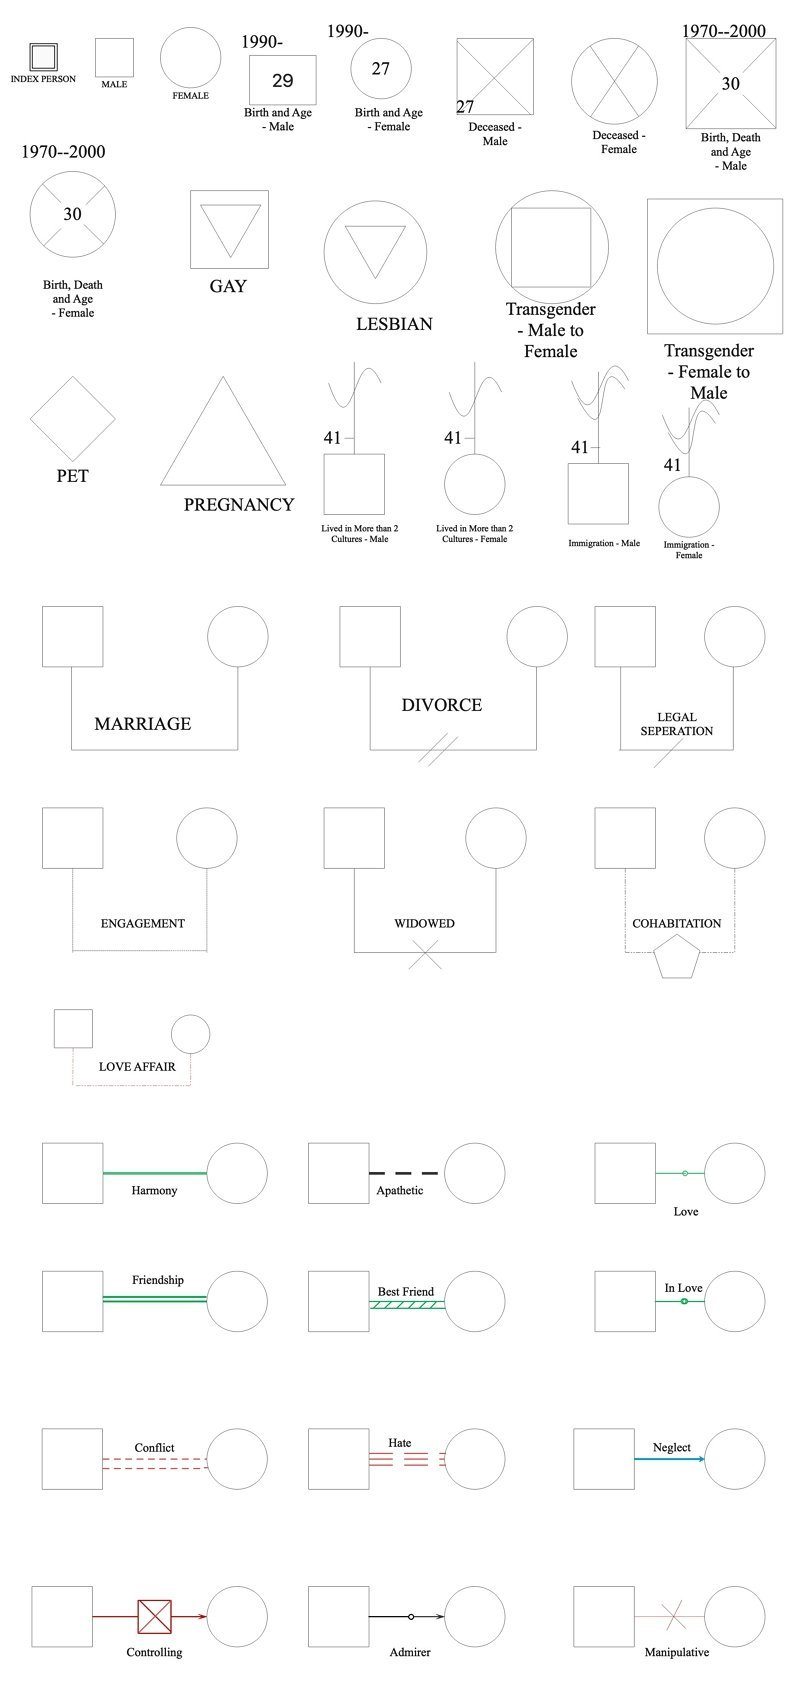
- In a genogram, a square denotes a male and a circle denotes a female.
- A horizontal line connecting the two shows a family.
- The sequence is from the oldest to the youngest for the children, placed below the family line, from left to right. These rules only make a way out for you, when the genogram becomes complex.
4. Rules of Making a Genogram
Making a genogram with the following directive will empower you to make any composite genogram.
Rule 1
The first rule is every time placing the male parent at the left of the lineage and putting the female parent at the right of the family.
Rule 2
The second rule is in sequence to circumvent obscurity; please assume a male-female relationship, instead of male-male or female-female relationship.
Rule 3
The third rule is a spouse must always be closer to his/her first partner, then the second partner (if any), third partner, and so on.
Rule 4
The last rule is always placing the eldest child at the left of his lineage; the youngest child is still at the right of his lineage.
5. How To Make a Genogram in EdrawMax?
Here is how you can draw a genogram using EdrawMax:
Step 1 Identify the reason - why create a genogram?
The first rule is every time placing the male parent at the left of the lineage and putting the female parent at the right of the family.
Step 2 Determine the number of generations to incorporate
You can go maximum up to three generations, generally. It would help if you decided how far you wish to go to elaborate on your family history.
Step 3 Accumulate Statistics
From demographics to psychological, from health to habits, you need to search for all the information related to your family. You can interview or send a questionnaire to your family members. This will save time overall.
Step 4 You can sign up on EdrawMax Online
Get started by signing up on Edraw. Login through Gmail or your social media accounts effortlessly.
Step 5 Open the genogram maker
Click on new, and go to the pop-up menu, select the organizational chart and pick the blank square. Look at the left side of the screen and go to the search library. Click the family tree and select the genogram.
Step 6 Draw the family members in each generation
Form the symbol library, make use of the relationship symbols. It represents the family and their relations. Take them to the canvas.
Step 7 Depict the relationship type
Select emotional relationship symbols to show what kind of bond you share with a family member. You can also add love, harmony, stress, etc., emotions to the same.
Step 8 Save, print, and export
You can add details and then save, print and export in almost any file types that you can imagine!
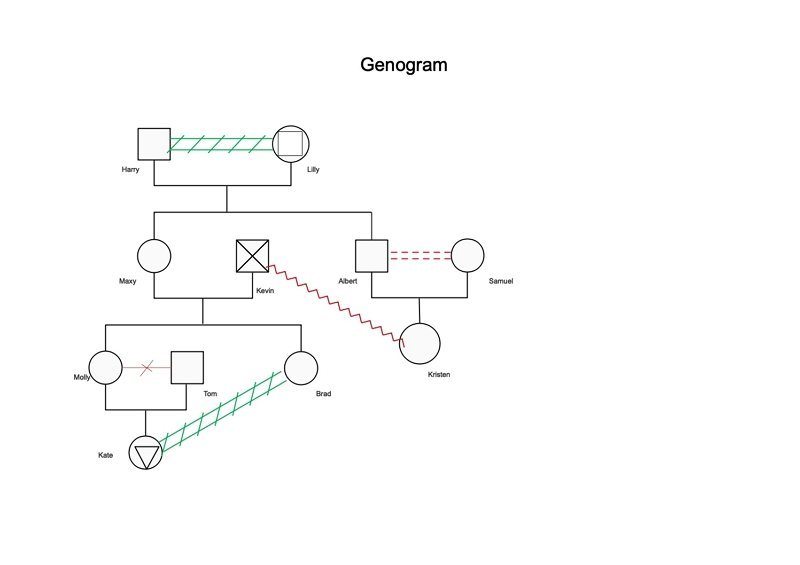
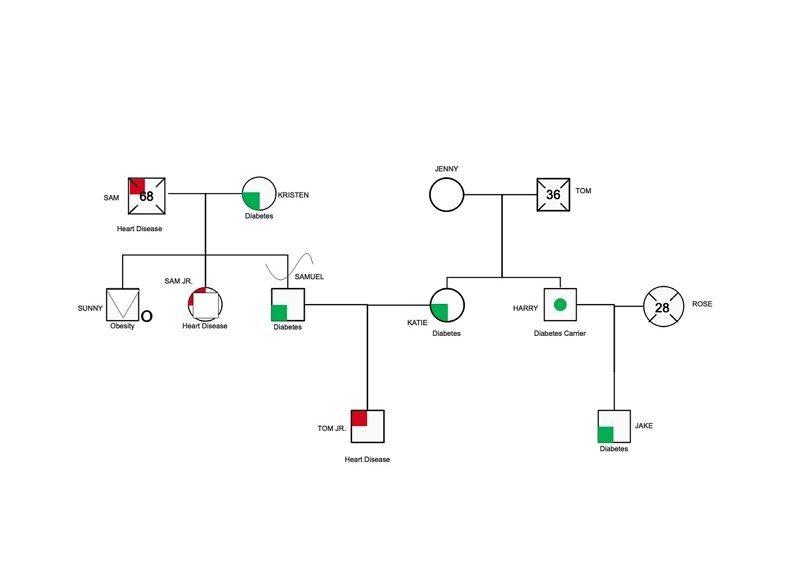
6. Genogram Examples
7. Key Takeaways
As rightly said by Micheal Crichton, “if you don’t know history, then you don’t know anything. You are a leaf that doesn’t know it is part of a tree” , the genogram explains the importance of the same. Hence, it becomes necessary to know what is and how to make a genogram.
AI Diagram Generator
Enter your prompt. Upload files if needed. Generate diagrams, charts, or slides instantly.


