


A dendrogram is a simple tree-like structure diagram that shows the relationship between similar objects or groups. Each branch represents a category, and the whole tree displays the hierarchy between them. This type of diagram is commonly used in biology to show relationships among species. It is also used in data analysis to display the results of clustering, and in a wide variety of other areas that compare groups.
In this guide, you will get to know about Dendrogram and how to make one online for free in a few minutes.
In this article
What is a Dendrogram?
Dendrogram is a Greek word, déndron (tree) and grámma (something written). A dendrogram, in simple terms, is a branching structure that depicts the relationship between various organisms, objects, or groups.
It is made of nodes, which are points where a group splits, and branches, which are the lines that connect these points. When the nodes and branches are arranged together, they form a hierarchy. This means the diagram starts with one main group and then breaks down into smaller groups step by step.
Dendrograms are useful because they make relationships easy to see at a glance. In biology, they show how species are grouped or how organisms are classified. In data analysis, they help display clustering results by showing which items are similar. Dendrogram-style diagrams can also be found in family trees, taxonomies, organizational charts, and customer segmentation charts.
Overall, a dendrogram is a simple and clear way to organize information and compare groups.
How to Make a Dendrogram Online?
Before you start drawing a dendrogram, think about what you want to do. Think about what things or groups to include, how to show how they are related, and what order makes sense. Getting ready a little bit will make it easier to make your dendrogram. To get started, here are some tips:
- Define your goal: Find out why you need a dendrogram. Do you sort customers, explain a biological hierarchy, look at data, or see how things are linked?
- Collect information: Get all the information ready. Make a list that is easy to read. When you cluster, put things that are similar together based on what they have in common.
- Determine associations: Select items that have the closest relationship to each other. Split them into small groups first and then add the groups to bigger ones.
- Choose a layout style: Vertical, horizontal, and diagonal dendrograms. Choose the one that suits your topic and one that seems simple to read.
- Add details: Add labels to clusters, notes to categories, or color codes to groups.
- Check and revise: Make sure that the diagram is error-free, there are no duplicate branches, and labels are understandable. Rearrange the nodes and the branches where necessary to simplify reading the dendrogram.
Steps to Make a Dendrogram in EdrawMax
You can build a dendrogram using online tree-diagram tools rather than drawing it by hand. For my project, I used EdrawMax to generate this dendrogram.
Here’s how you can create one as well.
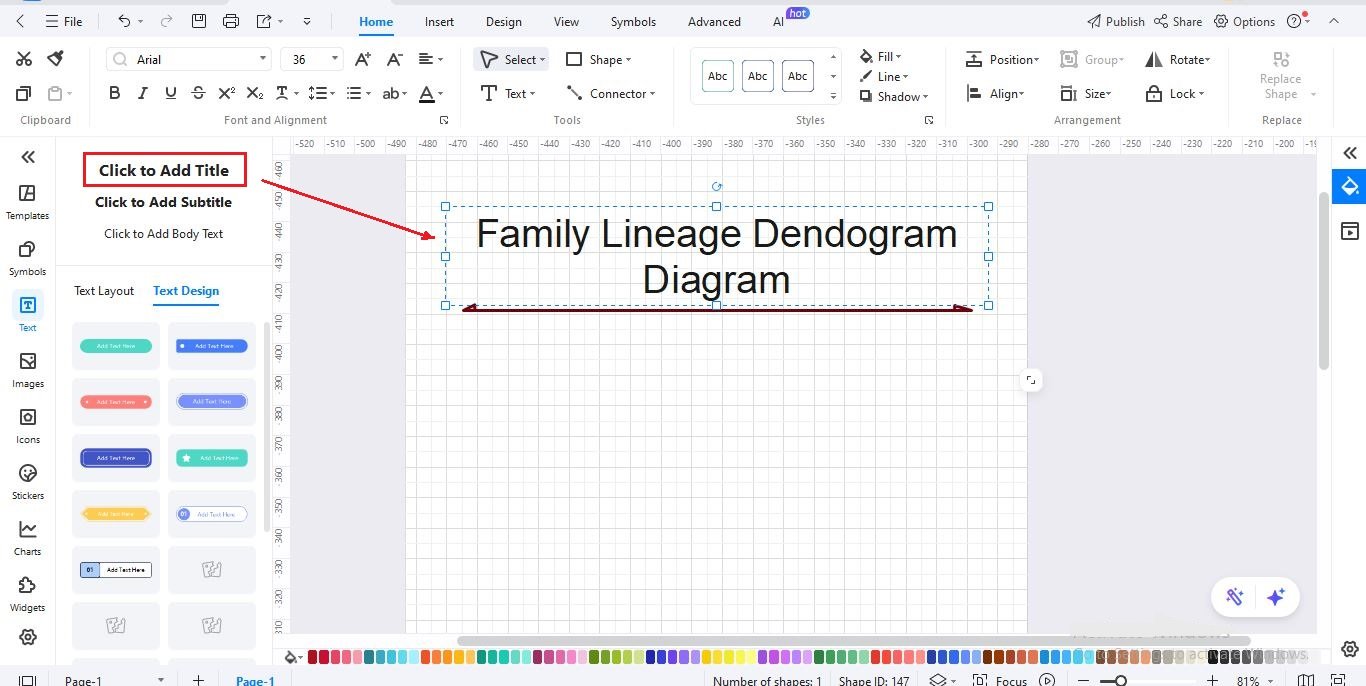
Step1 Create a New File and Add a Title
- Open EdrawMax on your desktop or browser.
- Start with a blank canvas and type a clear title like “Family Lineage Dendrogram Diagram.”
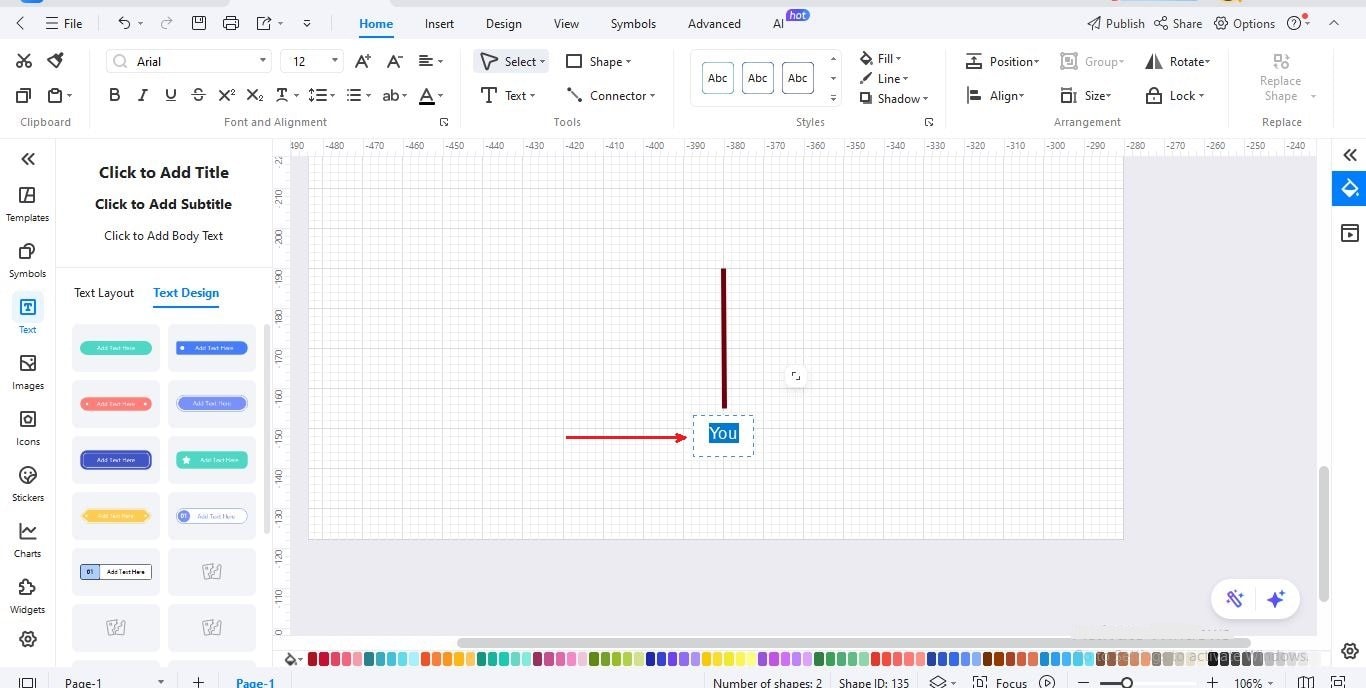
Step2 Add the Main Node
- Insert the first node at the bottom level to represent “You.”
- This will be the base point from which the family lineage branches upward.
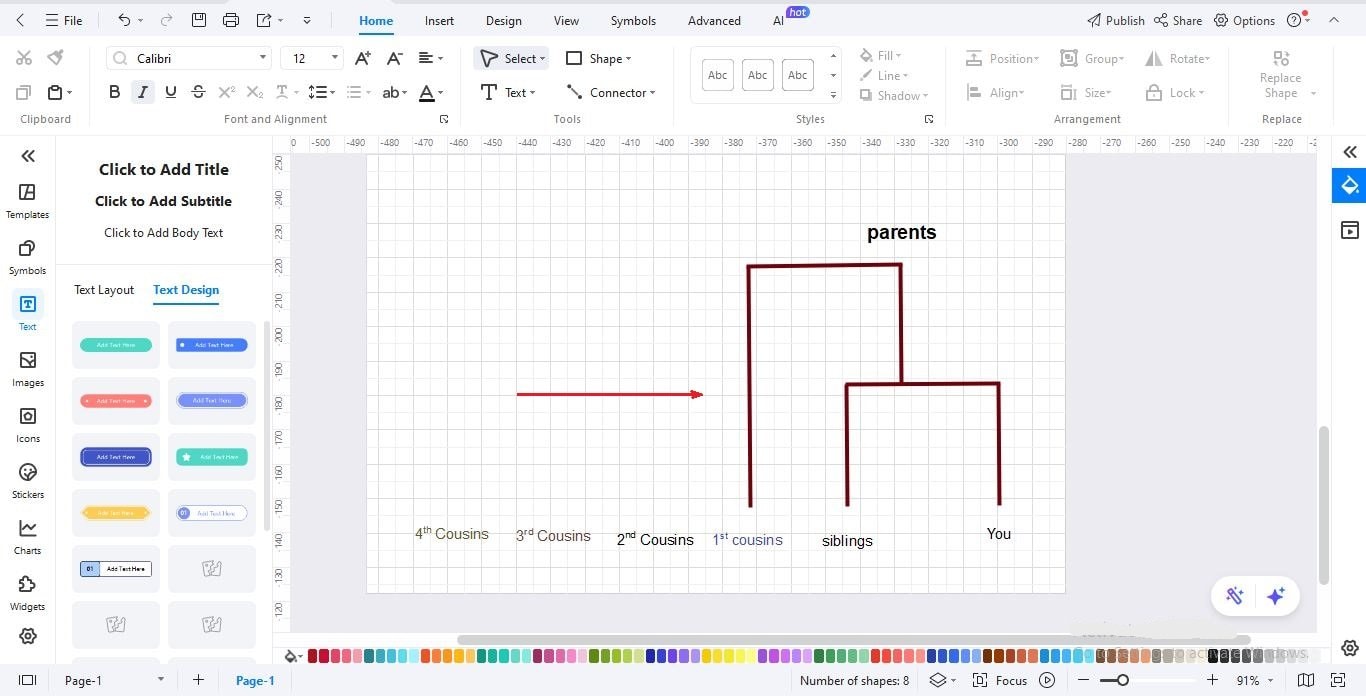
Step3 Add Immediate Family Nodes
- Create a branch from “You” to add your siblings and parents.
- Arrange these nodes horizontally to keep the structure clear and readable.
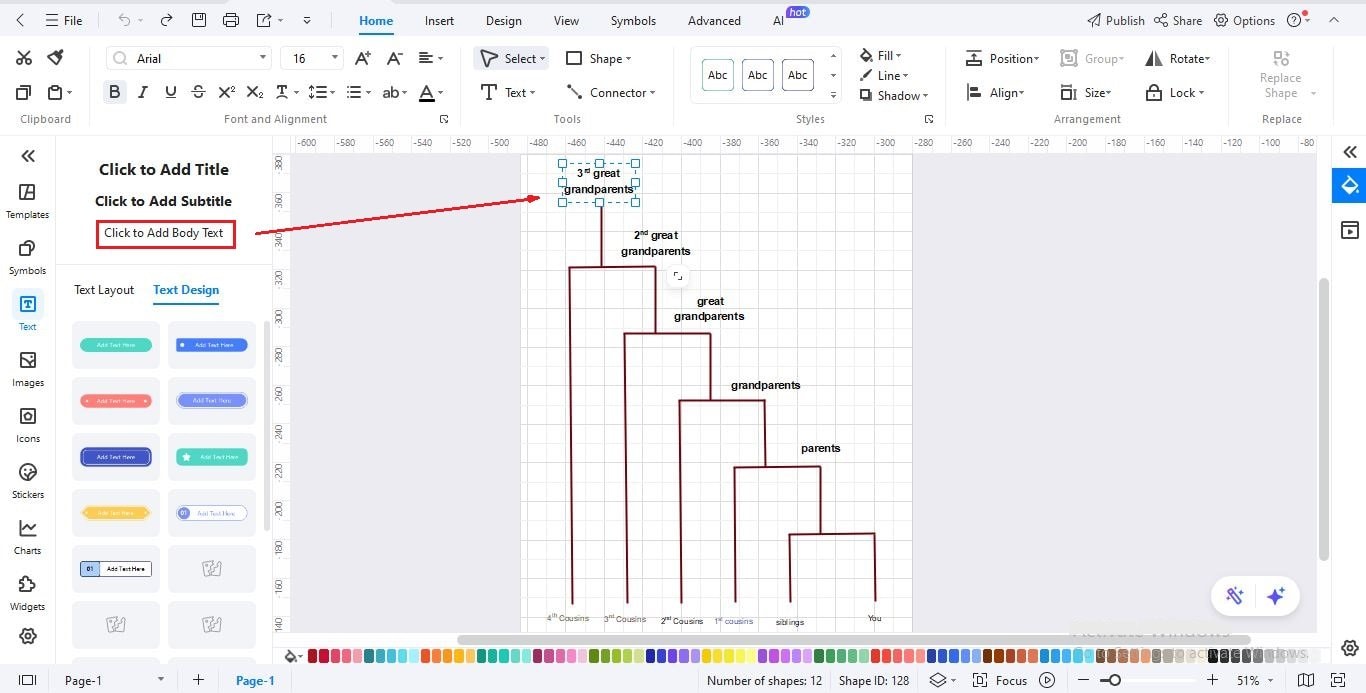
Step4 Expand to Higher Generations
- Extend the diagram upward by adding grandparents, great-grandparents, 2nd great-grandparents, and 3rd great-grandparents.
- Make sure each level is placed above the previous one to show the expanding family lineage.
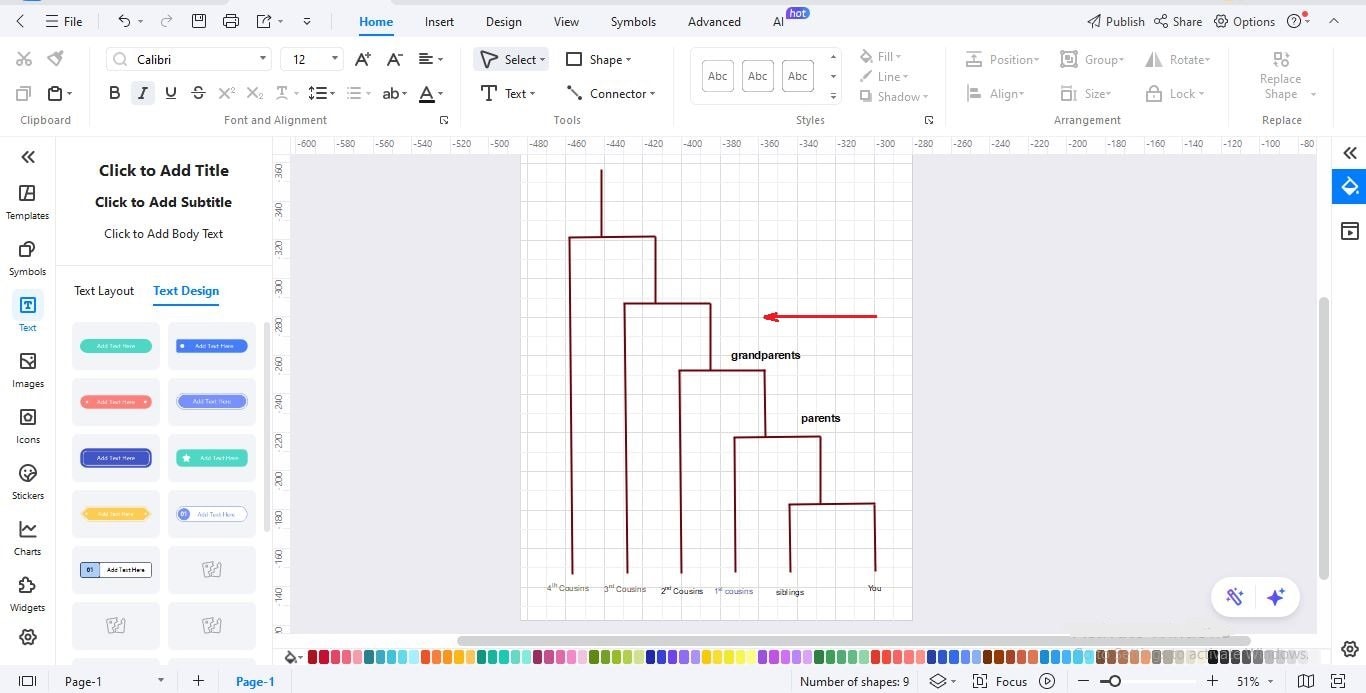
Step5 Label and Customize Nodes
- Click each node to add labels such as “parents,” “grandparents,” or “3rd great-grandparents.”
- Use colors or line styles to visually separate generations or cousin levels if needed.
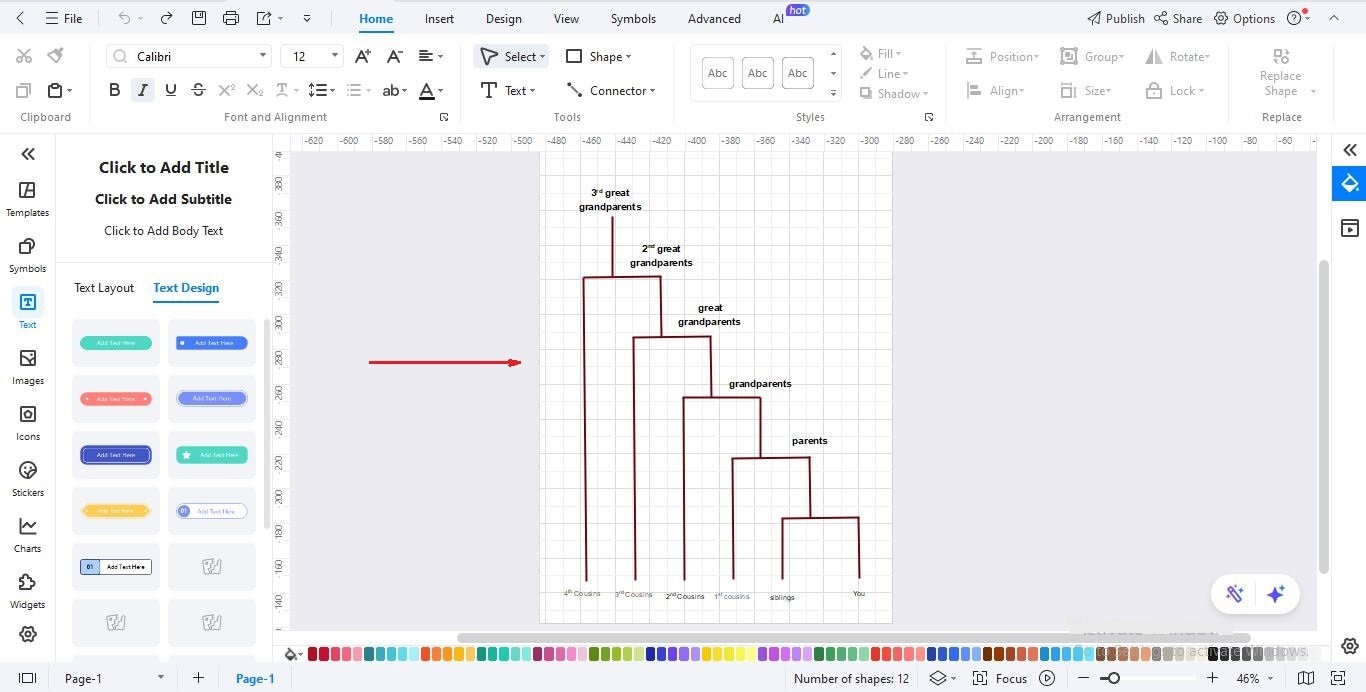
Step6 Review and Adjust
- Check that each generation is aligned properly and that cousin levels (1st, 2nd, 3rd, 4th) match the vertical structure.
- Ensure all connections clearly represent the family hierarchy from bottom (you) to top (ancestors).
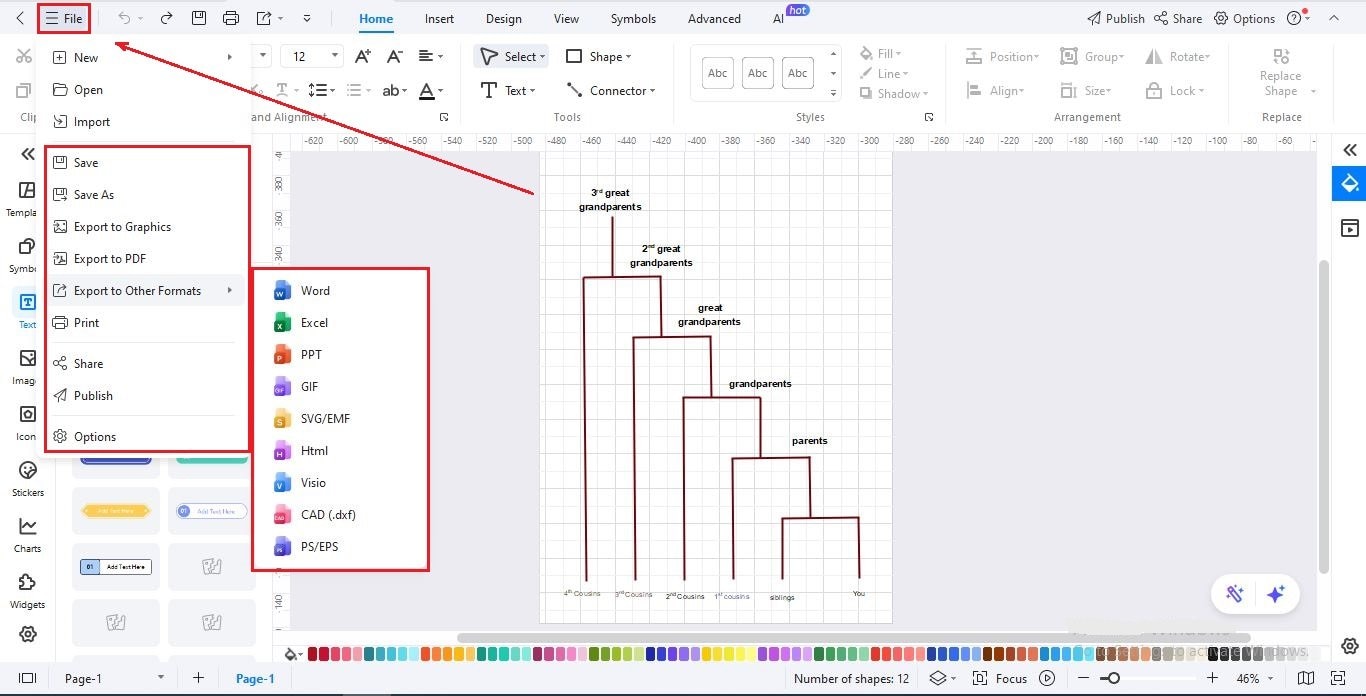
Step7 Save or Export Your Dendrogram
- Save your project for future editing or updates.
- You can also export the family dendrogram as a PNG, JPG, PDF, or editable EdrawMax file for printing or sharing.
Free Dendrogram Templates to Get Started
After learning what a dendrogram is, let’s see some real examples you can use. Dendrograms help organize information clearly, so you can understand relationships or groups at a glance. They are useful for family trees, business data, or even science.
Here are some free dendrogram templates to get you started:
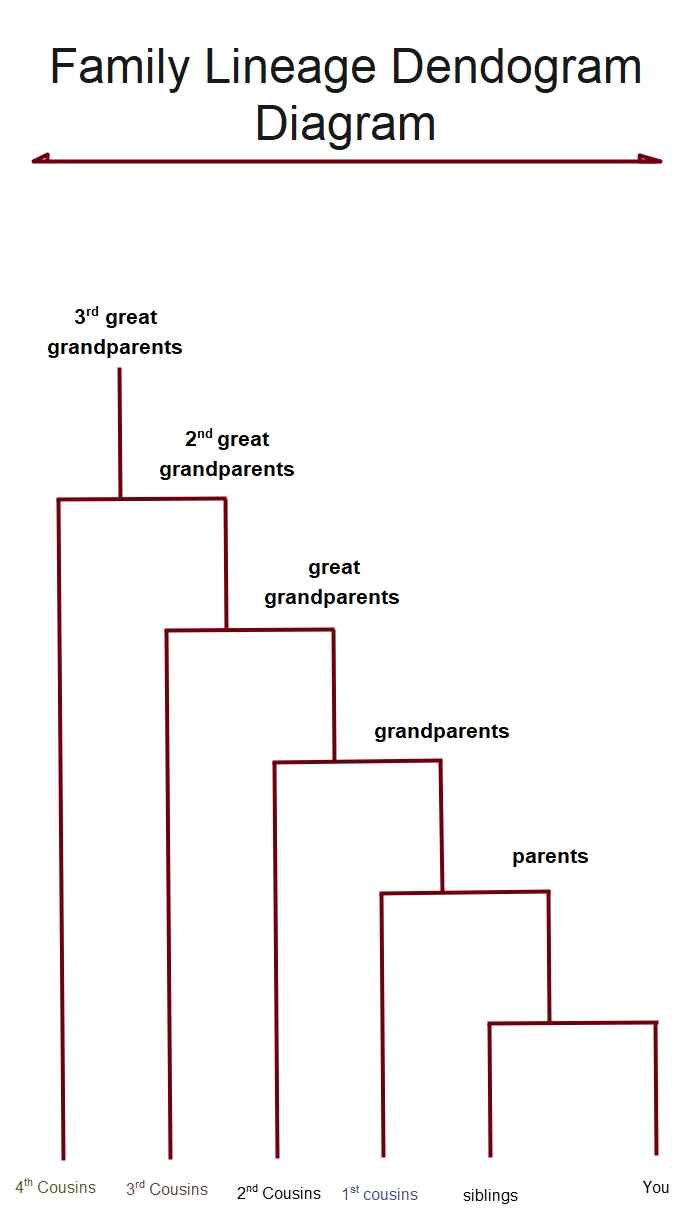
Family Lineage Dendrogram

This dendrogram focuses on how a family connects across generations, starting with a single person and extending up to parents, grandparents, and earlier ancestors. Each branch here shows a clear relationship. It's one simple way to understand family history and see how different members are linked over time in an organized structure.
Business Hierarchy Customer Segmentation Dendrogram
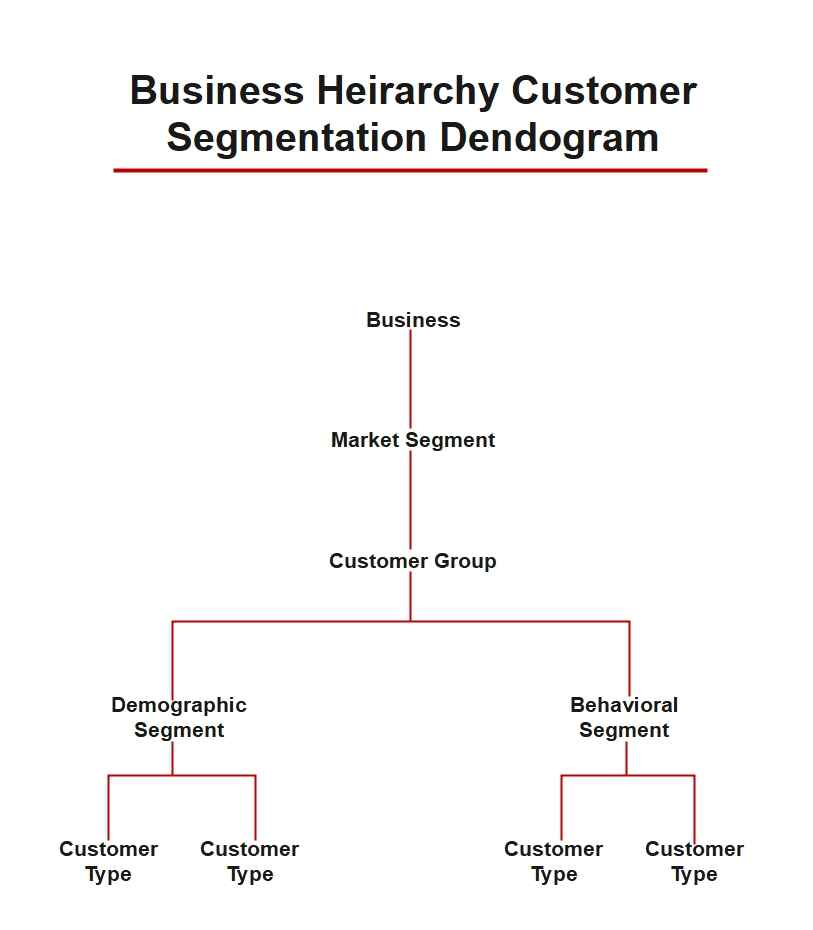
The dendrogram in this example shows how to divide a very large customer base into manageable groups. This dendrogram starts at the top with an overview of the entire business and gradually segments customers into groups and specific types. Each level adds more detail. Such a presentation allows companies to study the behavior of their customers and make wiser decisions because of clear and structured insights.
Academic Biological Classification Dendrogram
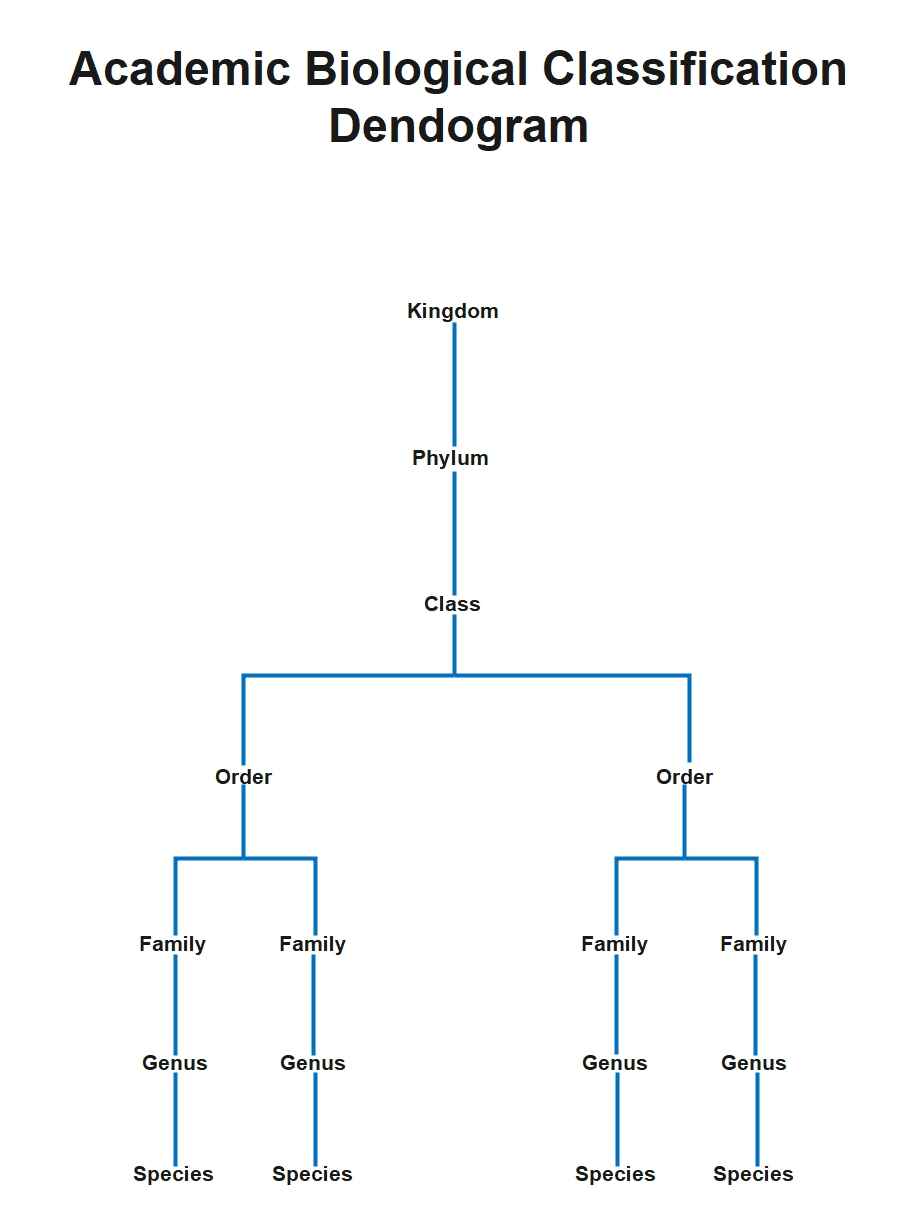
This dendrogram example explains the biological classification of living organisms. It starts from larger to smaller groups, down to species. Each step is a reflection of a closer relationship that helps us understand how different organisms fit together and how life is organized across the biological system.
Closure
A dendrogram is a simple way to show how different items or groups connect. It helps turn complex information into a clear visual structure. Whether you are studying biology, analyzing data, or explaining relationships, a dendrogram makes your ideas easier to understand.
If you want to create a clean and professional dendrogram without any difficulty, EdrawMax is a great choice. You can use free templates, customize them quickly, and export your final diagram in many formats. Try EdrawMax today and make your own dendrogram online for free.
AI Diagram Generator
Enter your prompt. Upload files if needed. Generate diagrams, charts, or slides instantly.


