


"PlantUML is one of the most effective tools for developers when it comes to designing ER diagrams in a text-based format. It offers automated diagram generation, making it ideal for database-driven applications."
In this guide, we will explore how PlantUML simplifies the process of creating ER diagrams by integrating them directly into your codebase. We’ll also discuss alternative tools like EdrawMax, providing you with a comprehensive approach to database design and documentation.
In this article
What is an ER Diagram?
An Entity-Relationship (ER) diagram is a helpful tool for designing databases. It maps data organization. This helps developers, analysts, and architects understand the data's content, structure, and relationships. When creating a new system or documenting an existing one, an ER diagram shows how information is stored and related at a high level.
Common uses of ER Diagrams are:
- Designing relational database schemas
- Communicating established relationships in data models to others
- Examining the normalization/denormalized data strategy of the model
- Validating integrity or referential integrity between an individual database table and other tables
ER diagrams are one of the important steps in all applications that use a data source as their backend. From a small web app to big enterprises, there is a lot of data to manage.
Types of ER Diagrams
- Conceptual ERD: An ERD for just the design with entities and relationships only.
- Logical ERD: An ERD with entity attributes, primary, and foreign keys.
- Physical ERD: The actual table design with the data type for the columns and indices - ready to implement in a DBMS.
Top Benefits of ER Diagrams
- Clear communication with stakeholders
- Helps identify design flaws early
- Improves data integrity and normalization
- Useful documentation for referential and relational constraints.
Why Use PlantUML?
Many traditional drawing tools come with a drag-and-drop feature, but they aren't designed to fit developer workflows. Diagrams saved as binary files are difficult to version, changes are manual, and it's error-prone. PlantUML allows you to take a different approach.
PlantUML is an open-source, text-based diagramming language that allows you to write your diagrams like code. This has several major benefits:
- Easy to maintain as your underlying database changes
- Versionable in git
- Rendered in CI pipelines or directly in docs automatically
- Consistent, reproducible, and easy to automate
PlantUML enables you to include ER diagrams directly into your code base or documents, which can provide "living documentation" (representations that change and evolve with your systems).
Why Developers Prefer It
PlantUML has removed the barrier between documentation and code. You just use plain text to define the entities and the relationship between them instead of establishing yet another app. The syntax of PlantUML is clear, straightforward, and expressive.
It is especially useful when you:
- Want to keep documentation close to your source code
- Need to capture a data model for use in several environments
- Care about consistency, automation, and maintainability
That is why it is a desirable choice for teams practicing documentation-as-code, agile development practices, or automating infrastructure.
Quick Example
@startuml
entity Product {
  +product_id: INT <>
  +product_name: VARCHAR
  +price: DECIMAL(10,2)
}
@enduml
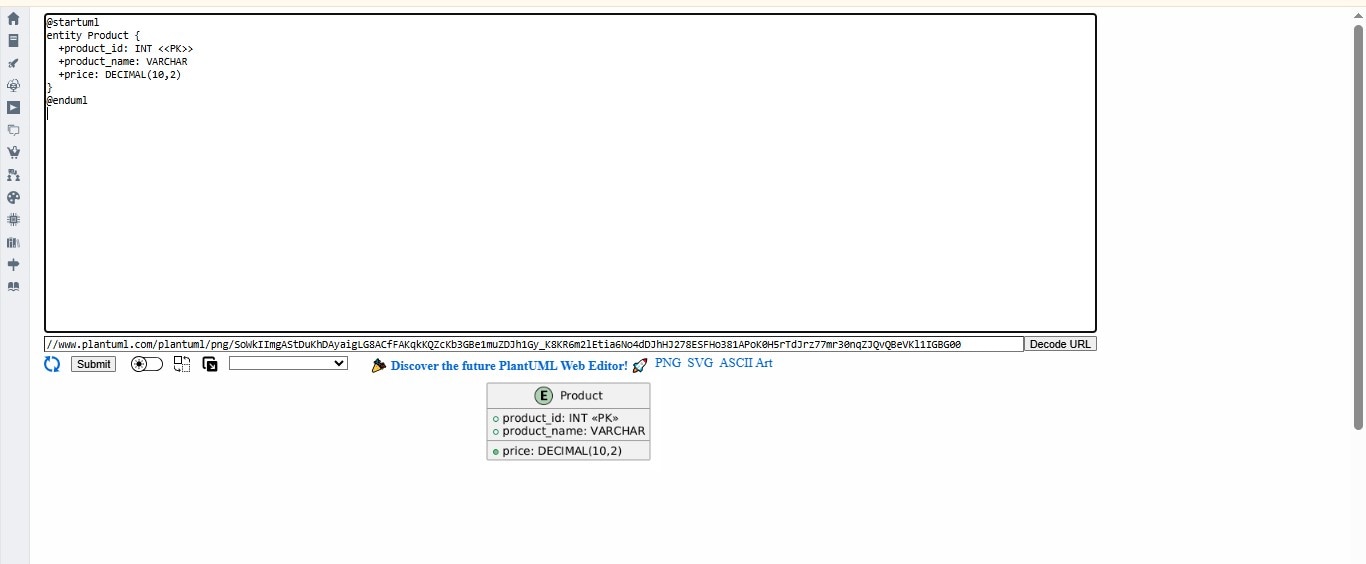
This example portrays a definition of an entity in an ERD. There is an entity called "Product" that contains a primary key (product_id), a name field, and a decimal price column with precision. It's a basic component of an e-commerce or inventory management system.
3 Basic PlantUML Syntax
PlantUML uses a simplified syntax to model ER diagrams clearly and efficiently.
syntax 1Entities
Entities represent database tables. Each is defined using the entity keyword followed by a block of attributes.
Example:
@startuml
entity Employee {
  +emp_id: INT <>
  +first_name: VARCHAR
  +last_name: VARCHAR
  +department_id: INT
}
@enduml

<marks the primary key.> - Attributes are typed to reflect column data types.
+implies visibility (commonly used to denote columns exposed in queries or APIs).
syntax 2Attributes
Attributes are columns in the table.
Key markers:
<— Primary Key> <— Foreign Key (when used in relationships)> <— Unique constraint>
Supported Data Types:
- INT
- VARCHAR(n)
- DATE
- BOOLEAN
Example:
entity Department {
  +dept_id: INT <>
  +dept_name: VARCHAR <>
  +location: VARCHAR <>
}
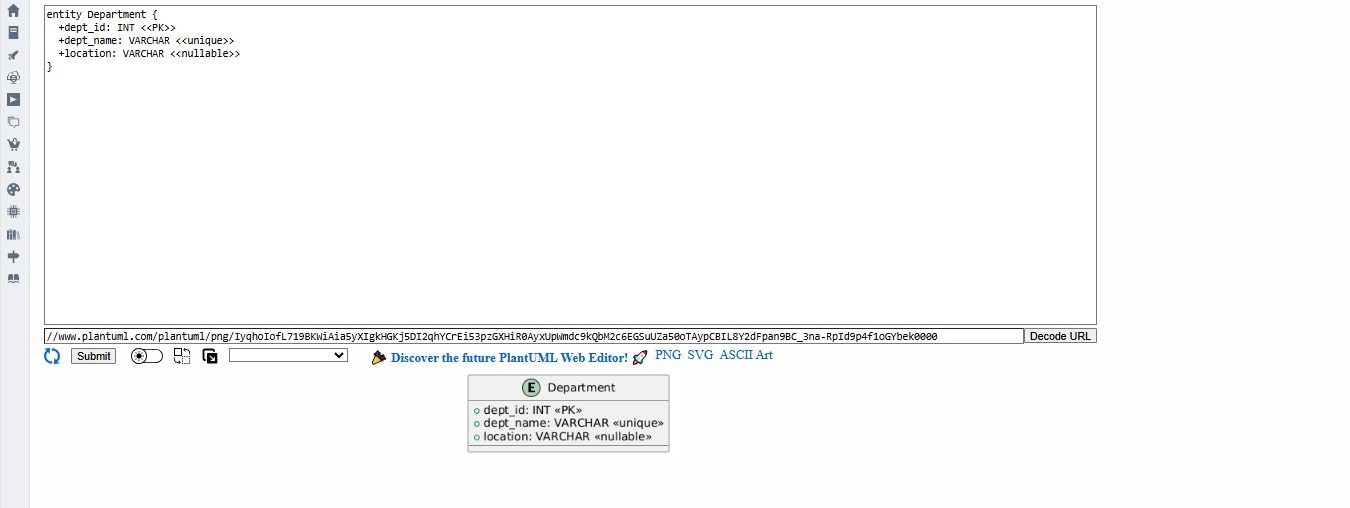
Columns can be annotated for uniqueness, nullability, or data type expectations. These are not rendered, but they are semantically helpful.
syntax 3Relationships
Relationships are defined outside entities using line connectors and cardinality symbols.
Cardinality Symbols:
||--||→ One-to-One||--o{→ One-to-Many}|--|{→ Many-to-Many
Example:
@startuml
Employee ||--o{ Department : "belongs_to"
@enduml
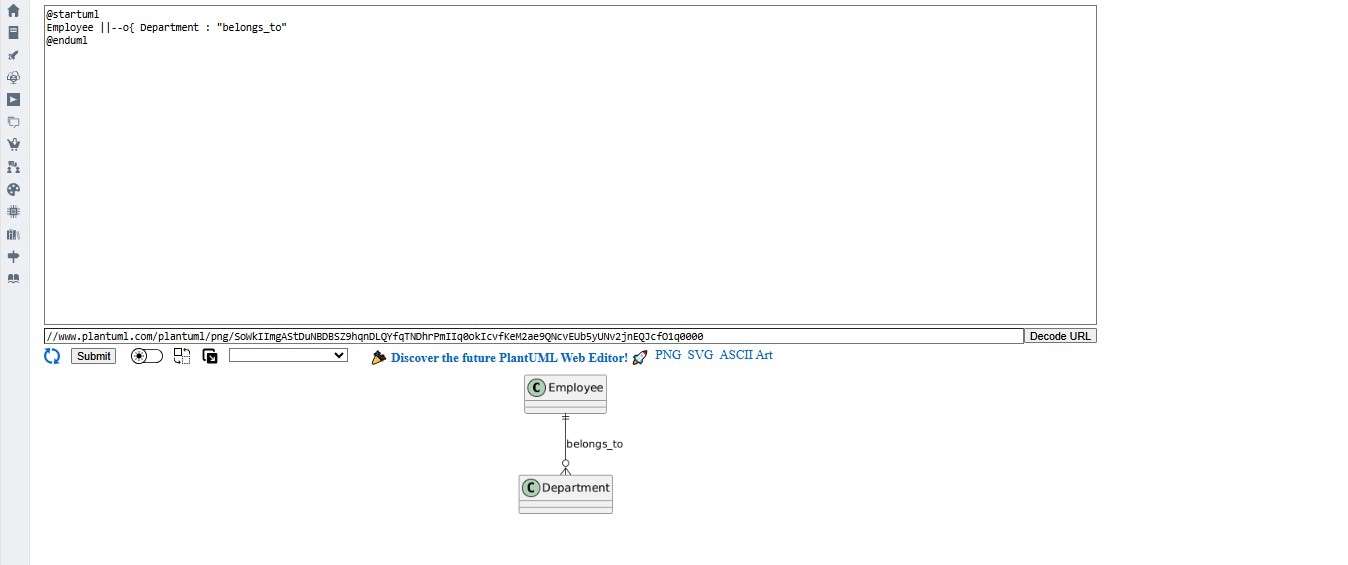
In this example, many employees belong to one department.
5 Advanced PlantUML Techniques
PlantUML allows you to define more than just simple relationships. You can model weak entities, special attributes, and even constraints.
Technique 1Weak Entities
A weak entity depends on a strong entity for its identification. For example, "Dependent" cannot exist without an associated "Employee".
@startuml
entity Dependent {
  +emp_id: INT <>
  +name: VARCHAR
  +relation: VARCHAR
}

Dependent }|--|| Employee : "supported_by"
@enduml
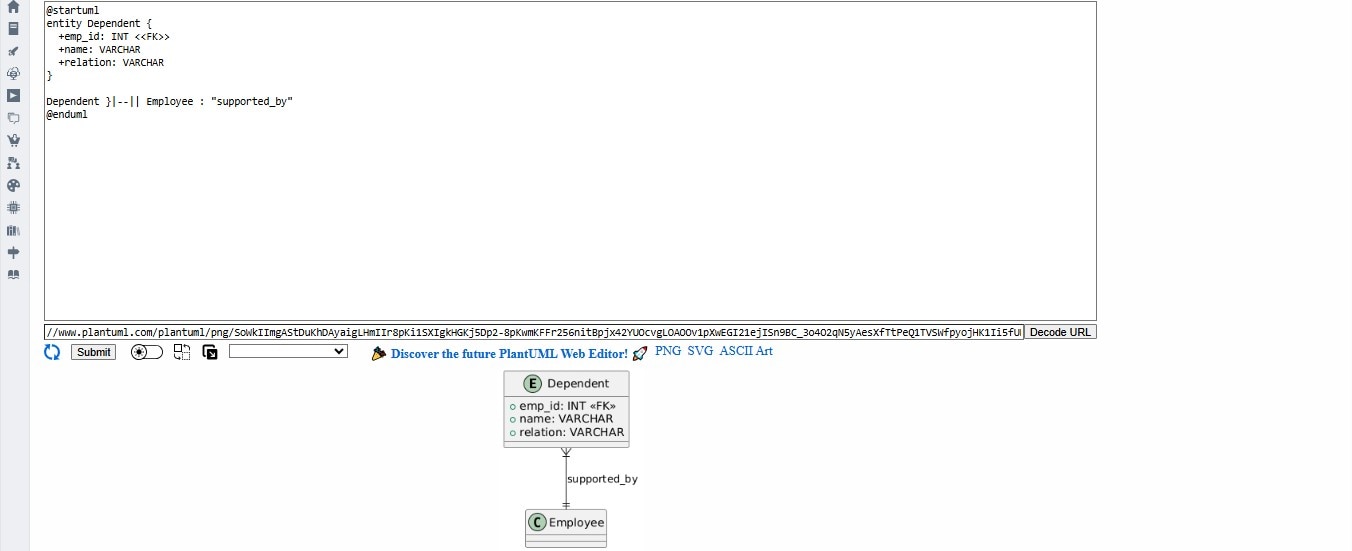
Here, emp_id acts as both a foreign key and part of a composite key.
Special Attributes:
PlantUML allows you to express richer semantics in your ER diagrams using annotations and naming conventions. While these don't enforce database logic, they help document intent for developers and DBAs.
Technique 2Multi-valued
Multi-valued attributes represent sets or lists stored per record, often modeled as separate entities, but can be expressed inline for clarity.
@startuml
entity Article {
  +article_id: INT <>
  +title: VARCHAR
  +tags: VARCHAR(20)[]
}
@enduml
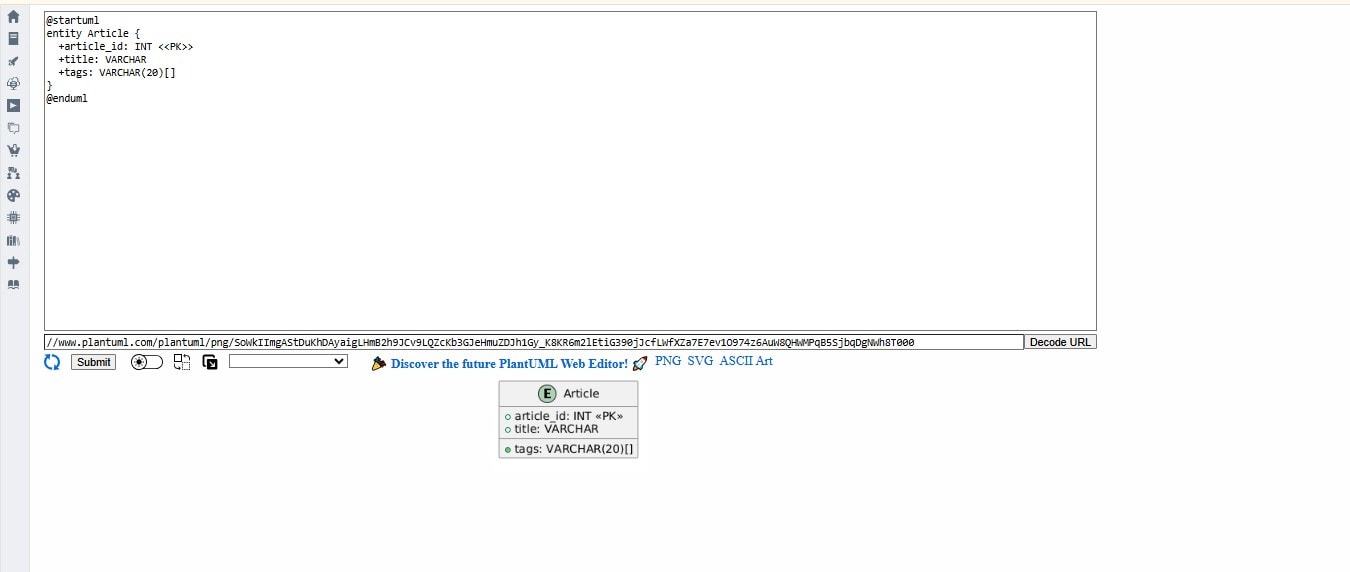
Here, tags is a multi-valued attribute (an array or list of strings), used to describe categorization or labeling.
Technique 3Derived Attributes
Derived attributes cannot be stored in the table as they are calculated at runtime.
@startuml
entity Invoice {
  +invoice_id: INT <>
  +unit_price: DECIMAL
  +quantity: INT
  /total_cost: DECIMAL
}
@enduml
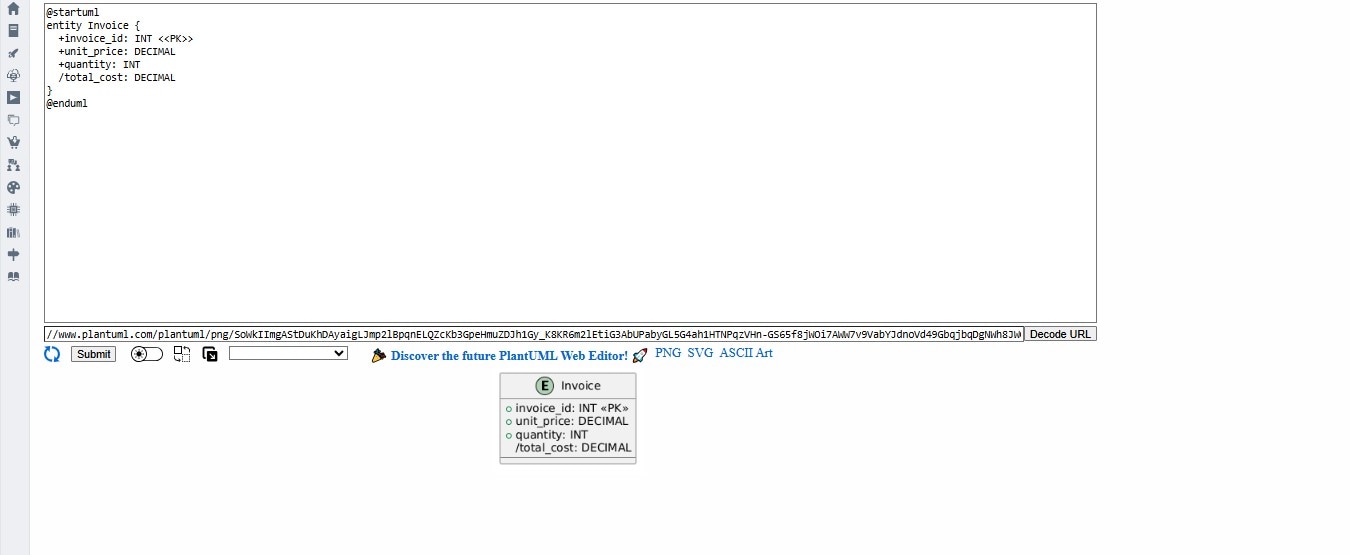
- The /total_cost attribute implies that it is derived (e.g., unit_price × quantity) and not stored directly.
- The slash (/) is a common convention for derived fields.
Technique 4Constraints with Annotations
Attributes can be annotated to communicate minimums, uniqueness, or other constraints:
@startuml
entity Inventory {
  +item_id: INT <>
  +stock_level: INT <>
  +location_code: VARCHAR <>
}
@enduml
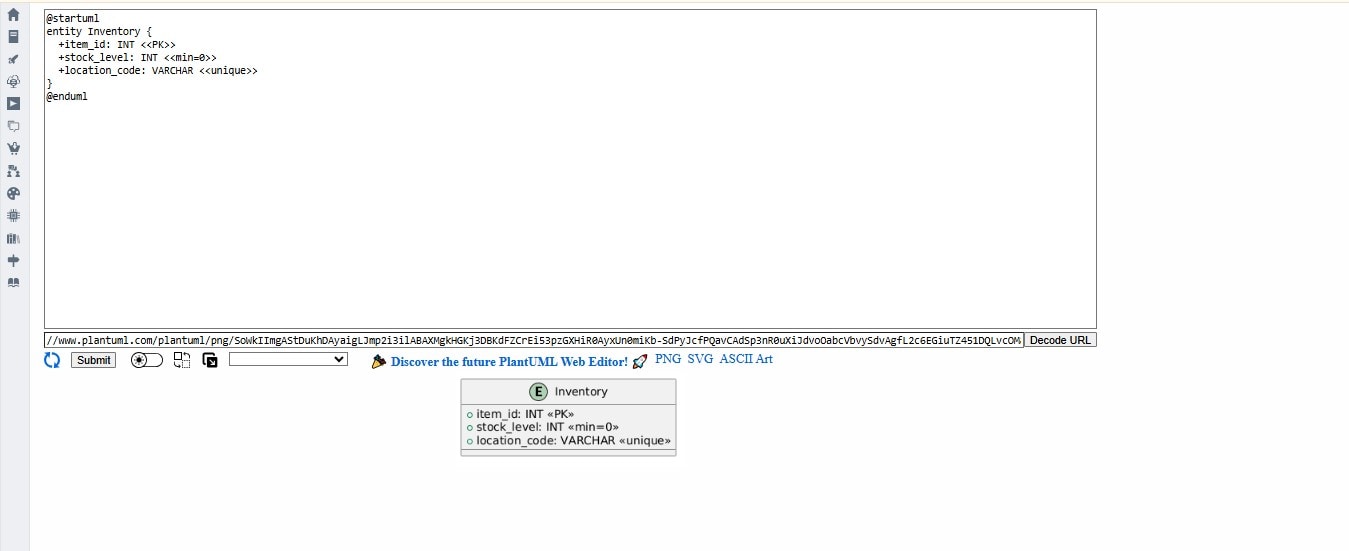
<indicates a non-negative constraint (helpful for numeric fields like stock).<is a field that must be unique (example: SKU, username, or email).>
These tags are a way to document intent, confirm assumptions of other users, and aid downstream implementation (e.g., design in SQL or ORM mappings). And they can express a richer set of data modeling rules and complete your diagrams.
Technique 4Ternary Relationships
You can model a many-many relationship that involves three entities via an associative table:
@startuml
entity Student {
  +student_id: INT <>
  +name: VARCHAR
}

entity Course {
  +course_id: INT <>
  +title: VARCHAR
}

entity Enrollment {
  +student_id: INT <>
  +course_id: INT <>
  +semester: VARCHAR
}

Student ||--o{ Enrollment
Course ||--o{ Enrollment
@enduml
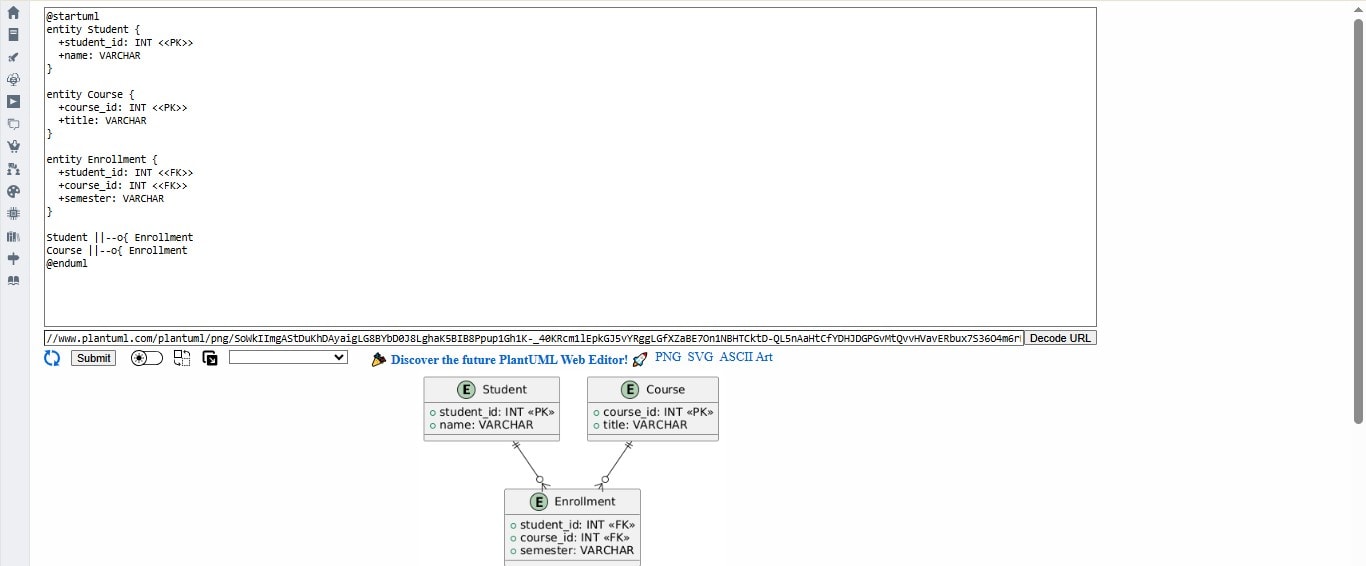
This depicts the flow of students enrolling in courses, with an added dimension of the semester.
Technique 5Styling & Layout
Styling makes diagrams more readable, especially in complex schemas.
Change Direction:
By default, diagrams are top-down, but you can switch to horizontal.
@startuml
left to right direction
@enduml
This is helpful when you have wide schemas.
Custom Colors and Layout:
To adjust the look and feel of your diagrams as per your preference, use skinparam to style your entities:
@startuml
skinparam entity {
   BackgroundColor #E8F5E9
   BorderColor #2E7D32
   FontSize 12
}
@enduml
This helps visually group related entities or highlight important ones and changes the background color, border color, and font size of your ER diagram for better clarity and presentation.
Top 3 Practical ER Eiagram Examples
Example 1Inventory System
Here's an ER diagram for a simplified inventory system:
@startuml
entity Supplier {
  +supplier_id: INT <>
  +company_name: VARCHAR
  +contact_email: VARCHAR
}

entity Product {
  +product_id: INT <>
  +name: VARCHAR
  +price: DECIMAL
  +supplier_id: INT <>
}

entity Warehouse {
  +warehouse_id: INT <>
  +location: VARCHAR
}

Product ||--|| Supplier : "supplied_by"
Warehouse ||--o{ Product : "stores"
@enduml
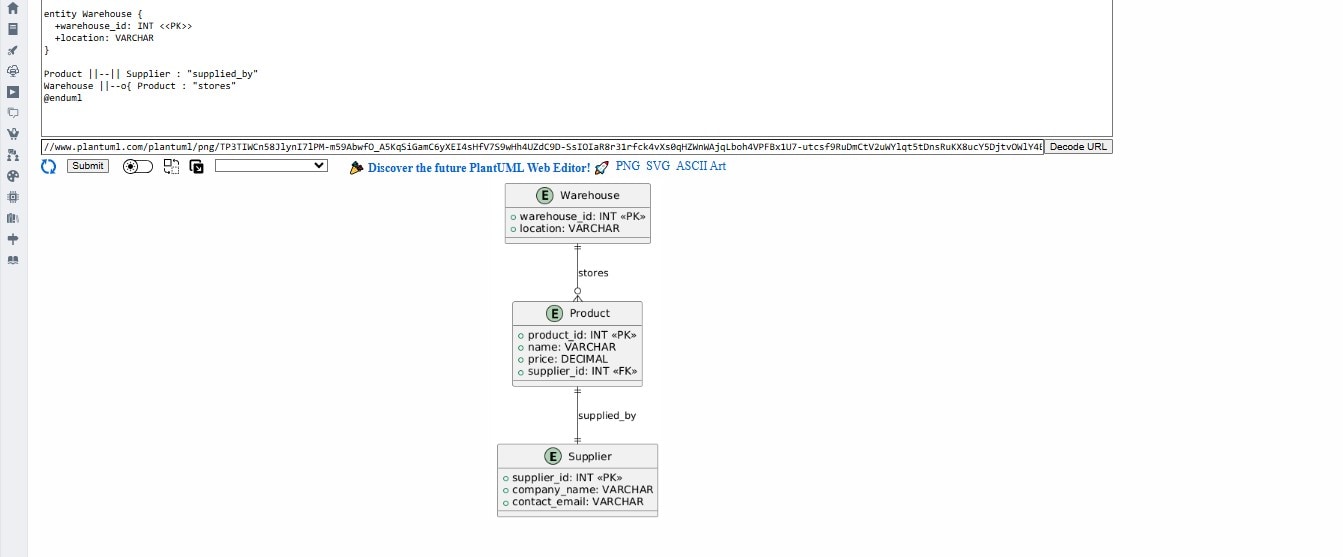
This code snippet shows a good example of a many-to-many relationship between two entities, such as products and warehouses, and displays how products are being stored in the warehouses and then their connection with the suppliers.
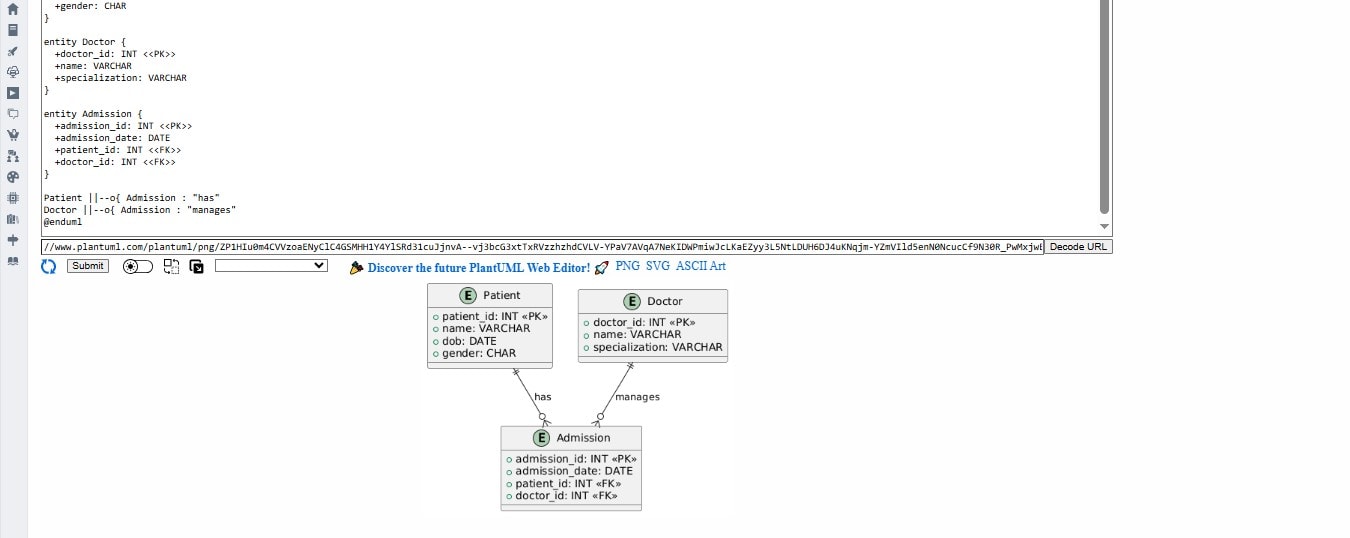
Example 2Hospital Management System
This hospital management system ER diagram illustrates the relationship between patients, admissions, and the accountability of physicians. It clearly defines how patients are admitted by doctors, with records tracked across three tables. So it is ideal for modeling healthcare systems, medical databases, or clinic applications.
@startuml
entity Patient {
  +patient_id: INT <>
  +name: VARCHAR
  +dob: DATE
  +gender: CHAR
}

entity Doctor {
  +doctor_id: INT <>
  +name: VARCHAR
  +specialization: VARCHAR
}

entity Admission {
  +admission_id: INT <>
  +admission_date: DATE
  +patient_id: INT <>
  +doctor_id: INT <>
}

Patient ||--o{ Admission : "has"
Doctor ||--o{ Admission : "manages"
@enduml
Example 3Online Learning Platform
Here's a scenario for a learning management system (LMS) where students enroll in courses, and instructors create them.
@startuml
entity Student {
  +student_id: INT <>
  +full_name: VARCHAR
  +email: VARCHAR <>
}

entity Instructor {
  +instructor_id: INT <>
  +name: VARCHAR
  +department: VARCHAR
}

entity Course {
  +course_id: INT <>
  +title: VARCHAR
  +credits: INT
  +instructor_id: INT <>
}

entity Enrollment {
  +student_id: INT <>
  +course_id: INT <>
  +enroll_date: DATE
}

Student ||--o{ Enrollment
Course ||--o{ Enrollment
Instructor ||--o{ Course : "teaches"
@enduml
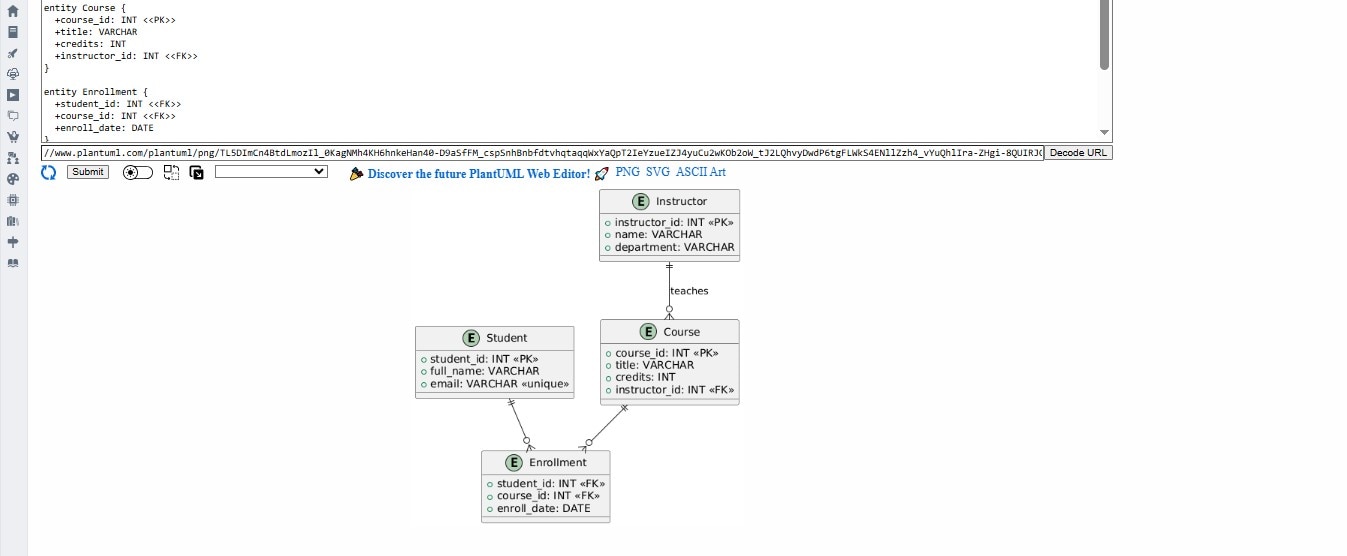
This model shows a many-to-many relationship between students and courses via an Enrollment table. Each course is also linked to the faculty member assigned to teach it. For more insights into university system design, explore 10 ER Diagram Templates for University Management Systems.
Pro Tips
- Use a package to group related entities:
package "HR" { entity Employee { ... } entity Department { ... } } - Use 'hide empty members' to clean up empty entities.
- Keep file names aligned with your schema version: 'schema_v1_2.puml'
- Use '!include' for modular design across large databases
You must remain organized, readable, and maintainable when working with larger or more complex data models, ER diagrams, or evolving data models. You can group related entities in PlantUML by module or domain, like sales, finance, or human resources, by using the package keyword. This improves clarity and enables your teams to concentrate on a single system component at a time.
Clean up diagrams further and remove some of the visual clutter by using hide empty members, which can be useful or practical when you have devices that have not yet created attributes. Filename schema versions (i.e., schema_v1_2.puml) are typically a good practice for version control and documentation tracking.
It allows you to develop your repository and subjectively notice the differences over time. For significantly large systems, simply modularize your diagrams by using! include. This will allow you to reference smaller files with the corresponding entities (i.e., each department would have a module for their assets) and develop across different iterations without overwriting existing components.
It also fosters better collaboration for multiple developers and reuse between projects. These little habits add up to your gains over time as your system gathers momentum, decreasing your chance of collaboration failure, diminishing the likelihood of diagram bloating, and avoiding confusion in reciprocity. These strategies help when working on large or evolving data models.
When to Consider Alternative: EdrawMax
While PlantUML is great for developers, EdrawMax offers several advantages that might be better suited for different use cases. Consider EdrawMax or other alternatives if:
- You need real-time collaboration with business users
- You want a drag-and-drop GUI design
- Your team isn't comfortable with writing diagrams in code
- You require pixel-level visual polish
- You're presenting diagrams to non-technical stakeholders
- You require an integrated database schema generation
PlantUML Limitations
- Limited visual customization: Compared to GUI tools, fine-grained control is harder.
- Steeper learning curve for complex ERD logic (e.g., recursive relationships, triggers).
- No live preview unless configured: You'll need CLI tools or IDE plugins.
- Not ideal for non-technical stakeholders who prefer visual-first interfaces.
- No native enforcement of keys or constraints, i.e., the diagrams are visual only.
- Not interactive, so you can't click through to documentation like in some GUI tools.
However, among most developers and technical groups, the trade-offs are worth it because of the automation and version control advantages.
GUI Tool Options
While PlantUML is an excellent text-based tool for developers, some teams are likely working with GUI tools—especially when they are working episodically with Business Analysts, designers, or stakeholders who are less familiar with code.
Common Examples of GUI-Based ER Diagram Tools:
- EdrawMax: Has industry-standard symbols, templates, and database connectors. A good fit for IT teams and educators.
- Lucidchart: A marginally less aged product, which includes real-time cooperation, contemporary client experience, and is consolidated with Microsoft 365, Atlassian, and Google Workspace.
- Draw.io (Diagrams.net): This one is a free web-based (and with an offline counterpart) program that is synced with Google Drive and offers options for exporting.
Highlighted Advantages:
- WYSIWYG Editing: You see what you get, so ideal if you are not a textual thinker.
- Live Collaboration: It has a high number of team members who can comment and co-edit in real-time.
- Easy-Print Output: Print anything you formatted, with ease, to clients or reports, or training.
- Presentation-Ready Output: Easily output whatever you have formatted for clients, reports, or training.
Consider GUI Tools When:
- You are working on client-facing documentation, and there is an expectation of visual polish.
- You want technical and non-technical collaborators to update or comment on a database visual diagram.
- Your project involves frequent stakeholder presentations, demos, or workshops.
- You prefer point-and-click interactions over typed syntax.
GUI tools, while not versioned or capable of CI/CD automation like PlantUML, are useful tools for quick visualizations, design reviews, or other team alignment sessions.
Summary
PlantUML is a practical and effective tool to automatically create ER diagrams from code, which is helpful for many modern development teams that work with Git repositories, CI/CD pipelines, and markdown-based documentation, often in the form of living documentation, whereby treating diagrams as code allows them to truly remain living documentation—visuals that are updated in the same process and no longer stale or fake.
The advantages of PlantUML are in regards to automating diagrams, having diagrams stored in code under version control, and collaborating with colleagues using only text. The diagrams themselves can be built and plugged into the wikis or README files, and they are also tracked like any other file of source code. All these advantages make PlantUML a unique option for a backend developer, data engineer, or the DevOps team using Agile, DevOps, or documentation-as-a-code style.
However, PlantUML can hardly be called a magic bullet. For non-technical stakeholders, in client status meetings or during quick visual brainstorming, GUI-based diagramming tools like Lucidchart, EdrawMax, or Draw.io may be a desirable method to produce visual outputs. They have nice interface GUIs that do not require knowledge of markup, and the pronounced visual style that can be explained or reviewed verbally, as it was merely a given. As you can see, the optimal tool is the one that you are in the stage of working with. Briefly put, you are in the best position to consider PlantUML in a case where your scenario revolves around source control precision, repeatability, and documentation.
In cases when communicating with business teams or presentation-quality diagrams are equally important, consider combining them with GUI tools. Together, they provide a solid and balanced diagramming solution.
AI Diagram Generator
Enter your prompt. Upload files if needed. Generate diagrams, charts, or slides instantly.


