A fishbone diagram is also known as a cause-and-effect diagram. It was developed by Dr. Kaoru Ishikawa in the 1960s. He used these diagrams in most problem-solving scenarios. Later on, it was used in other fields and for other purposes.
It is used to solve problems and brainstorm ideas or find reasons to resolve an issue. Ishikawa diagram or a fishbone diagram is a great tool to visualize all the aspects of a problem. This type of diagram comes in handy when the conversations are not getting to a result. A fishbone diagram eliminates confusion and brings good value.
In this guide, we are going to discuss methods to create fishbone diagrams along with their benefits and what could be the best use cases for these diagrams.
In this article
What is a Fishbone Diagram?
A fishbone diagram is a great tool to identify a problem in a company or find the root causes of a project failure. The shape of the diagram just looks like a fish and its bones. That is why this diagram is called the fishbone diagram. There are many more use cases like brainstorming ideas and planning for a new project.
It is being used in different fields like technology, healthcare, education, and service industries. The think tank body sits together to discuss issues and their probable results through fishbone diagrams as well. They are also being used in online marketing strategies where people use these diagrams to make decisions and talk about quality assurance.
Benefits of a Fishbone Diagram
When it comes to problem analysis, there is no better tool than a fishbone diagram. Here are some of the benefits of the fishbone diagram.
- Visualization: Fishbone diagram offers a clear diagram that shows ideas and provides clarity to understand a problem. When team talks fail, a visually appealing fishbone diagram plays a key role in finding solutions.
- Improve understanding: A fishbone diagram is a great tool to understand things clearly and help every listener or a team member to understand the model. This diagram is used in large industries to brief their workers to have a better understanding.
- Helps Understand the bottlenecks: One of the most prominent benefits of the fishbone diagrams is that they help you identify the bottlenecks that restrict the flow of your work. You can eliminate them in the next projects to find better results.
- Opportunities for improvement in your project: A fishbone diagram or cause and effect diagram would be quite helpful to find errors and create room for improvement after resolving the issues. You can work on different areas of the project to focus more on getting good results.
How to Make a Fishbone Diagram in General
Fishbone diagrams are made using different methods. Multiple tools are being used to create and design different diagrams. Most of the tools have supportive elements and components that help you create your design.
EdrawMax is easier to use and allows you to save your designs easily. The tool offers components when you select the type of your diagram. For example, you need a fishbone diagram that is going to show all the relevant tools or components to get things done. You can maneuver things quickly and size them up and down wherever needed.
All you need to do is to follow the below-given steps to create a fishbone diagram.
Step 1
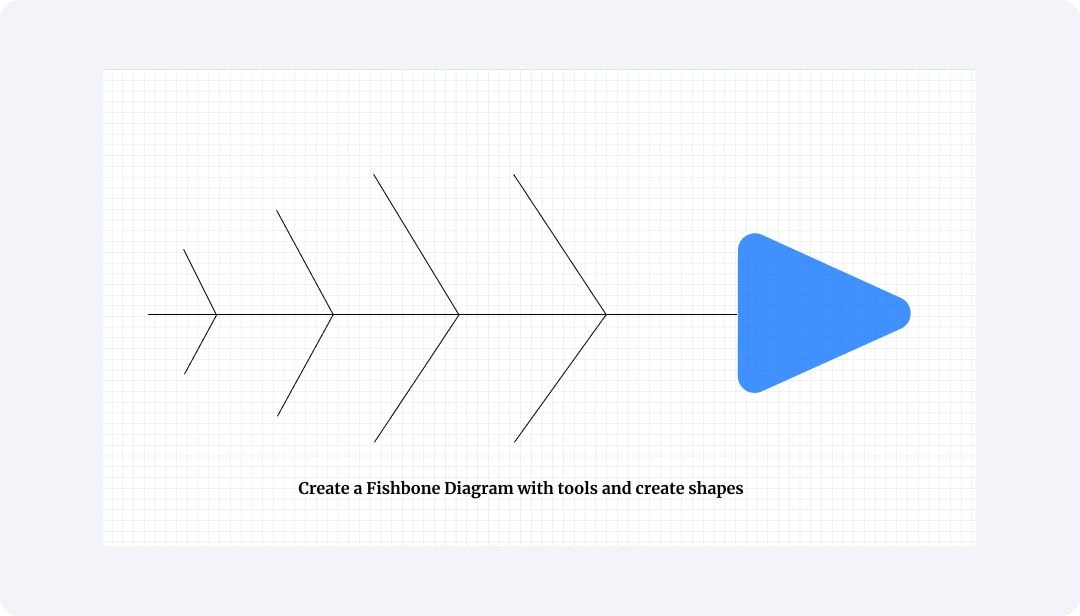
Start by adding elements and shapes on the canvas from where you are designing your fishbone diagram.
Step 2
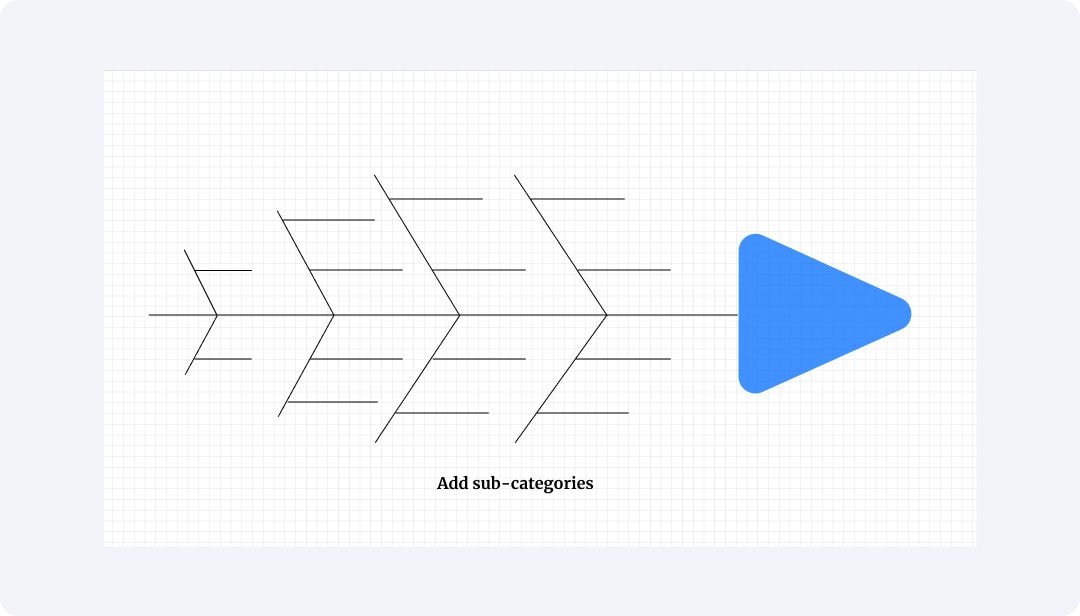
Add subcategories to the main categories so that your discussion gets wider.
Step 3
Add descriptions for categories and subcategories in the diagram. You need to write them in different colors to make them visible.
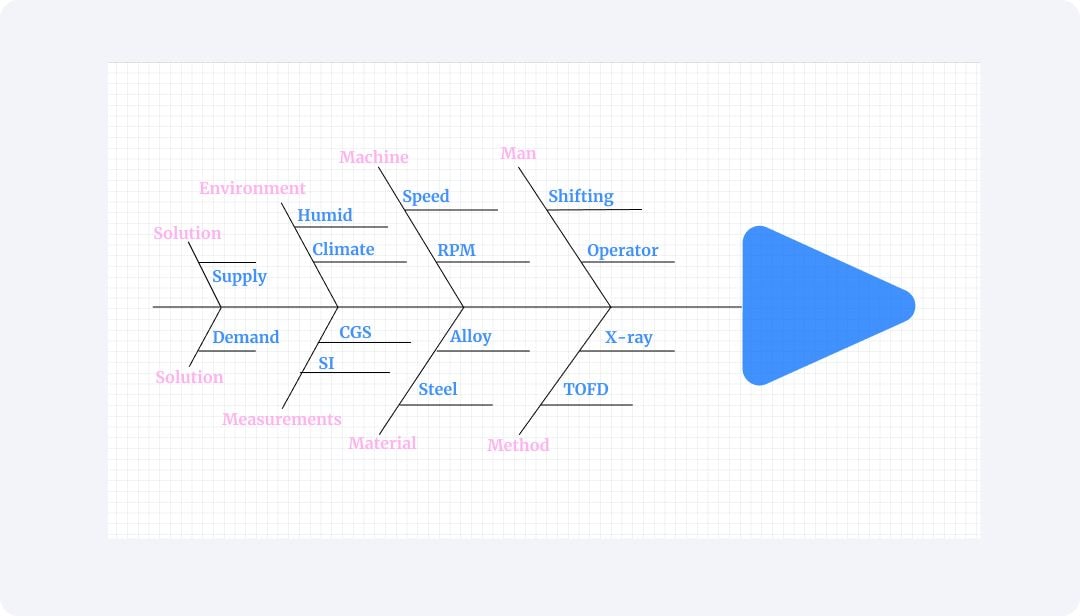
Now, your fishbone diagram is complete and ready to be exported and printed. However, here is another method that offers all the tools to create a good fishbone design with ease. You don't need to draw anything as there are multiple tools that need to be placed correctly. It might be time-saving to use EdrawMax.
How to make a Fishbone Diagram in EdrawMax?
EdrawMax is a comprehensive and complete tool to create 210+ types of diagrams. You can create different shapes as all the elements are already there in the software for you to use. All you need to do is toggle things here and there to get your designs ready. Just like any other diagram, you can make a fishbone diagram through EdrawMax.
Follow the below-given steps to create your fishbone diagram.
Step 1
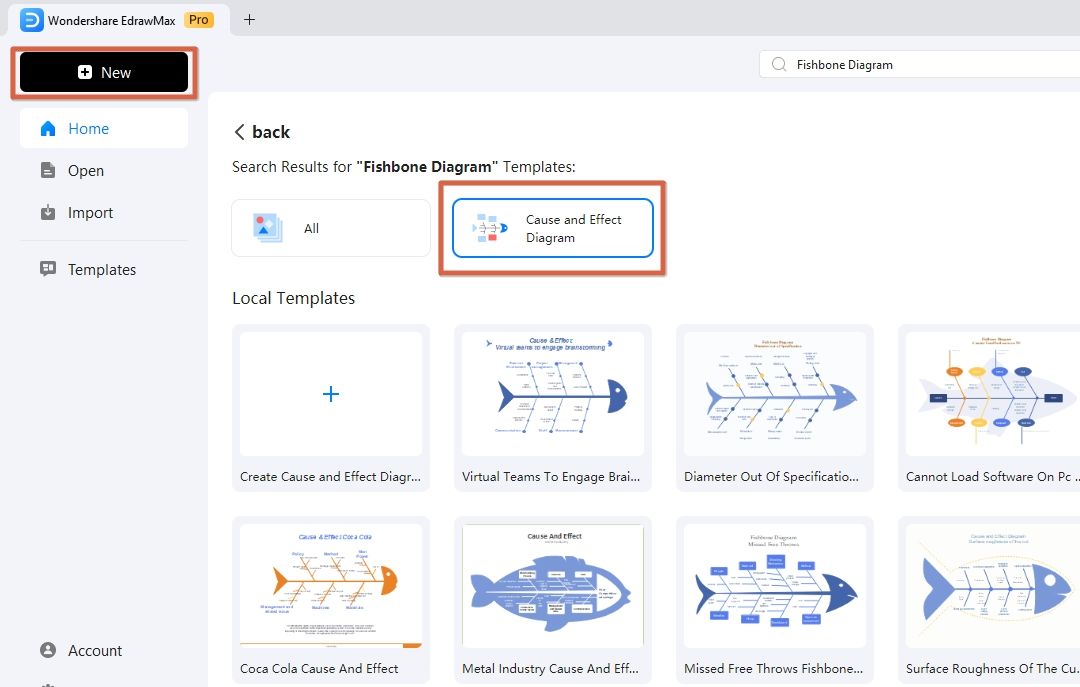
Open EdrawMax, Click New, and find the fishbone diagram or "cause and effect" diagram.
Step 2
Now start dragging elements on the canvas one by one and place them where they are needed.
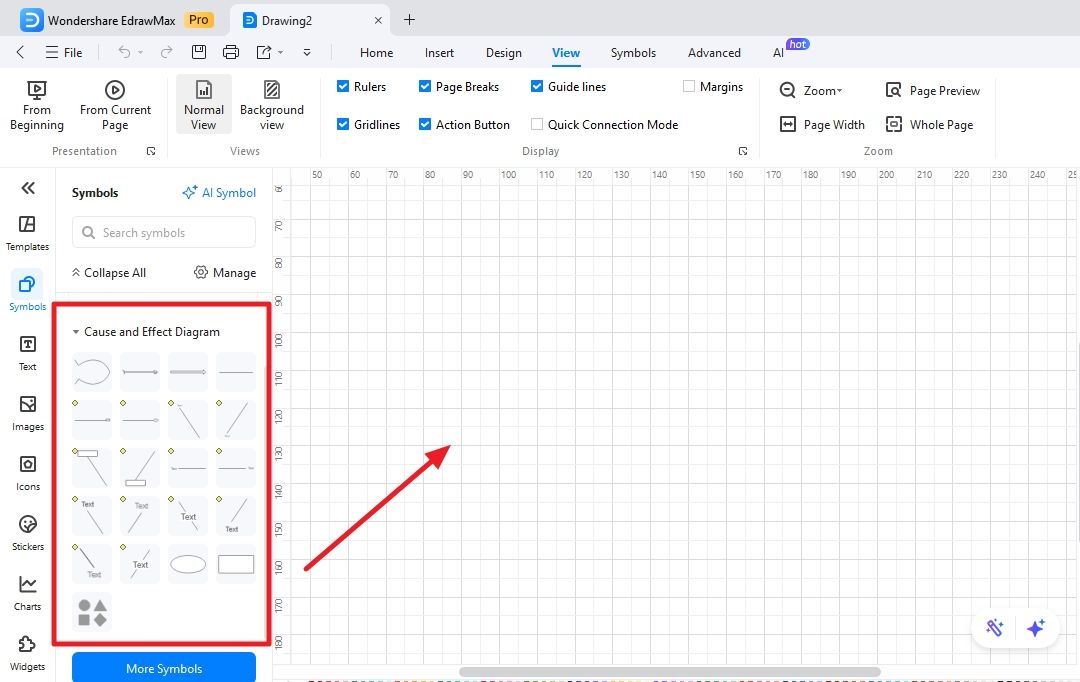
Step 3:
Arrange all the elements added to the diagram and make them visually in sync so that your final design is more attractive.
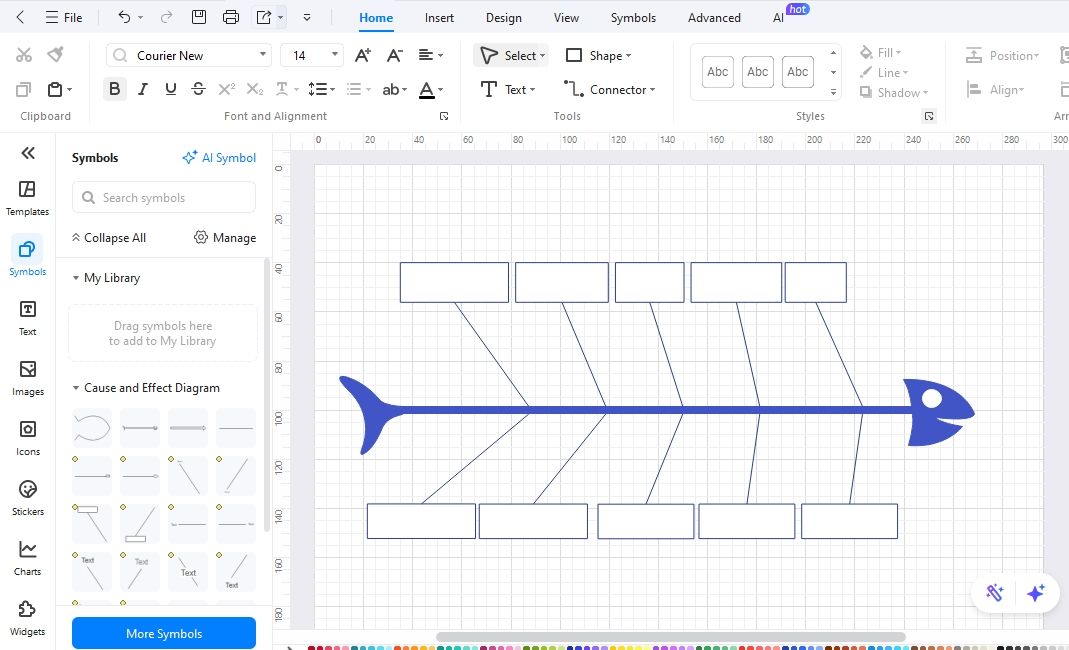
Step 4
Now, label the diagram and add all the necessary information needed for your design.
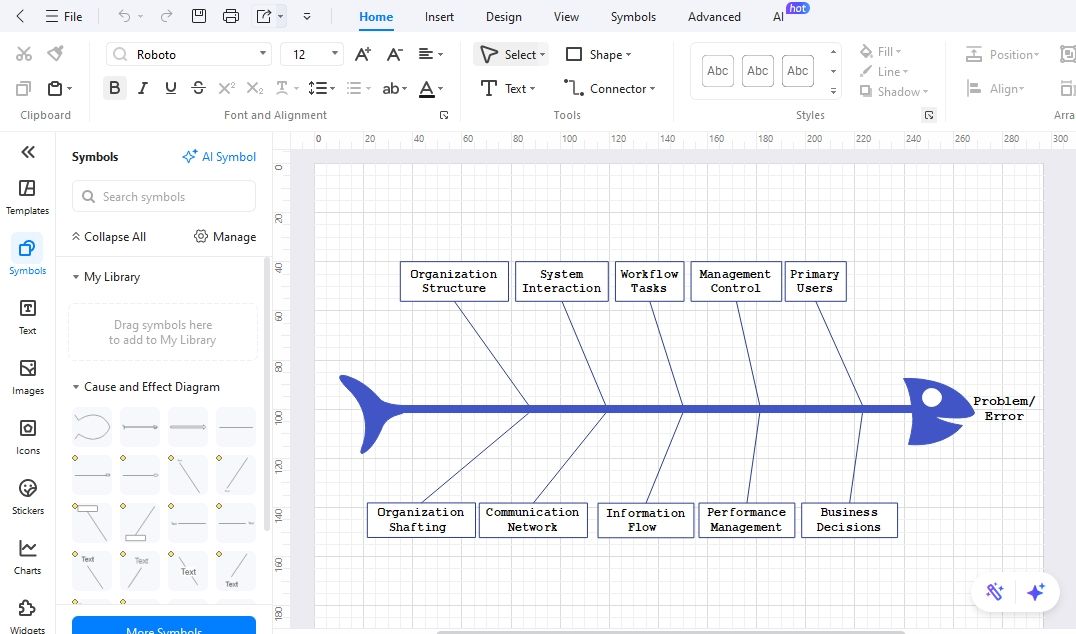
Step 5
Our diagram is complete and we need to export our design now. Export in any format you like.
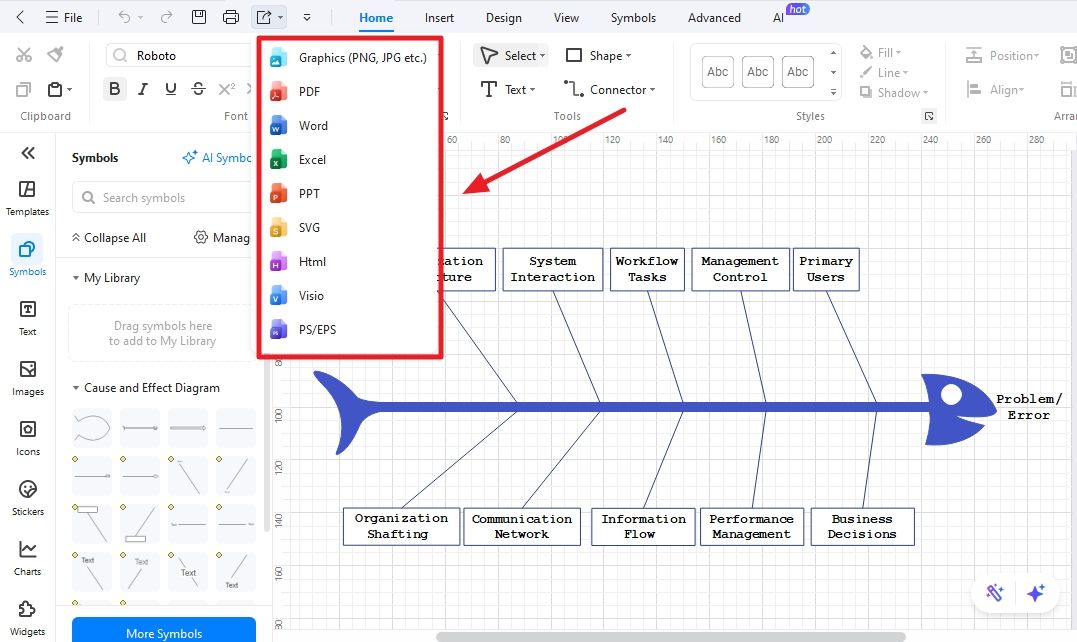
Best Practices for Using Fishbone Diagrams
Fishbone diagrams are used in many industries like medicine, education, manufacturing units, and machine learning processes, etc. Here are a few of the most commonly used cases for fishbone diagrams and their best practices.
Manufacturing industry:
In the manufacturing industry, maintaining high-quality standards, optimizing processes, and troubleshooting problems are vital. One effective tool that can help you in achieving these objectives is the Fishbone Diagram.
Identification of a problem:
Fishbone diagrams help identify the root causes of problems by visually breaking down potential factors. This method ensures a thorough analysis, going beyond symptoms to uncover the underlying issues that contribute to the problem.
Quality assurance or control:
Fishbone diagrams support quality control initiatives by identifying causes of defects or deviations in product quality. This enables teams to address these causes systematically, reducing the occurrence of defects and ensuring consistent product quality.
Decision making:
Fishbone diagrams help in decision-making by visually organizing potential causes of a problem. This helps teams prioritize which issues to address first, based on their impact, leading to more effective and efficient problem resolution.
There are many more use cases for a fishbone diagram. Developers might use them for their personal needs as well.
Final Words
Fishbone or cause and effect diagrams are being used by many industries where organizations follow these models to educate or guide their employees. So, in this guide, we have covered a lot of areas where these diagrams are being used and play a vital role. We have discussed a few methods to make or create fishbone diagrams. EdrawMax is one of the best tools to make such diagrams as it has all the built-in elements and tools that help you create these diagrams.
So, being an expert, I would advise you to have a look at EdrawMax and make your life better and easy. Check out more diagrams that you can make through EdrawMax.


