


In this article
- What is a State Chart Diagram for a Library System?
- Main Components of the Library State Chart Diagram
- How to Create a State Chart Diagram for a Library Management System with EdrawMax
- 3 Example of State Chart Diagram for Library Management System
- Best Practices for Designing State Chart Diagrams
- FAQS
What is a State Chart Diagram for a Library System?
A state chart diagram illustrates how a system behaves over time. It represents the various states and how the system transitions between them.
For a library management system, this diagram is important for displaying:
- Book Lifecycle: From the moment it is "Available" to the time when it is "Issued," "Overdue," "Reserved," or "Lost."
- Member Life Cycle: "Registered" to "Active", "Suspended" or "Expired".
A state chart diagram shows how the system responds to events. These include issuing a book, returning one late, or reserving a book. For library developers and administrators, it acts as a template. It helps improve communication and reduce design errors within the system.
Main Components of the Library State Chart Diagram
A state chart diagram for a library management system uses four notations. Each of these contributes to what the system does and how things like books and memberships change over time.
States
States help visualize the different states of an object.
- For instance, a book may be in available, issued, reserved, overdue, or lost states.
- A user can be in one of 4 states: registered, active, suspended, or expired.
- States aid in the determination of the position of the library's holdings or the user's relationship to them at a particular point in time.
Transitions
Demonstrate the transition of an object from one state to another, depending on specified events.
- Transitions between states (arrows in the diagram) link the states in a well-defined order.
- Example: If a book is borrowed, then moved from available → issued. If not returned by its due date, it moves past the overdue status.
- These are stages where the motions of the library systems can be observed.
Events/Triggers
The events or states that drive changes in the state.
- Example: Borrow Book, Return Book, Reserve Book, and Renew Membership.
- Events can be user-initiated, like when a student loans a book.
- They can also be system-initiated, such as when the system marks a book overdue.
- The addition of events also ensures the diagram represents the actual library interactions.
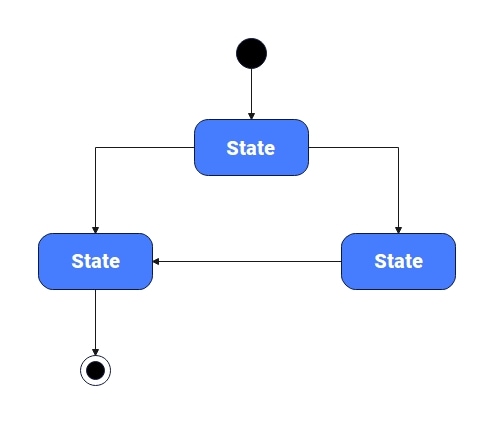
Initial and Final States
The start state (black filled circle) denotes where the lifecycle begins. For example, a book begins in the available state when it has been entered in the library catalog.
The terminus state (bull's eye) indicates where the lifecycle finishes – once a book has been deleted or trashed.
3 Examples of State Machine Diagram for Library Management System
Book Request & Checkout Process
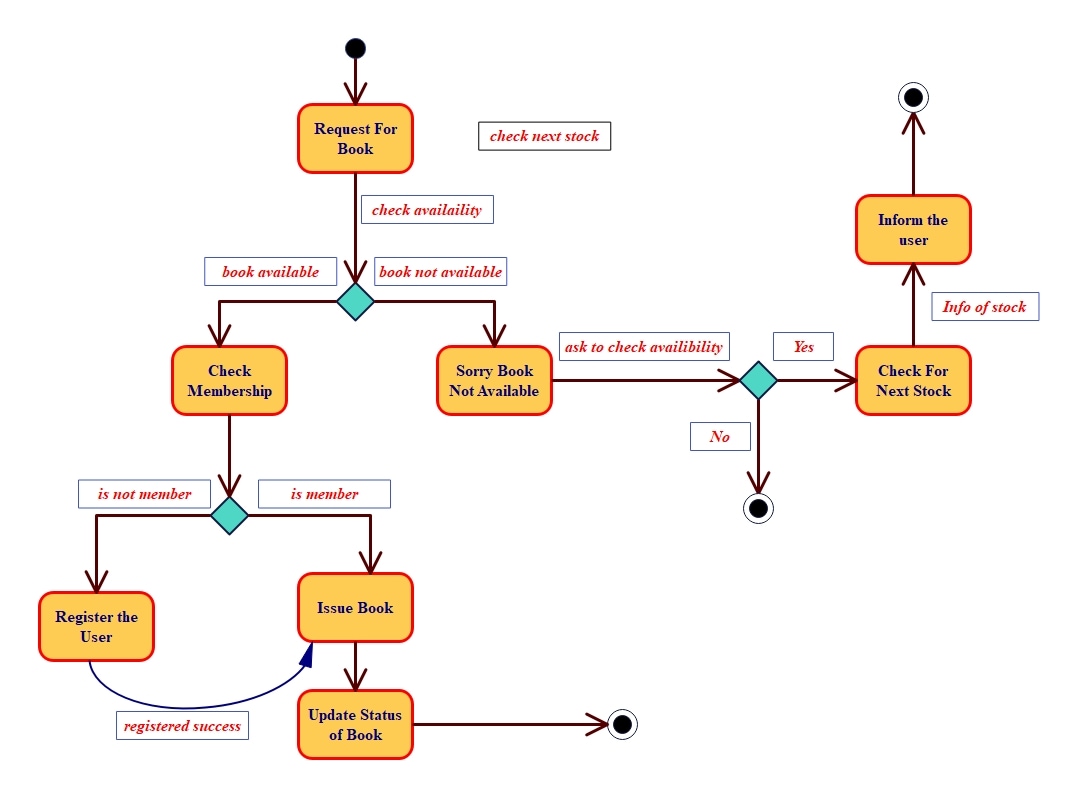
The following state machine diagram illustrates an ideal work process for a patron requesting a book. The method starts by checking stock availability. The unavailable book will prompt a notification to the customer and push an availability back to the calculation feature when the next stock becomes available.
The system checks the user's membership to see if the book is in stock. Unregistered visitors are sent to a registration page and must sign up in order to proceed. When it is a confirmed member, the system goes on to handle the book and update its status in the inventory, completing the transaction.
Membership Verification and Renting Compliance
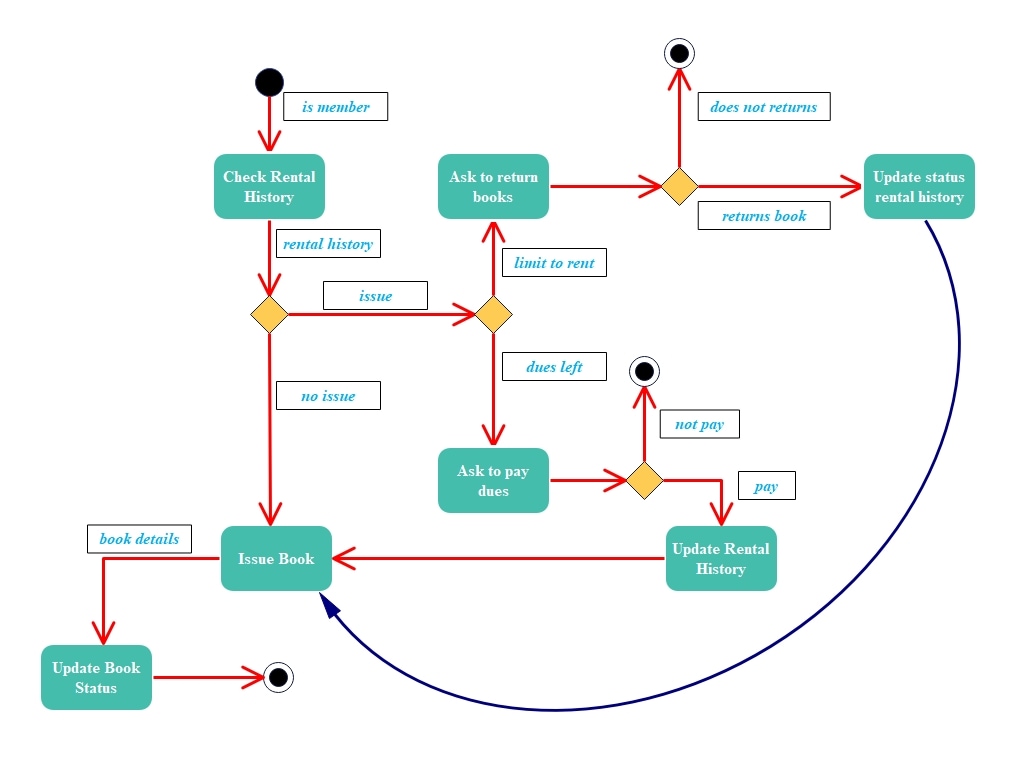
This state chart diagram includes the membership check, extended to check rental eligibility prior to lending a book again. Once the membership is verified, the system also checks the user's rental history. It verifies for overdue books and any financial obligations that are due.
If the user has overdue books and/or fines, processing continues after prompting the user to return the overdue books or to pay the fine, before making a new issue. Only after the compliance requirements have been met, or the user has been verified as clear, does the system continue to write the rental history update.
Administrative Staff Dashboard
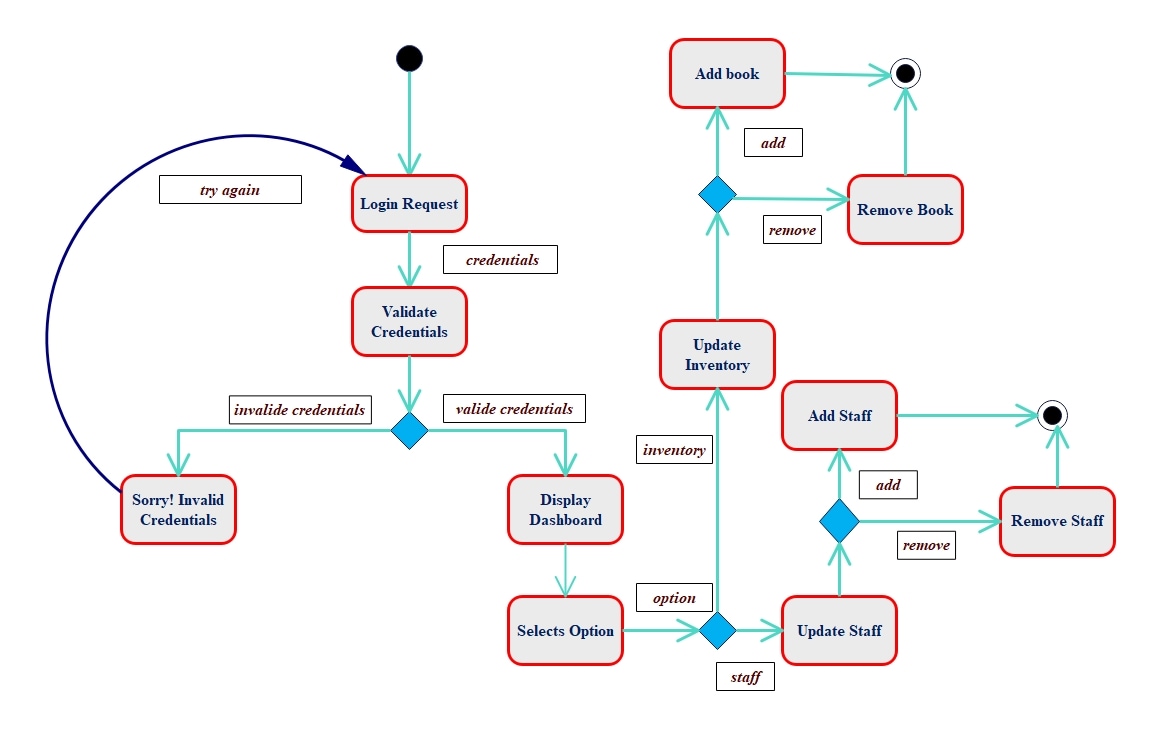
This state machine provides a model for an admin's staff dashboard after login. Once the credentials are verified, the dashboard provides a number of management choices. It also maintains a listing of staff accounts, which enables an authorized user to create new staff and deactivate existing ones.
This central control panel operates for the core of the library's operational data, with no other members of staff able to change the collections or user permissions, etc.
How to Create a State Chart Diagram for a Library Management System with EdrawMax
Do you need to develop a state diagram for your project? Try EdrawMax. It is an all-in-one diagramming solution that enables you to easily create state machine diagrams. It also offers amazing design features!
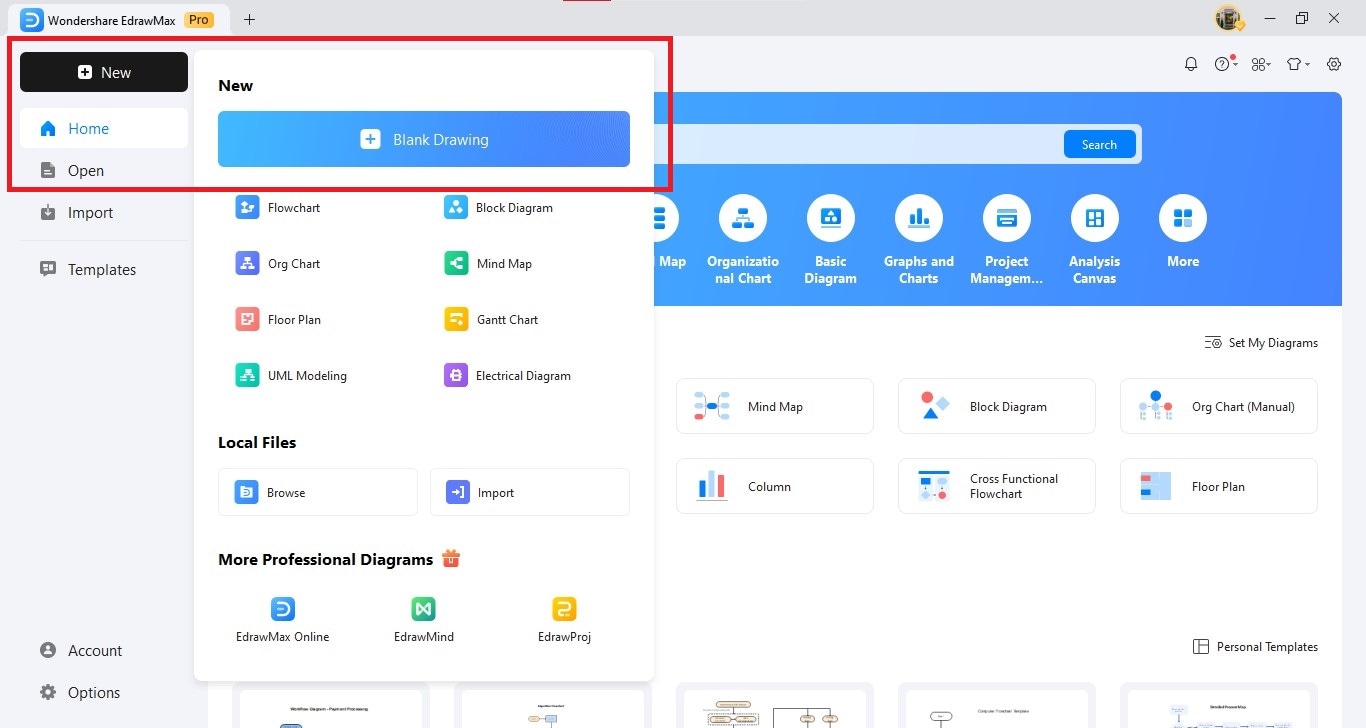
Step1 Create a New Canvas
- Open the EdrawMax application on your desktop.
- Locate the New option on the left panel. Click to expand the options.
- Select Blank Drawing to start drawing your diagram with a blank canvas.
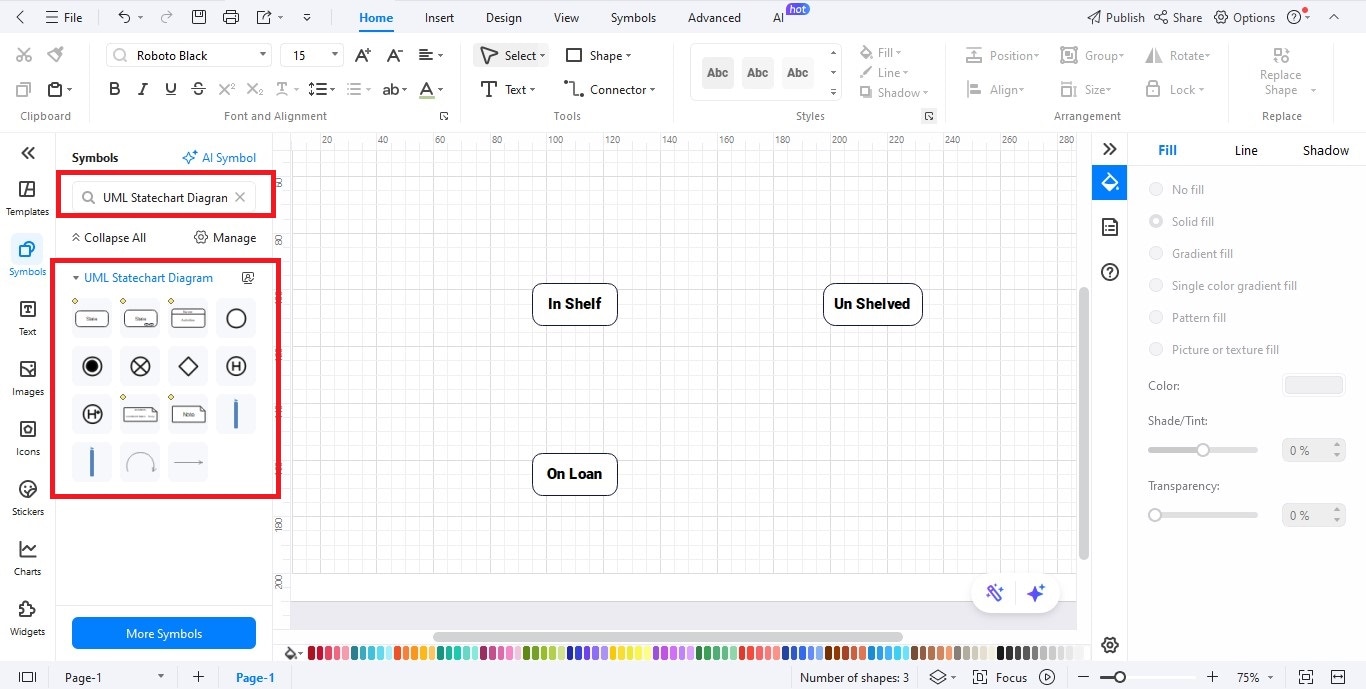
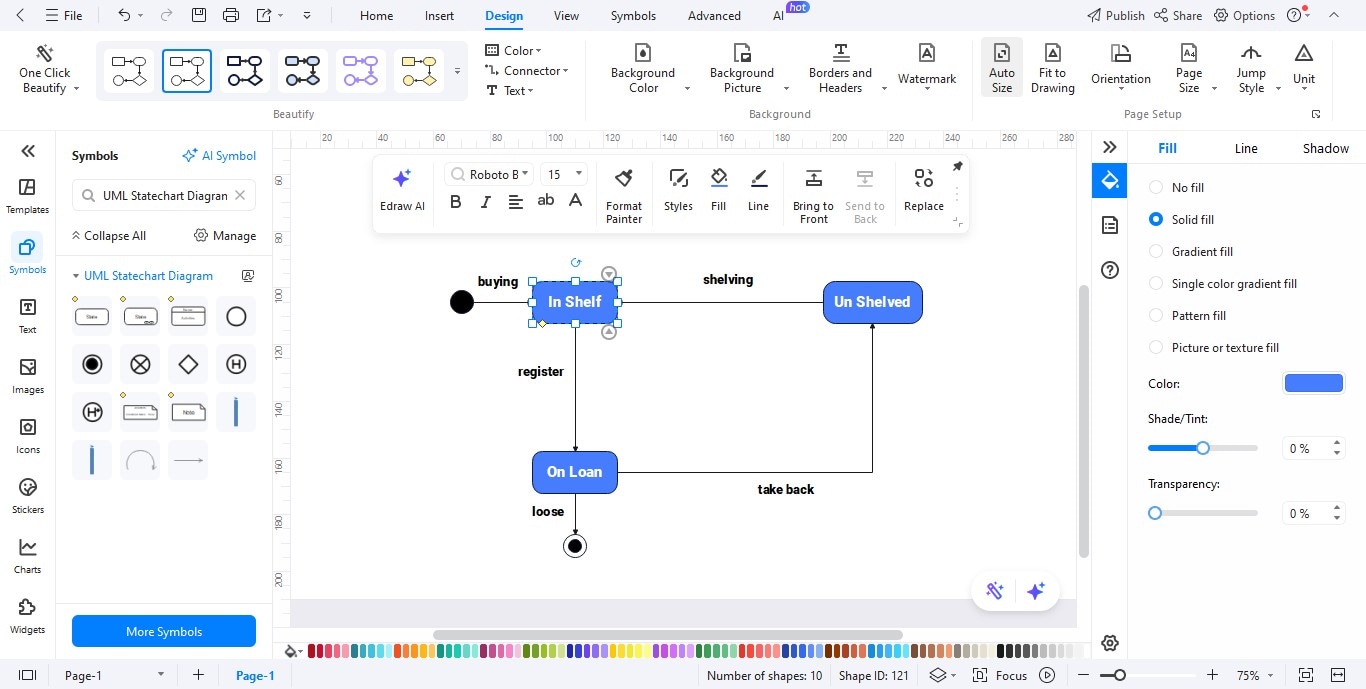
Step2 Insert States
- Navigate to the Symbol Library in the left panel.
- Make sure symbols for UML state machines are activated.
- Drag and drop state shapes onto the canvas.
- Resize or reposition the states as needed.
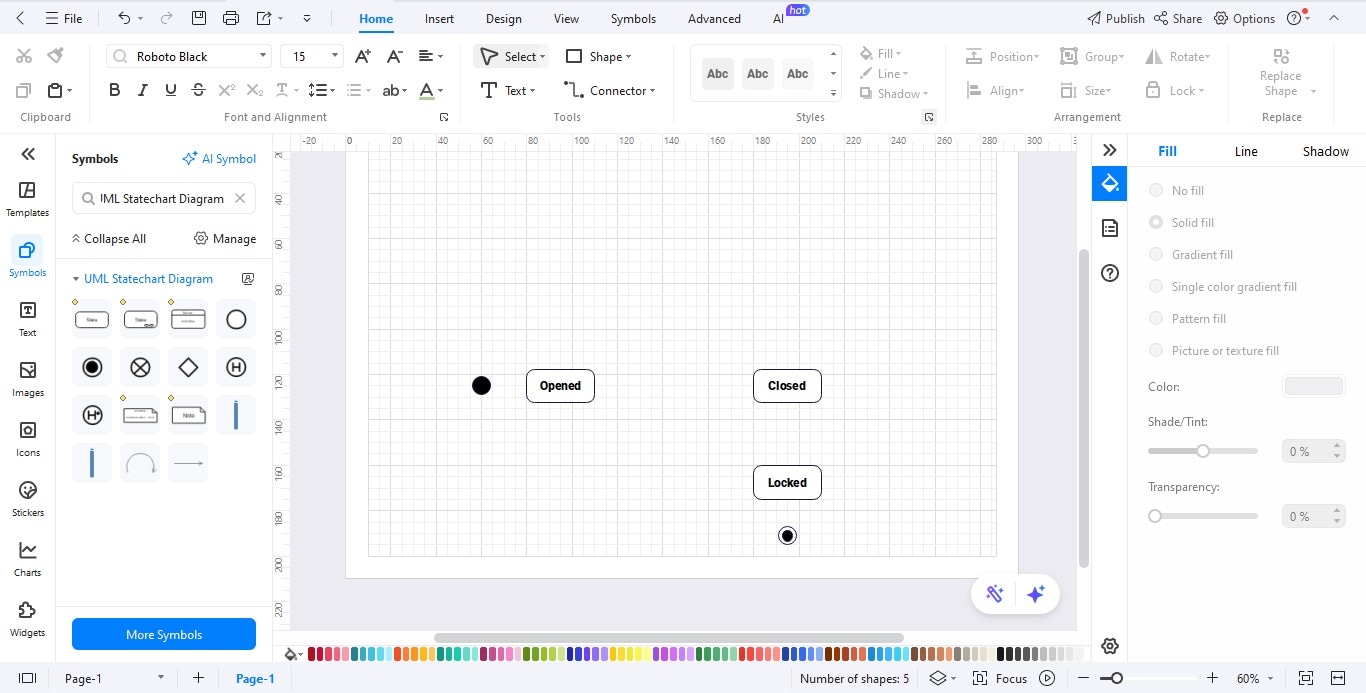
Step3 Add Initial and Final States
- Drag the Initial State symbol from the UML section of your library and drop it at the top of the canvas; this represents where the process begins.
- Drag the Final State symbol and position it at the bottom so it identifies where the process concludes.
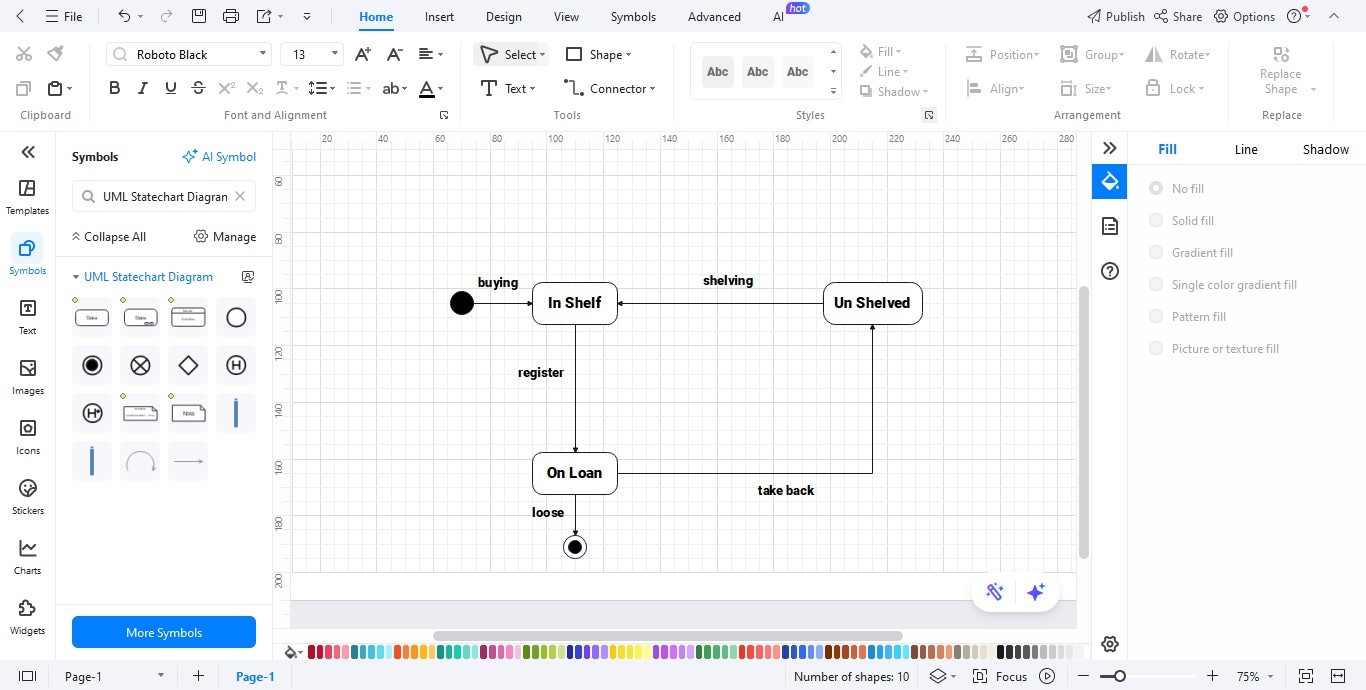
Step4 Link States with Transitions
- Choose the Connector tool or drag a Transition arrow from the UML library.
- Continue connecting states to represent transitions.
- Double-click the connector to insert event names, triggers, or conditions.
Step5 Personalize Your Diagram
- Customize colors, fonts, and line styles through the Format toolbar to achieve the desired design.
- Provide explanatory labels and notes that explain individual parts of the diagram.
- Easily use alignment and spacing properties to keep everything looking neat and clean.
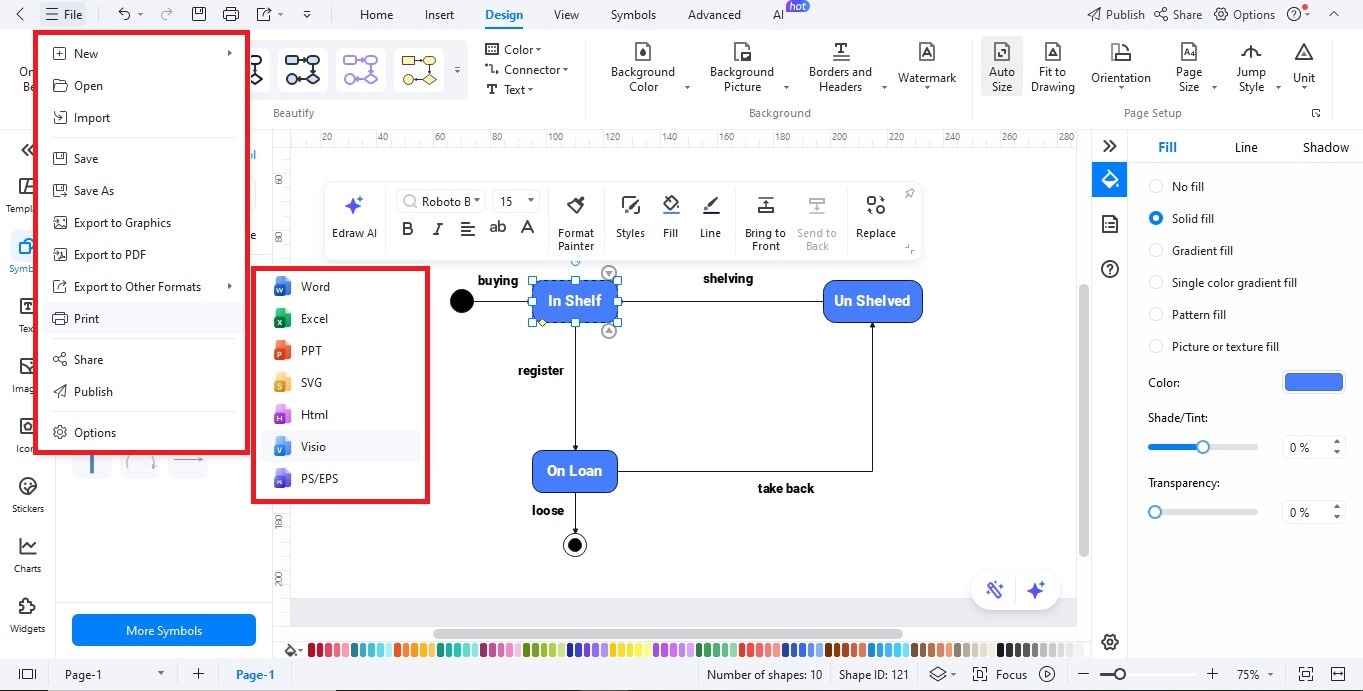
Step6 Export Your State Machine Diagram
- That's it! Click the Export button to export your diagram.
- You can download your diagram via multiple image formats like JPG, PNG, PDF, Word, or even you can export it to Visio and SVG.
- Click Export to apply your decision and save it.
Best Practices for Designing State Chart Diagrams
The following is a list of some of the things you can do so your library's state chart diagram is clear, effective, and useful:
- Keep it simple: Only include primary states. Do not include the things that revolve around the primary: Details that will muddy up the visual.
- Mark start and end: Mark entries that indicate the start or the end of the transition.
- Color code it: Book states and user states might belong to groups of different colors.
- Confirm workflows: Test transitions with actual library policies to make sure they work.
- Partner with stakeholders: Collaborate with librarians and software developers to be as comprehensive as possible.
A good state chart diagram is more than a dev tool. It also serves as a bridge between developers and non-developers in a team.
FAQ
FAQ
-
What is the purpose of a state chart diagram in a library management system?
A state chart diagram shows the lifecycle of books and members. It shows how they move through states like available, issued, reserved, active, suspended, and expired. This makes workflows clearer for developers and administrators. -
How does a state chart diagram improve library operations?
It simplifies tough tasks. For example, it helps with lending books, checking memberships, and managing overdue items. Mapping transitions cuts down on design errors, boosts communication, and makes operations smoother in the system. -
Can I create a library state chart diagram using EdrawMax?
Yes. EdrawMax offers UML state machine symbols and simple drag-and-drop tools. You can easily design, customize, and export state chart diagrams for library workflows.
AI Diagram Generator
Enter your prompt. Upload files if needed. Generate diagrams, charts, or slides instantly.


