


PlantUML allows a user to make various diagrams without going to a GUI tool or simply typing away. Instead of dragging and dropping shapes in a visual editor, you'll be asked to write code-like descriptions that get automatically rendered into diagrams.
However, while this may seem overwhelming, PlantUML, as mentioned, has a simple and readable text syntax. You can use it to make sequence diagrams, use-case diagrams, class diagrams, and many more, including flowcharts.
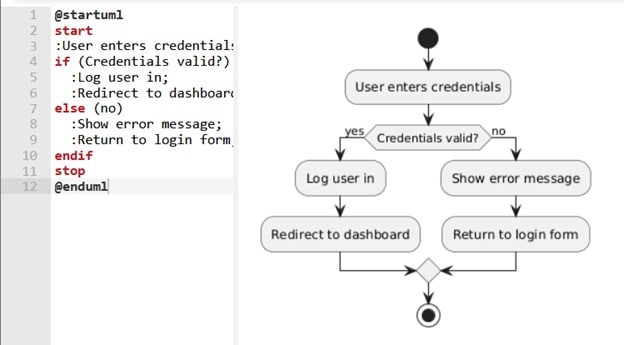
To give you a quick demonstration of how easy it is to read, here's an example of a flowchart made with PlantUML language:
@startuml
start
:User enters credentials;
if (Credentials valid?) then (yes)
  :Log user in;
  :Redirect to dashboard;
else (no)
  :Show error message;
  :Return to login form;
endif
stop
@enduml
In this article
How to Make a Flowchart with PlantUML Flowchart Syntax
The first step in learning to make flowcharts in PlantUML is understanding the basic syntax. These are the "codes" you need to understand and know comfortably to easily make flowcharts on the go. The goal here is for you to be able to write in PlantUML without referring to this article or other sources later on. So, make sure to take note of these codes.
Here's a breakdown of the fundamental elements you need to create flowcharts in PlantUML:
Start & End Nodes
Every flowchart needs a clear entry and exit point. These will serve as the "borders" or "limiters" of your code. PlantUML will understand that everything from the entry and exit codes is part of one flowchart.
To mark the beginning and end of the flowchart, use the code:
@startuml
start
stop
@enduml
Process Steps
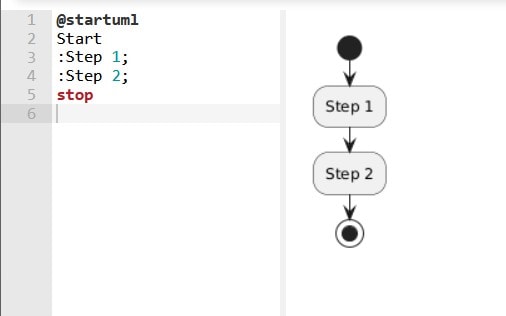
Now, it's time to go through the steps of the process. These represent actions or operations within your flowchart. You might use codes like ":Step 1;" ":Step 2;" and more. Here's an example:
@startuml
Start
:Step 1;
:Step 2;
stop
Decisions (If-Else)
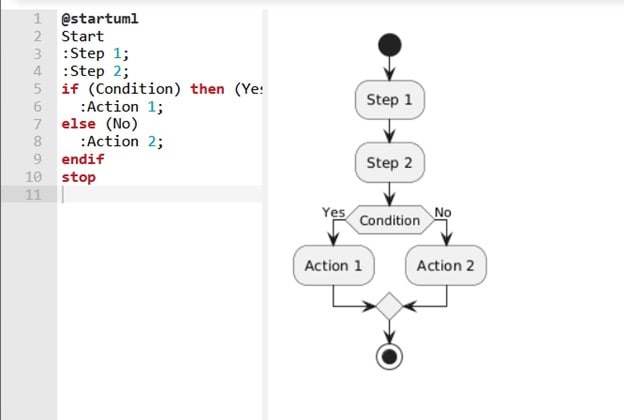
Most flowcharts have decision points. These if-else conditions usually trigger a change in the "flow" depending on the outcome you set. In PlantUML, these nodes are represented by the if-else syntax, as presented below:
@startuml
Start
:Step 1;
:Step 2;
if (Condition) then (Yes)
  :Action 1;
else (No)
  :Action 2;
endif
stop
Input/Output (Data)
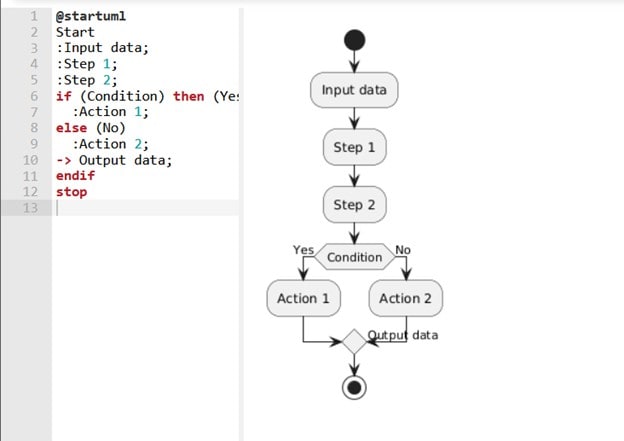
You can also use certain syntax like ":Input data;" and "-> Output data;" (replace the text with your desired data label) to represent data flow within the flowchart. The arrow "->" with text shows data flowing between processes. You can also use notes and labels to clarify the data processed at each step.
@startuml
Start
:Input data;
:Step 1;
:Step 2;
if (Condition) then (Yes)
  :Action 1;
else (No)
  :Action 2;
-> Output data;
endif
stop
With that, you should now be able to build a complete flowchart. Just reproduce the said syntax to make longer ones and edit the labels accordingly. For example, you can change "Step 1" to "Log in" or do anything that works within the process you're trying to make.
How to Make a Complex Flowchart in PlantUML
Before this section, ensure you've understood the essence of syntax. Those are the usual syntax to build your first flowchart with PlantUML. In this section, you'll go through some more advanced flowcharting techniques you can use in the text editor.
This guide tries to explain how and when to use these syntaxes, but most of the understanding will show up as you use these codes. This is because you'll be able to see them in action.
Loops (While/For)
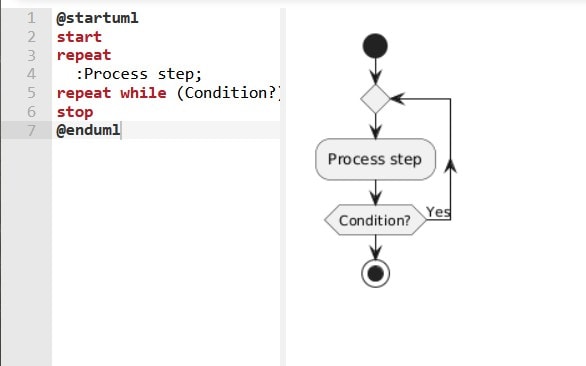
Loops or "repeat" syntax can show repeating processes until a specific condition is satisfied. Think of a login system that keeps asking for a password until the user enters the correct one. The key syntax here is "repeat" and "while" for conditions. You can use loops for retry mechanisms, polling systems, or repetitive tasks. Here's a visualization of how it works:
@startuml
start
repeat
  :Process step;
repeat while (Condition?) is (Yes)
stop
@enduml
Parallel Processes (Fork-Join)
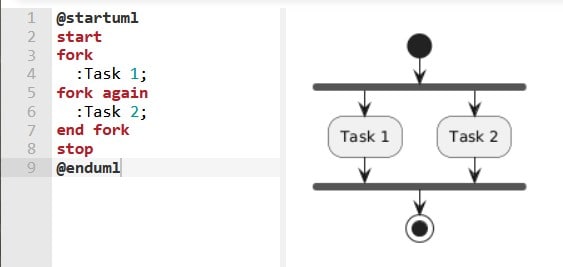
Sometimes, a workflow requires multiple tasks to run simultaneously (e.g., downloading a file while logging progress). PlantUML supports this with "fork" and "end fork." You can use this for multi-threaded operations, background tasks, or independent processes.
@startuml
start
fork
  :Task 1;
fork again
  :Task 2;
end fork
stop
@enduml
Subroutines (Callbacks)
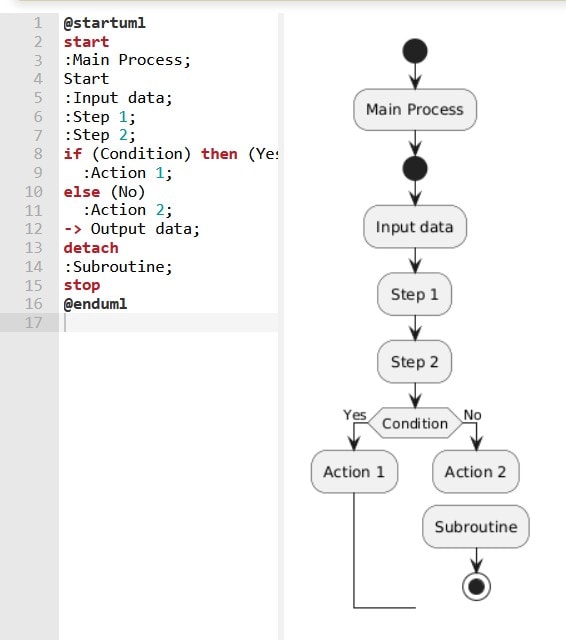
Now, subroutines are separate processes that can run independently from the main flow of your process. For example, this can be sending an email notification, say, for a new IP address, while the user continues the login process. These are made through the "detach" syntax. Here's an example of this code in action:
@startuml
start
:Main Process;
Start
:Input data;
:Step 1;
:Step 2;
if (Condition) then (Yes)
  :Action 1;
else (No)
  :Action 2;
-> Output data;
detach
:Subroutine;
stop
@enduml
Jump Points
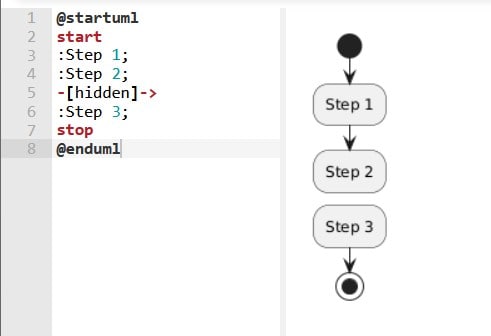
In large flowcharts, arrows can become messy. Hidden connectors "-[hidden]->" let you link steps without cluttering the diagram. Use this to simplify complex flows or avoid crossing lines. Here's a jump point in action:
@startuml
start
:Step 1;
:Step 2;
-[hidden]->
:Step 3;
stop
@enduml
How to Edit Styling & Layout of a Flowchart in PlantUML
After basic and advanced syntax, you should now be able to take extra steps for creativity. These are essential to make the flowchart yours. Besides that, you should now be able to manipulate the flowchart to add more groupings. In this section, you'll go through all these seemingly complicated steps.
Colors & Shapes
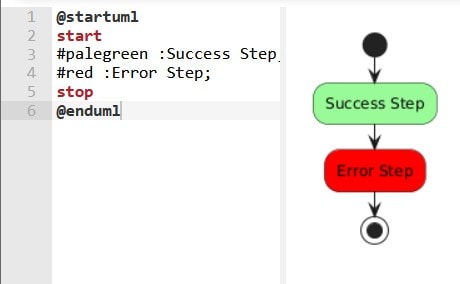
Colors not only serve a creative purpose. They can also be used to differentiate steps, such as success or error paths, and improve the overall readability of your flowchart. For example, green is usually used for success paths and red for error paths. This is a simple example of using colors in PlantUML flowcharts.
For colors, you can use the "#colorname" syntax before a node ": Insert Step Here;" just like below:
@startuml
start
#palegreen :Success Step;
#red :Error Step;
stop
@enduml
Direction Control
By default, PlantUML generates your flowchart from top to bottom. But sometimes, a left-to-right layout might seem better for your process, like those that are wider or involve more steps. These are more practical to insert into a document. Thus, you should use simple syntax like "->" to manually redirect the flowchart.
@startuml
start
if (Condition) then (yes)
  -> Step 1;
else (no)
  -> Step 2;
endif
stop
@enduml
Grouping (Swimlanes)
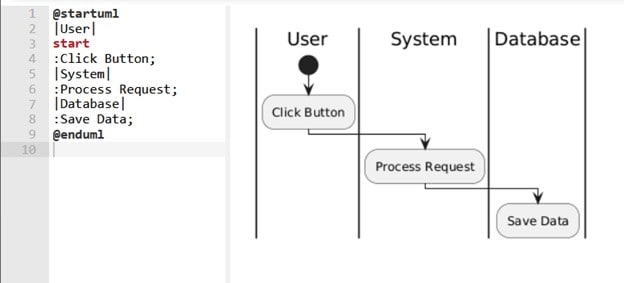
Lastly, you can try making swimlanes or grouping certain processes within the flowchart together. Swimlanes (vertical or horizontal dividers) separate steps based on who performs them (e.g., User vs. System). Here's a quick rundown of what's in the PlantUML text below:
- |User|: Creates a lane labeled "User". (Steps under |User| belong to the user's actions.)
- |System|: A new lane for system processes.
- |Database|: Shows what the database is supposed to do with the data or processes taken by the User/System.
@startuml
|User|
start
:Click Button;
|System|
:Process Request;
|Database|
:Save Data;
@enduml
Flowchart Examples of PlanUML
As you've seen, making flowcharts using text-based editors like PlantUML doesn't have to be complicated. All you need to do is understand the basic syntax, and you're good to go. You can create flowcharts or diagrams with just a few attempts and practice.
These three examples show you how to handle the most common scenarios: decision points, retry mechanisms, error handling, and multi-step processes. Each example tackles a different level of complexity. We start with basic yes-no decisions, move into loops and error recovery, and finish with parallel processing across multiple systems.
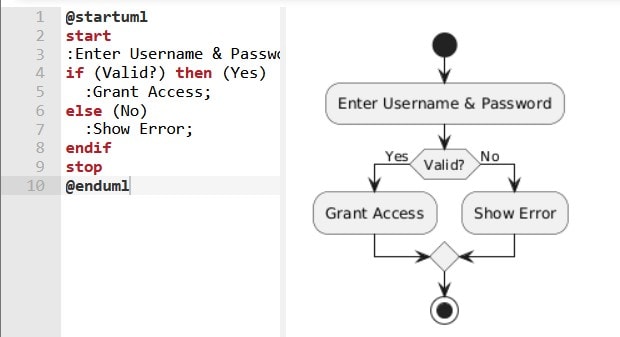
Example 1Basic Login System
This straightforward login flow demonstrates the foundation of decision-based flowcharts. Users input their credentials, the system validates them, and one of two things happens: access is granted, or an error is displayed.
@startuml
start
:Enter Username & Password;
if (Valid?) then (Yes)
  :Grant Access;
else (No)
  :Show Error;
endif
stop
@enduml
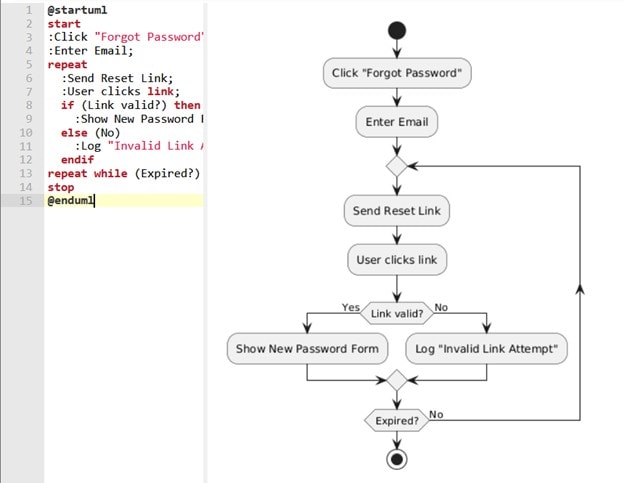
Example 2Password Reset Flow
Password resets involve more complexity because they need retry logic and time-sensitive links. This flowchart shows how to handle expired tokens and failed attempts while keeping the user experience smooth. The repeat-while loop ensures the system keeps trying until the link expires or succeeds.
@startuml
start
:Click "Forgot Password";
:Enter Email;
repeat
  :Send Reset Link;
  :User clicks link;
  if (Link valid?) then (Yes)
    :Show New Password Form;
  else (No)
    :Log "Invalid Link Attempt";
  endif
repeat while (Expired?) is (No)
stop
@enduml
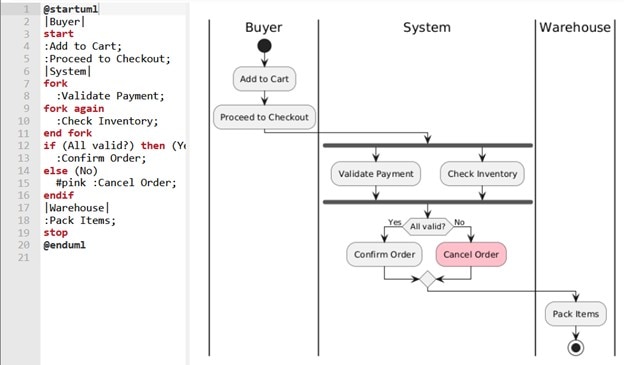
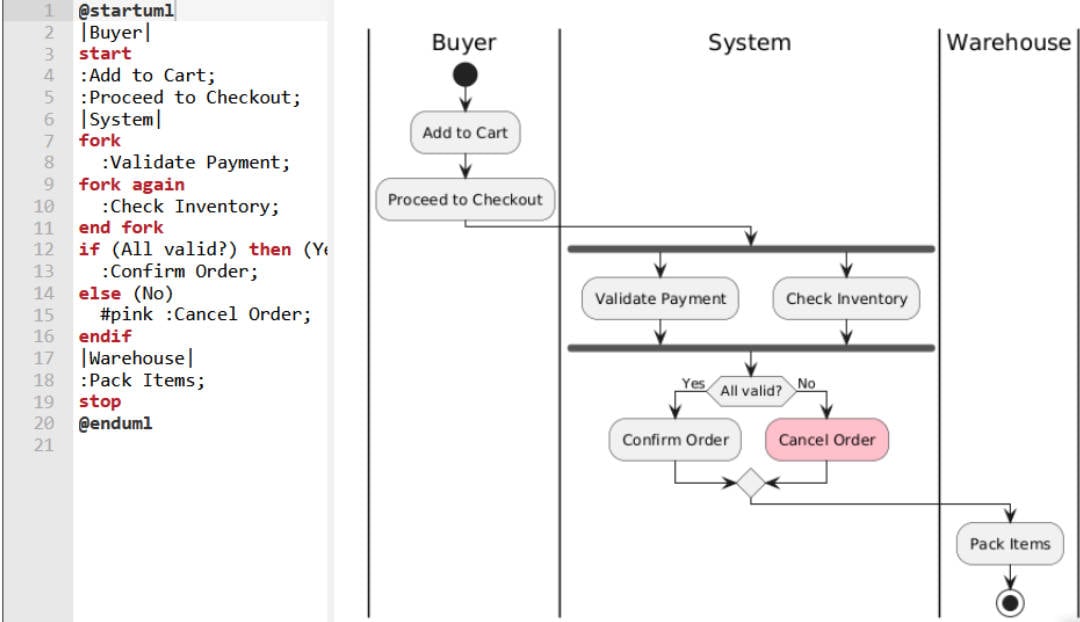
Example 3E-Commerce Checkout
Real-world checkout systems must validate multiple things simultaneously - payment processing and inventory checking can't wait for each other. This example uses parallel processing (fork/end fork) and swimlanes to show how different systems work together. The entire order gets canceled when either validation fails to maintain data consistency.
@startuml
left to right
|Buyer|
start
:Add to Cart;
:Proceed to Checkout;
|System|
fork
  :Validate Payment;
fork again
  :Check Inventory;
end fork
if (All valid?) then (Yes)
  :Confirm Order;
else (No)
  #pink :Cancel Order;
endif
|Warehouse|
:Pack Items;
stop
@enduml
Common Mistakes & Fixes using PlantUML
Even experienced developers run into these three issues when creating flowcharts with PlantUML. The good news? Each problem has a simple solution that immediately improves your diagram's readability and professional appearance.
- Hiding arrows: Overlapping arrows create visual chaos, making following flows impossible. When your diagram looks like a plate of spaghetti, add -[hidden]-> between elements to create invisible connections that guide the layout engine.
- Improving readability. Unreadable text kills the purpose of visual documentation - if people can't read your labels, they won't use your flowchart. Drop skinparam defaultFontSize 14 at the top of your diagram to make everything legible.
- Improving alignment. Messy alignment makes even simple processes look complicated. Force PlantUML to organize elements cleanly by changing the direction of some nodes, depending on your preferred flow orientation.
PlantUML Alternatives: More Methods to Make a Flowchart
PlantUML excels at many things, but it is not the perfect solution for every team or project. Understanding its limitations helps you make better tooling decisions and avoid frustration.
PlantUML's Limitations
Non-developers often struggle with PlantUML's text-based approach. While programmers love writing flowcharts like code, designers and business analysts typically prefer visual editors where they can see changes instantly. The syntax learning phase can slow down teams that need quick diagram creation, especially when stakeholders want to contribute directly to process documentation.
PlantUML's automatic layout works well for simple diagrams but becomes problematic with complex workflows. You'll fight the layout engine when you need precise positioning or specific visual arrangements. Manual tweaking with hidden arrows and spacing commands can consume more time than the initial diagram creation, particularly for presentation-ready outputs.
GUI Tool Alternatives
For teams needing WYSIWYG (what you see is what you get) editing, tools like EdrawMax offer rich template libraries and intuitive drag-and-drop interfaces that eliminate syntax learning. Visual tools excel when non-technical stakeholders need direct editing access or when diagram aesthetics matter as much as functionality.
Consider PlantUML when your team values version control integration, automated documentation generation, or code-adjacent workflows. Choose visual alternatives when rapid prototyping, stakeholder collaboration, or polished presentations take priority. Many successful teams use both approaches - PlantUML for technical documentation and GUI tools for client-facing materials or brainstorming sessions.
Wondershare EdrawMax: Overview and Key Features
If you're already considering GUI alternatives to PlantUML, it's great to check out Wondershare EdrawMax to get started. Its primary benefit is that it's a powerful all-in-one diagramming tool with a penchant for being accessible to both professionals and beginners. With a clean, drag-and-drop interface, it's surely a lot better in more cases than manually typing code you're unfamiliar with.
Here are some of the key features to get you familiar with the tool:
- Cross-platform support: Available on Windows, macOS, Linux, and web, allowing users to work on any device.
- Wide diagram variety: Supports over 280 types of diagrams, including flowcharts, org charts, mind maps, and UML.
- Template and symbol libraries: Offers 30,000+ user-made templates and thousands of symbols you can use anytime.
- Flexible export options: Allow exporting diagrams in multiple formats such as PDF, Visio, SVG, Word, and PowerPoint.
- AI Features: Make your work a lot easier with the help of integrated AI features like summary, writing, chart analysis, drawing, and other related tools.
AI Diagram Generator
Enter your prompt. Upload files if needed. Generate diagrams, charts, or slides instantly.
