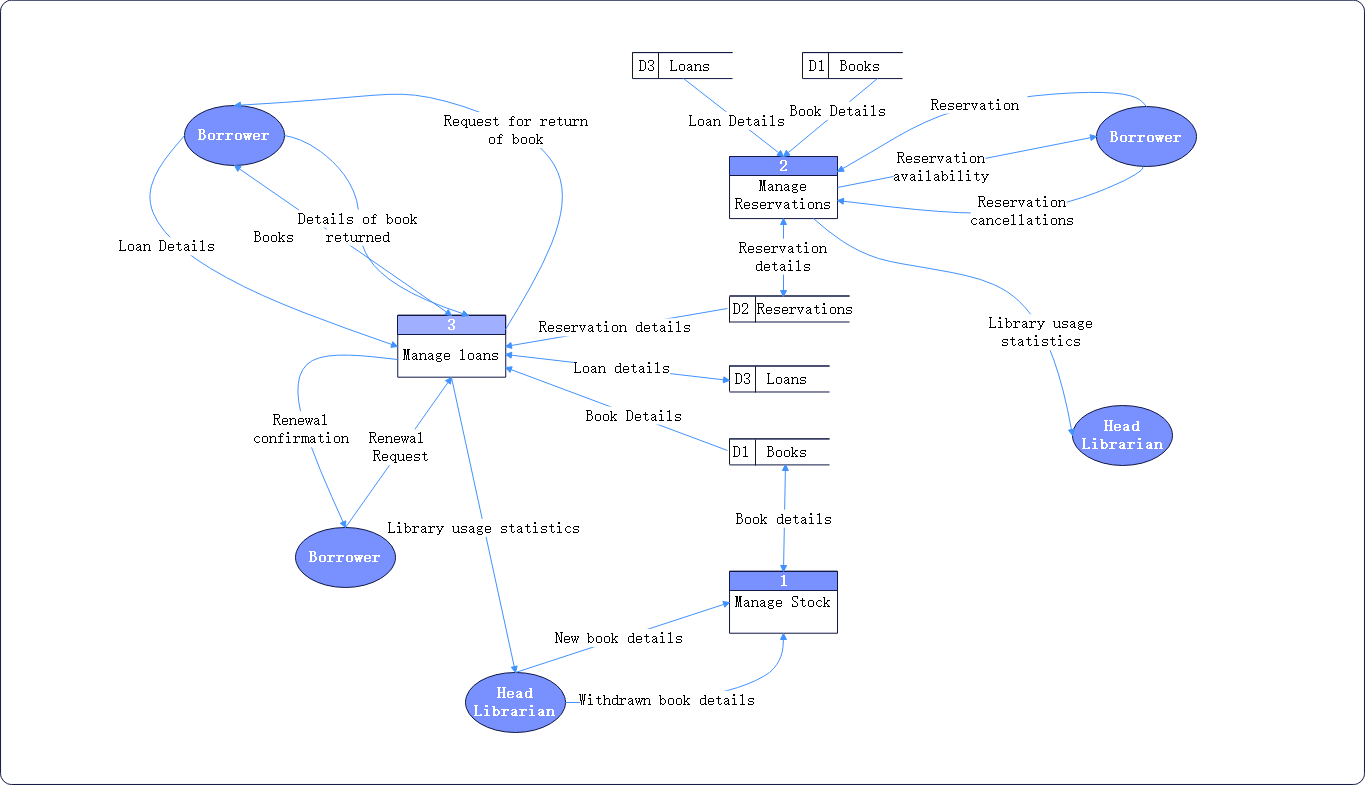
Designing an efficient Library Management System (LMS) requires a comprehensive understanding of its processes and interactions. A Data Flow Diagram (DFD) serves as a visual representation, elucidating the system's flow of information. In this article, we will guide you through the step-by-step process of crafting a DFD for Library Management System, empowering you to streamline operations and enhance user experience.
In this article
Importance of DFD for Library Management System
A Data Flow Diagram (DFD) is crucial for a Library Management System as it provides a clear, visual representation of how information flows within the system. It helps in identifying key processes, data sources, and interactions, enabling efficient design and troubleshooting. It also assists in the efficient utilization of library resources.
Additionally, a well-constructed DFD facilitates effective communication between stakeholders, ensuring a seamless and organized library operation. So, overall, a DFD for library management system ensures the integrity and effectiveness of the Library Management System.
Data Flow Diagram Example of Library Management System
Understanding the various levels of Data Flow Diagrams (DFD) is essential for gaining a comprehensive view of a system's processes and interactions. Here’s a brief description of various DFD levels:
DFD Level 0 Diagram for Library Management System
The Level 0 DFD of Library Management System is commonly referred to as the context diagram. It consists of the primary process, users, and data flows, all presented within a single process illustration. DFD Level 0 delineates the entities engaged in system interaction, establishing the system-environment boundary. This context diagram offers a high-level depiction of the Library Management Project.
DFD Level 1 Diagram for Library Management System
DFD Level 1 provides a more detailed view of the Library DFD Level 0. Its purpose is to elucidate the trajectory of data, showcasing its transition from input to output through various processes. The diagram illustrates two distinct scenarios: Book Delivery and Topic Search, offering a comprehensive understanding of the system's operations.
DFD Level 2 for Library Management System
This level also broadens the idea from the DFD level 1. It includes the sub-processes from the level 1 as well as the data that flows.
Creating a DFD Using Wondershare EdrawMax
Creating a DFD using Wondershare EdrawMax is invaluable for its user-friendly interface and robust features, streamlining the process of visually representing complex systems. EdrawMax's intuitive tools empower users to efficiently map out intricate data flows, ensuring clarity in system design. This software's versatility and customization options facilitate seamless collaboration and enhance project comprehension, making it an indispensable tool for effective system analysis and design.
Below are the instructions for generating a DFD for library management system using EdrawMax.
Step 1: Open EdrawMax software on your computer.
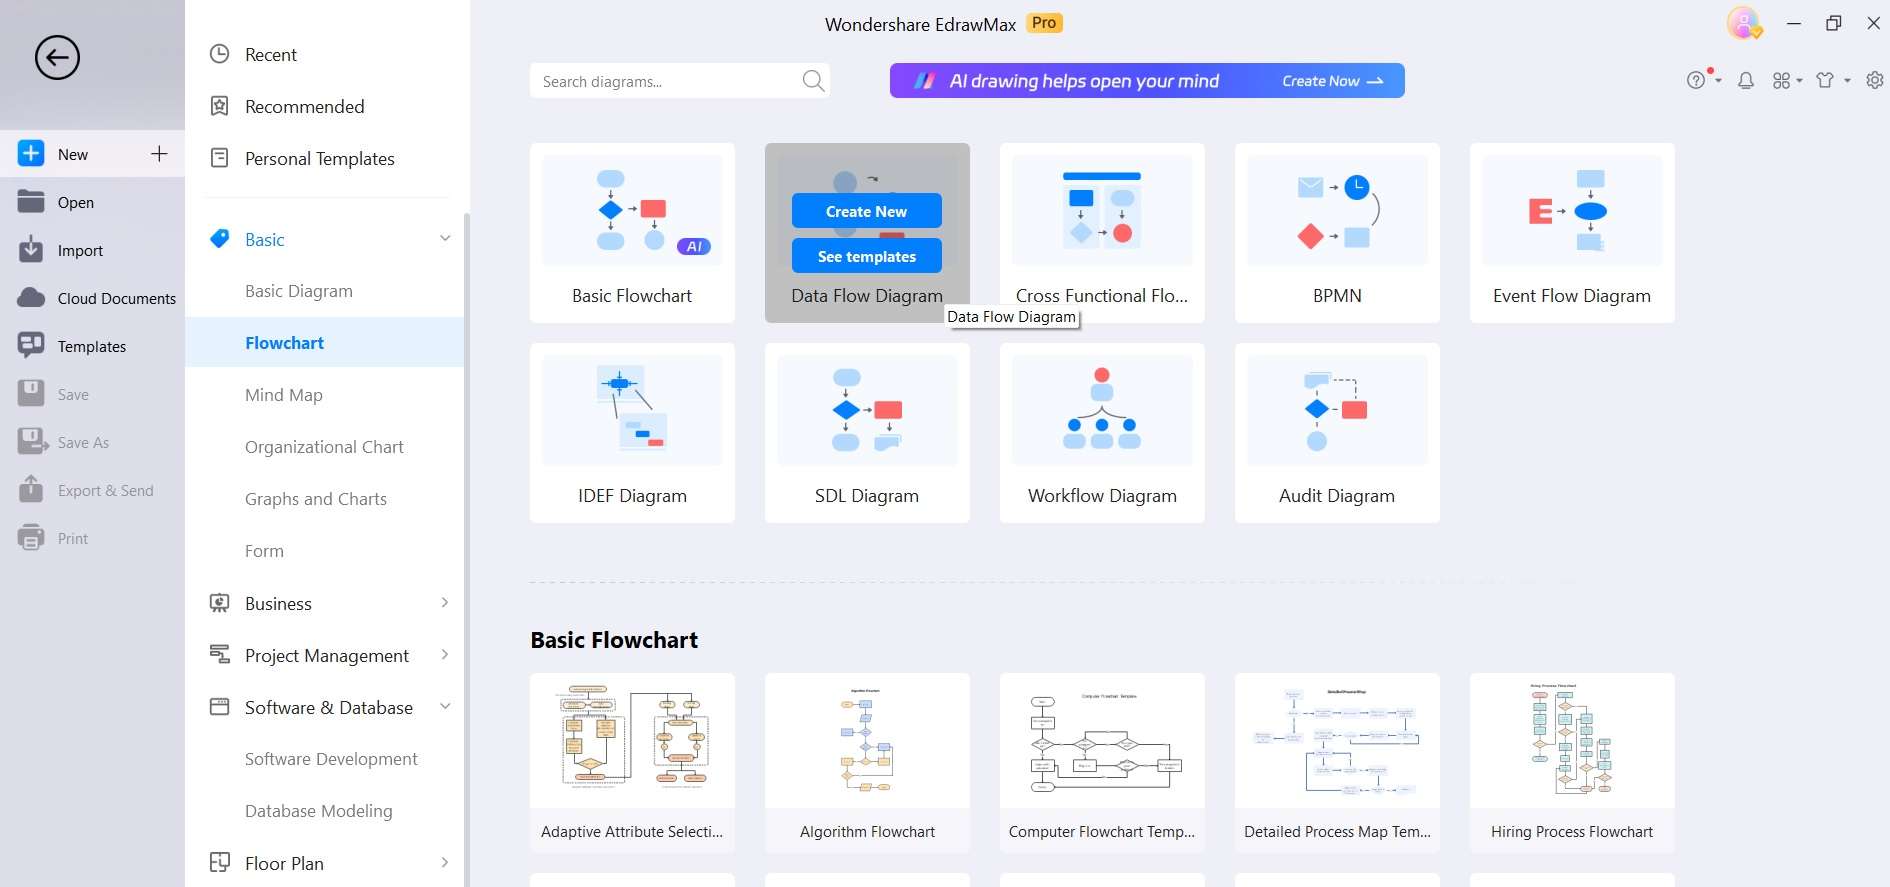
Step 2: To get started, click on "New" to start a new project. Alternatively, you can also choose from the template categories. Choose "Flowchart" which includes various diagram options. Select "Data Flow Diagram" and then tap on “More Templates” to browse.
Step 3: Employ the intuitive drag-and-drop functionality to place symbols representing processes, data sources, and entities onto the canvas. Arrange them in a logical sequence that mirrors the flow of data within the Library Management System.
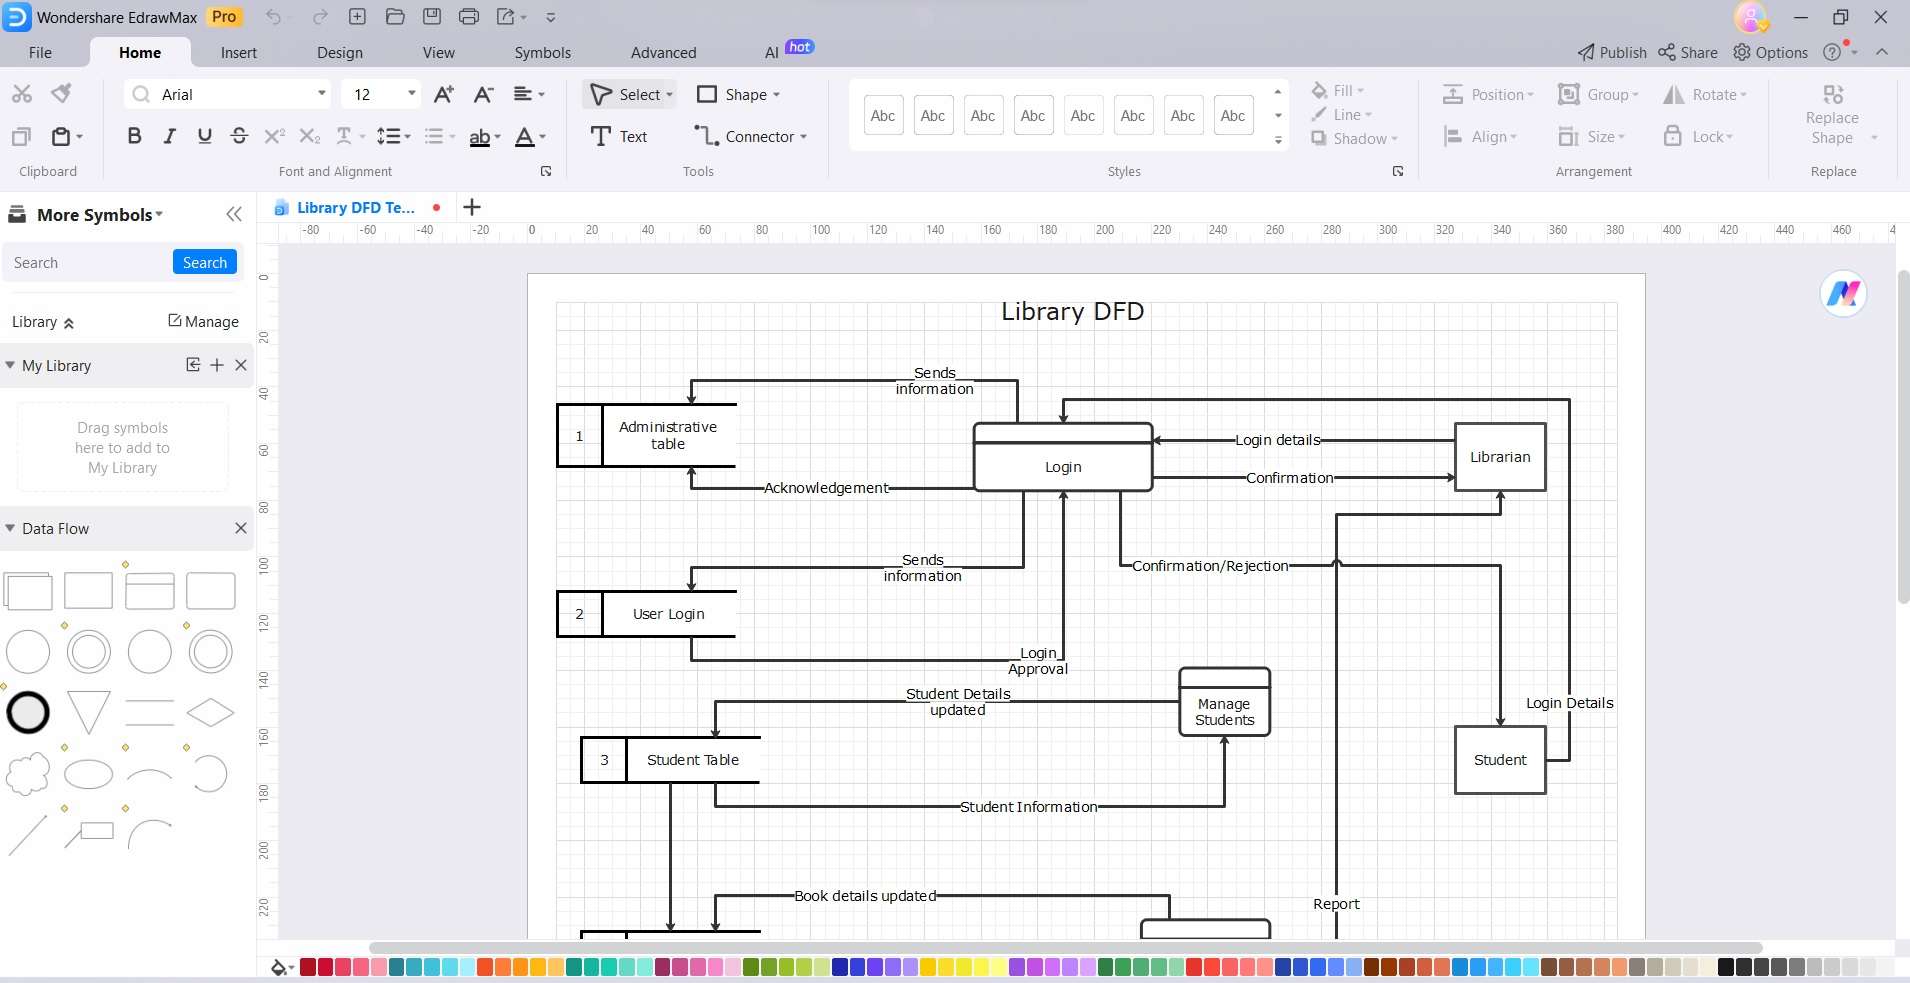
Step 4: Use the available connector tools to establish connections between the placed elements, visually indicating the path of data movement. Ensure the arrows point in the direction of data flow for clarity.
Step 5: Review the diagram's layout, ensuring it is organized and aesthetically pleasing. Adjust design elements, such as colors and shapes, to improve overall visual appeal and coherence.
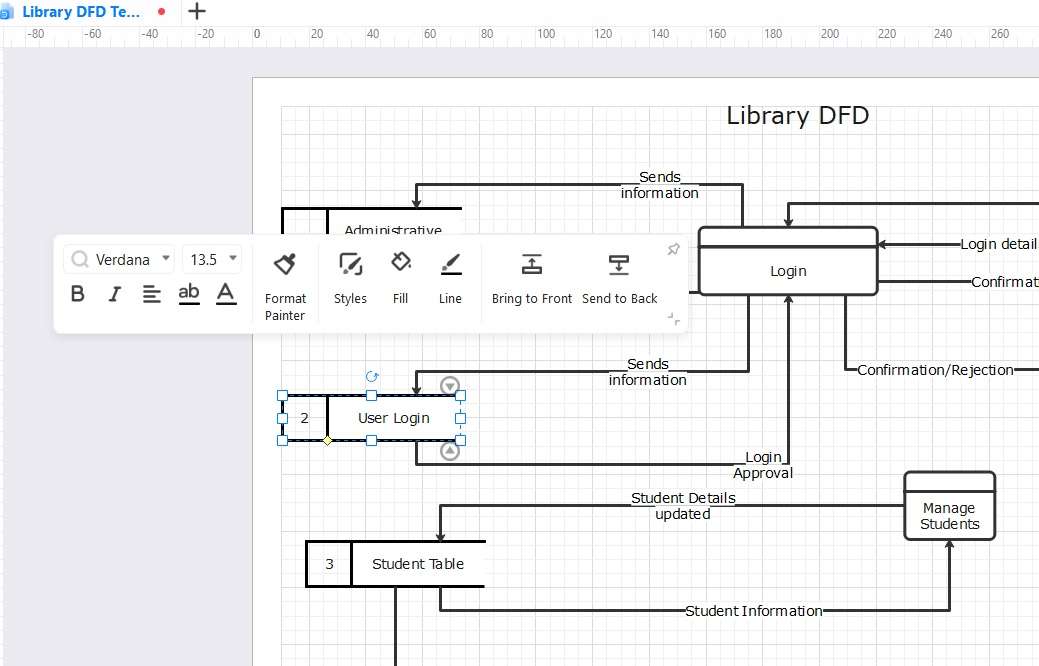
Step 6: Save your work in EdrawMax's native file format for future editing or reference.
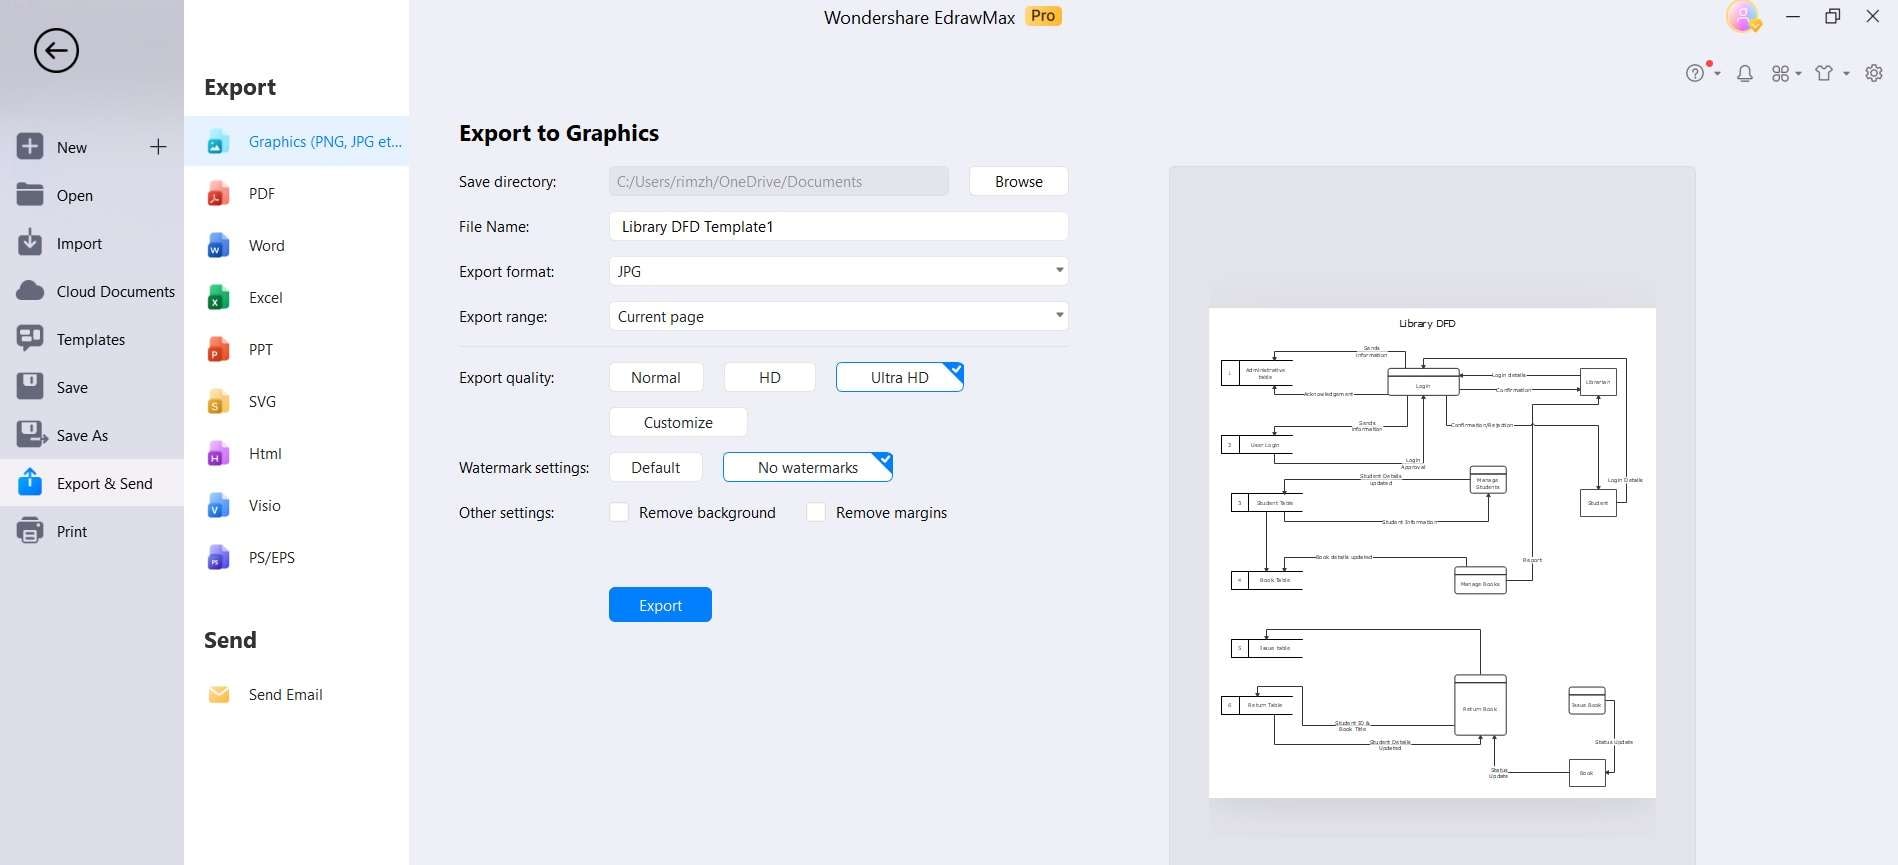
Consider exporting the DFD in a suitable format (e.g., PNG, PDF) for easy sharing and integration into project documentation.
Users of Library Management System DFD
Understanding the diverse user roles within a Library Management System (LMS) is crucial for its efficient operation. Here are the key stakeholders and their respective roles in the LMS Data Flow Diagram:
Administrators: Oversee system settings, user permissions, and overall functionality, ensuring efficient system management.
Reports Analysts: Generate and analyze data reports for informed decision-making and library improvements.
Librarians: Responsible for cataloging, circulation, and inventory management, ensuring smooth library operations.
Catalogers: Input and update book information in the database, maintaining an accurate catalog.
Guest Users: Access limited features without a formal account, benefiting from basic library services.
Conclusion
In wrapping up our exploration of crafting a DFD for the Library Management System, we've learned that this visual tool is the cornerstone of effective system design. By meticulously mapping data flows and processes, we empower ourselves to optimize library operations, enhance user experiences, and ultimately ensure the seamless management of valuable resources.
Mastering the art of DFD creation is a vital step towards transforming libraries into agile, user-centric institutions of the digital age."
FAQs
1. How to draw a sequence diagram for a library management system?
To create a sequence diagram for a Library Management System, first, identify key actors like users and system components. Then, map out interactions between them, showing the order and flow of messages. Finally, use a tool like EdrawMax to draw and label the diagram for a clear visual representation.
2. Which process model is best for a library management system?
The Waterfall model is well-suited for Library Management Systems. Its linear approach ensures each phase is completed before moving to the next, ensuring a systematic and thorough development process. This is crucial for a stable and reliable system like a library management system.
3. What are the benefits of using a cloud-based Library Management System?
Opting for a cloud-based Library Management System offers a range of advantages. It allows for convenient remote access from any location, providing flexibility and scalability in terms of storage and services. Moreover, it can significantly reduce hardware costs while ensuring automatic backups, and enhancing data security and accessibility.


 below.
  below.