


You may believe that data migration is simply the transfer of information. It is not. It is about knowing the relationship between each piece of information within the system. Here is where a data migration process flow diagram comes in. It tells how information passes from one point to another, ensuring consistency and accuracy in the process.
On the other hand, a data migration flowchart introduces simplicity into complex transitions. It assists teams in visualizing the dependencies, mapping relationships, and finding possible problems at the initial stage. These visuals make planning more structured and execution more dependable. This article discusses the purpose, benefits, and how EdrawMax enables you to create these diagrams effectively.
Let’s get into the details!
In this article
What is a Data Migration Process Flow Diagram?
The data migration process flow diagram represents the data flow between systems. It shows each step of the procedure, starting with retrieving data and converting it, and placing it into the new environment. It does not rely on long documents; instead, it introduces the workflow in a visual representation that is easy to understand.
Difference from a Simple List
A simple list of migration steps tells you what to do. A process flow diagram will give you the picture of how all things come together. Lists are linear, whereas diagrams are interactive. They demonstrate system-to-system relationships, emphasize feedback mechanisms, and specify locations of data quality checks. The difference facilitates easy planning and teamwork.
Value in Modern Data Projects
By using a data migration process flow diagram, businesses gain a shared understanding of their migration strategy. It turns technical complexity into clarity and supports accurate decision-making at every stage of the project.
Key Elements & Components of the Diagram
The data migration process flow diagram adds structure to the information flow between systems. It divides the process into smaller and related sections. All of these components allow keeping the migration accurate, smooth, and trackable.
Data Sources
Any migration is initiated by the data source. It may be a database, an old system, or a collection of files that are stored on various platforms. This phase determines the data that will be transferred and its current location. Knowing the origin ensures that there is no wrong data selected and nothing significant is left out.
Data Transformation
Once the data has been identified, it is then prepared to be delivered to the new system. Data transformation is done to transform it into a compatible form. It can involve cleaning, formatting, or restructuring records. It is used to eliminate duplicates, correct anomalies, and align the standards of the destination.
Mapping
Mapping links each field from the source to its destination. It demonstrates the precise relationship between one attribute and another. An effective mapping plan will avoid mismatched data and provide a smooth transition. Otherwise, it will either get into the wrong hands or lose its context.
Validation
Validation is used to verify that migrating data is accurate and sufficient. It checks the values of sources and destinations to ensure that no information is lost or damaged. Data rules and quality standards are also verified by validation.
Error Handling
No migration is perfect. Any problem in the transfer is handled by error management. It records unsuccessful records, determines the reasons, and makes sure that mistakes are not overlooked. The step makes the process transparent and simple to troubleshoot.
Destination
The destination is the final stop. It is where the data will rest after migration. With a clear definition of the destination, the new environment is in a position to manage the incoming data in an effective and safe manner.
3 Typical Data Migration Process Flow Diagram
Each data migration project has its own unique approach, but the majority of them share a common pattern. The following examples illustrate how different migration flows are visualized, depending on the project goals. Each diagram highlights a specific approach, helping you understand how information moves, transforms, and settles across various systems.
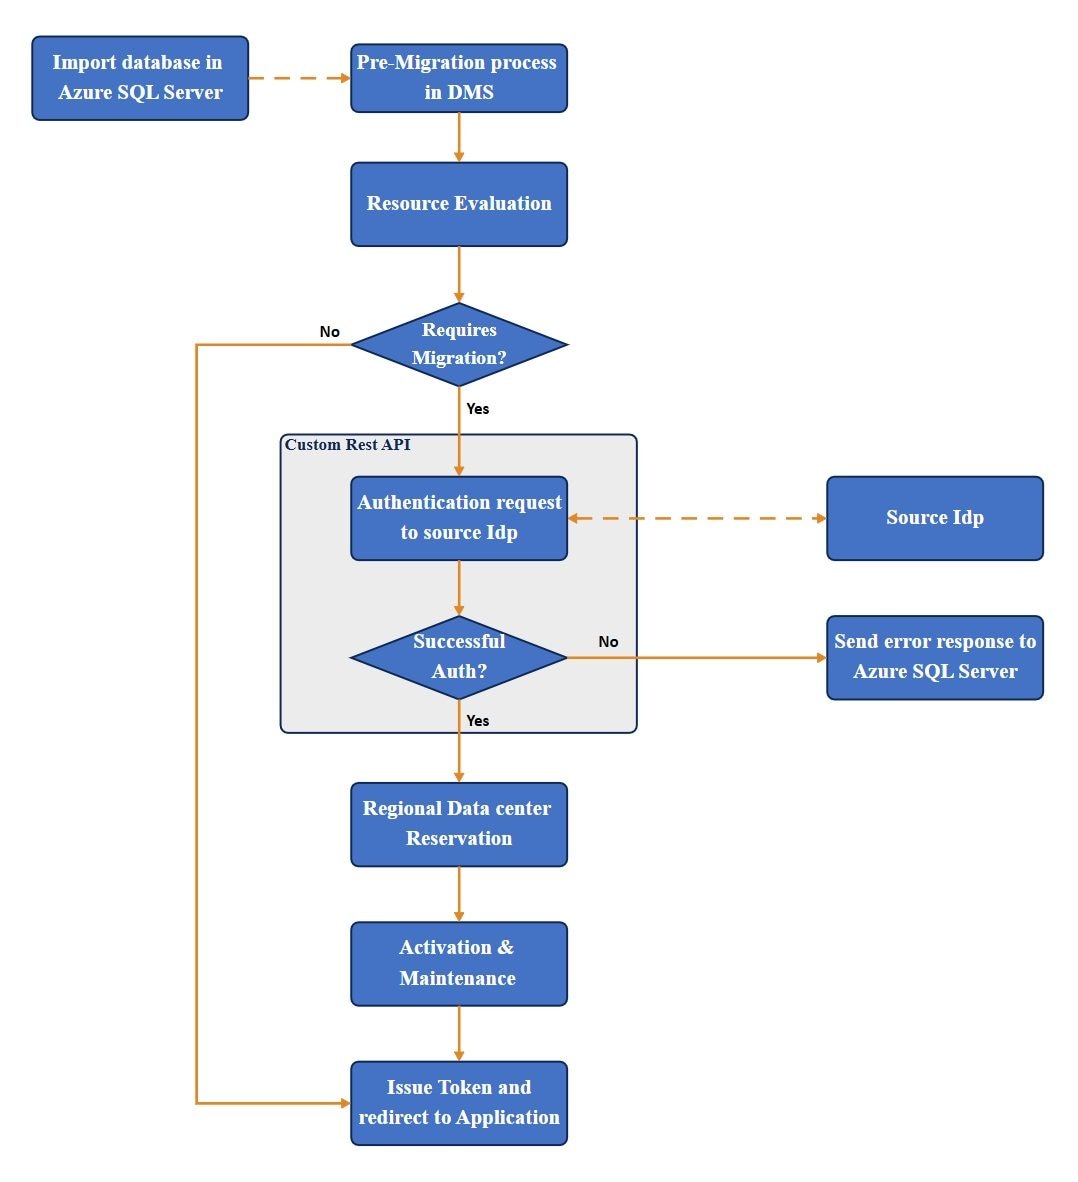
Azure SQL Server Data Migration Flow
This diagram shows the data flow through Azure SQL Server. First, you import your database. Then, there’s a round of pre-migration checks. For authentication, a custom REST API connects to your source identity provider. Once you’re in, the data heads to a regional data center and finally, the system issues a token so your application can access everything.
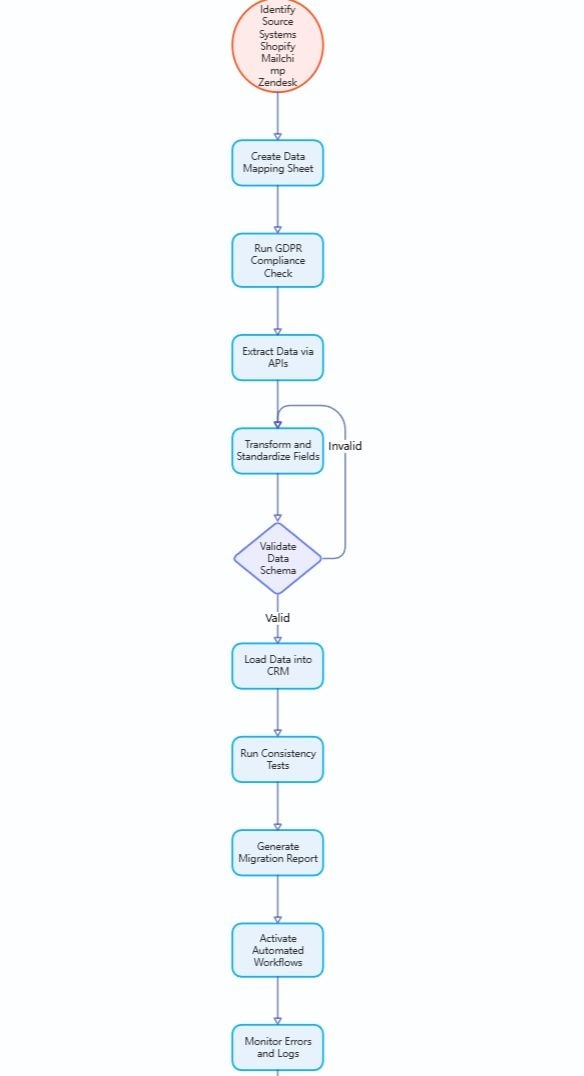
CRM Data Migration Flow
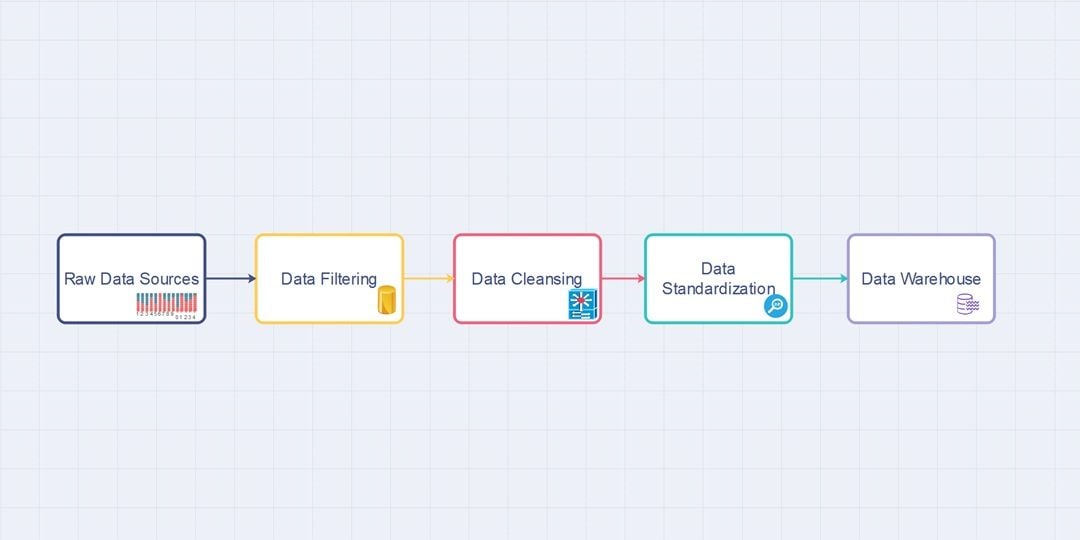
This data migration diagram example outlines the migration of data from multiple platforms like Shopify, Mailchimp, and Zendesk, into a CRM system. It maps everything out and makes sure you’re following GDPR rules. Then, you pull the data, clean it up, and check that everything looks right. After that, you load it into the CRM.
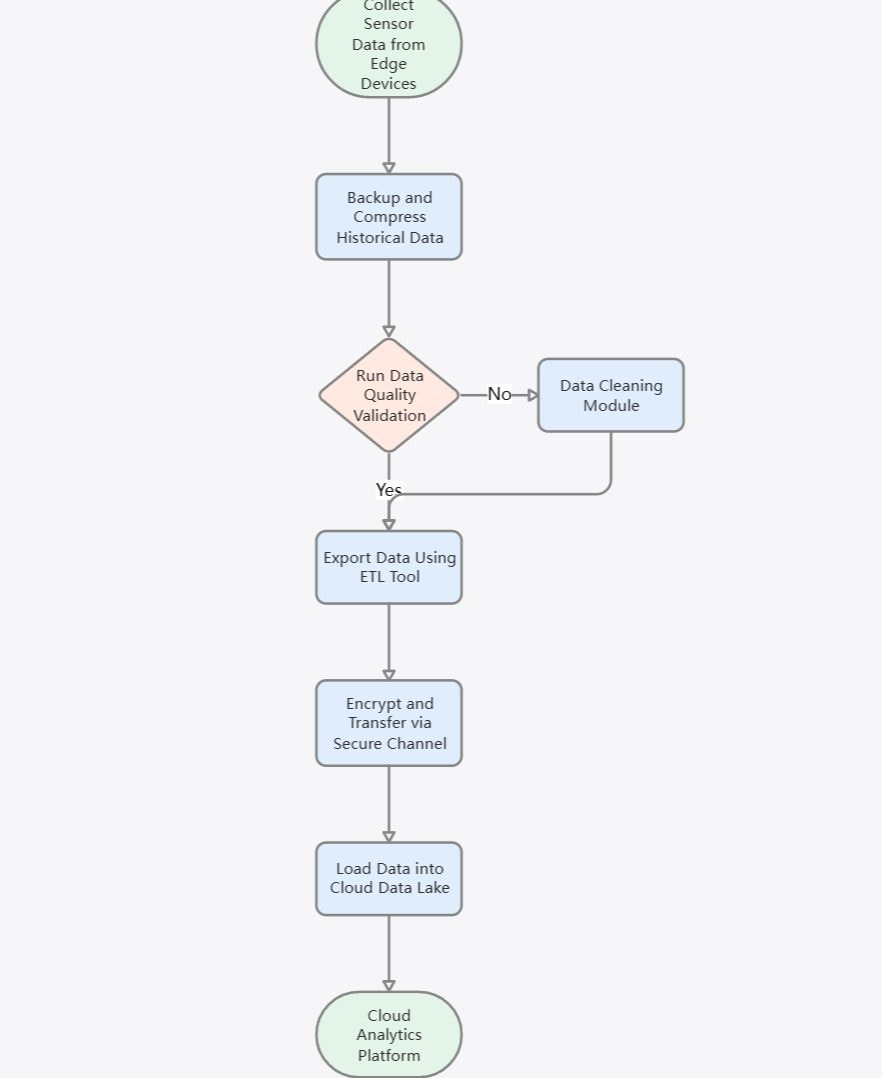
Cloud Data Lake Migration Flow
This diagram shows how sensors on edge devices gather data, back it up, and compress it right away. After a quick quality check, the data heads out through an ETL tool. It gets encrypted, travels through a secure connection, and lands in a cloud data lake. That’s where the real analysis and reporting kick in.
Why Use a Process Flow Diagram for Data Migration?
Here are five unique ways it adds value to a migration project:
Visualizing Data Relationships
Data never just moves in a straight line. A process flow diagram lays out how different systems and datasets link up. You can actually see the path data takes from one point to another. This way, it’s a lot easier to see how a change in one spot can ripple out and affect the whole process.
Improving Team Coordination
When you’re handling migrations, you’ve got a bunch of teams trying to work together. A simple visual diagram can do wonders. No need for endless meetings or back-and-forth emails. Everyone just checks the diagram, sees what comes next, and stays on the same page. This cuts down on confusion, no matter which department they’re in.
Detecting Risks Early
Laying out every step in a visual way makes problems visible. Teams spot missing checks or pointless loops before they even get started. This kind of upfront clarity helps you dodge failed transfers and data loss down the line.
Simplifying Compliance and Auditing
Many migrations need to follow strict data security or privacy rules. With a process flow diagram, you can see exactly where sensitive data goes and how people handle it. This makes life easier for auditors and compliance officers. They can check every step and see that everything lines up with the rules.
Supporting Continuous Optimization
Even after the migration’s done, the diagram still matters. Teams can look back at it to make the next transfer smoother. When they dig into how things flow and what results they got, they spot chances to automate more, speed up validation, or handle mistakes better.
How to Create a Data Migration Process Flow Diagram
Here’s a simple guide to creating an effective diagram that captures every critical stage of the migration process.
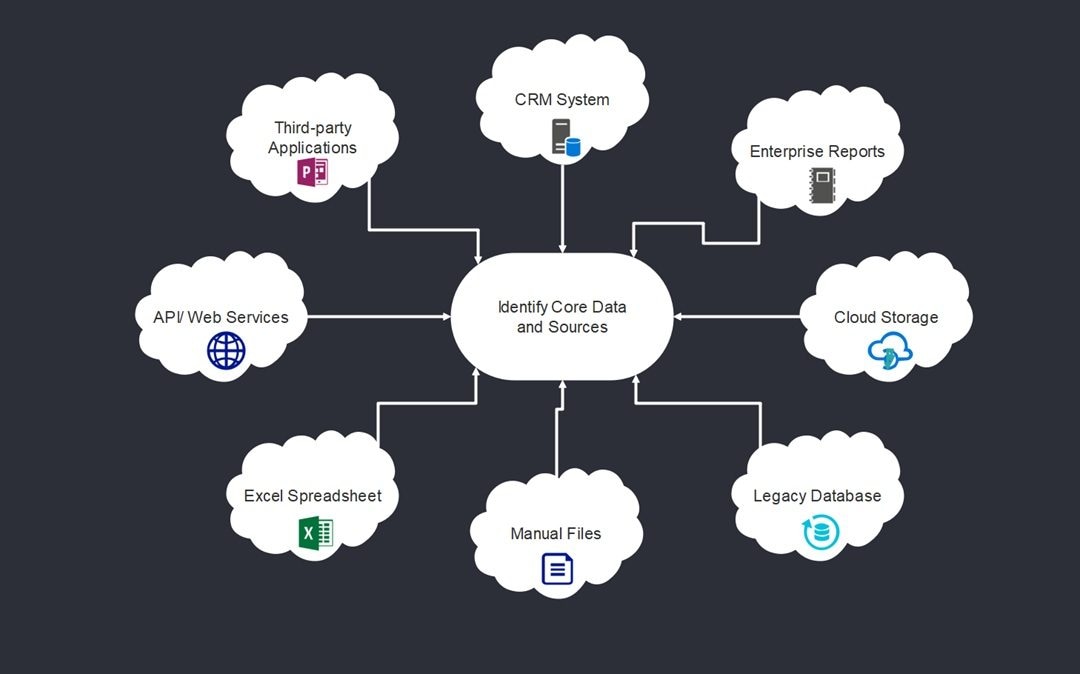
Step1 Identify Core Data and Sources
First, make a list of every system, file, and database where your data lives. Get a clear sense of what kind of info each one holds and why it matters. That way, you skip over old or duplicate stuff and keep your migration focused on the data that actually counts.
Step2 Outline the Flow and Transformations
Trace how data travels from its starting point to its destination. Mark the spots where you’ll filter, change, or check the data. When you lay out these connections in your diagram, it’s easier to spot what depends on what. Seeing all the transformations in one place also makes it easier for developers and analysts to stay in sync.
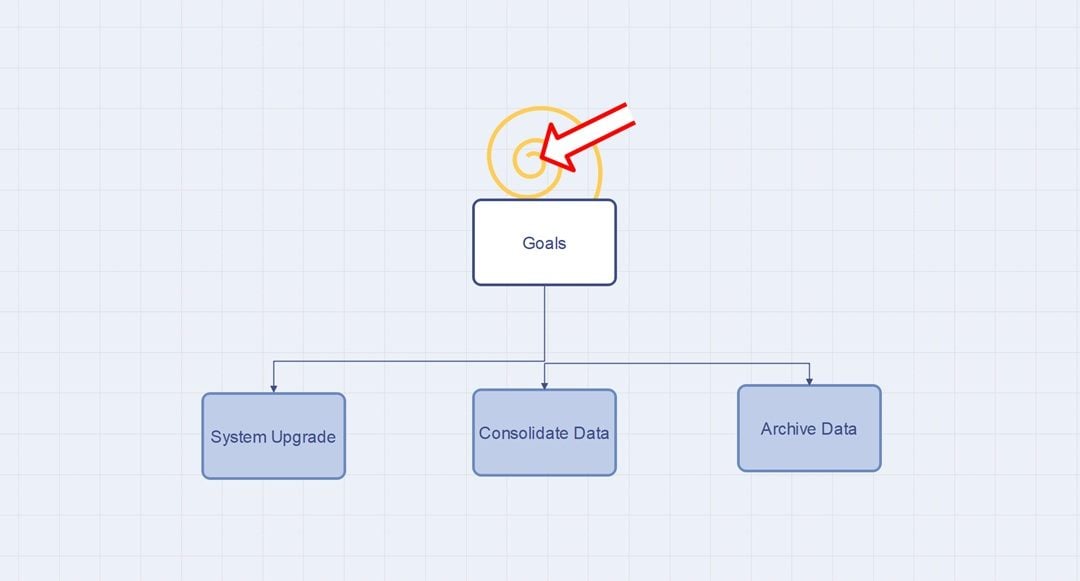
Step3 Set Clear Goals and Boundaries
Figure out what you’re actually after with this migration. Are you aiming for a system upgrade or maybe pulling everything together on one platform? Get specific. Pin down goals you can measure. Decide which data stays put, what needs to move, and what you’ll archive. Doing this keeps the project focused and steers everyone in the right direction.
Step4 Plan the Tools and Roles
Pick out the right software tools, APIs, and decide who on the team handles each task. Make it clear who owns what. Show these roles in the diagram, too. That way, everyone sees exactly which team or tool handles each part of the process.
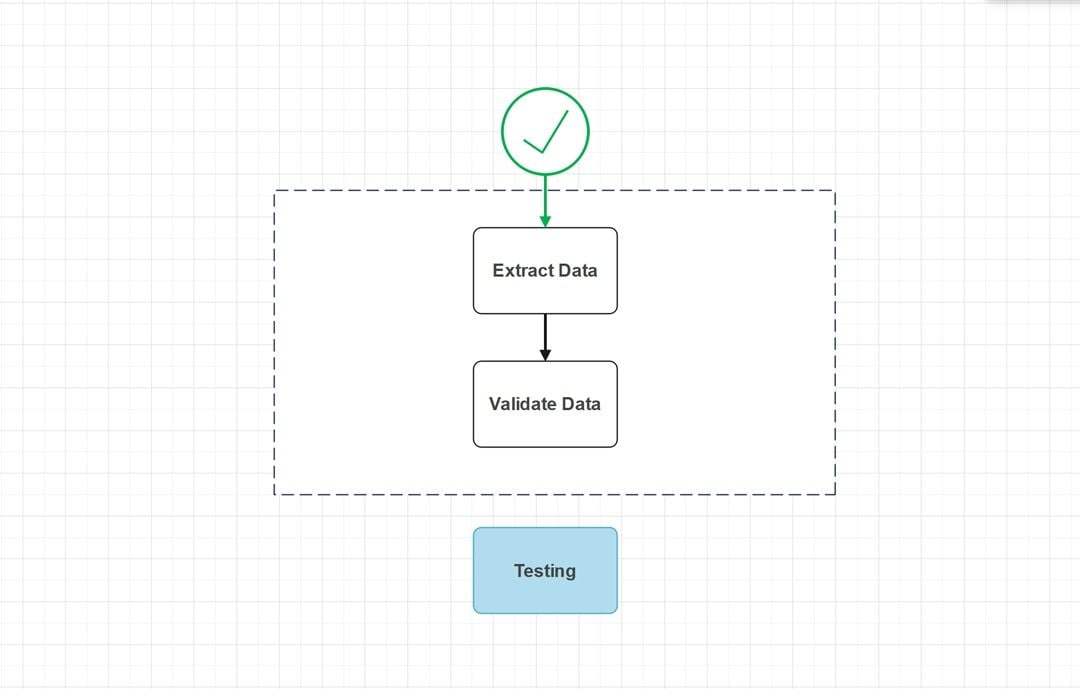
Step5 Validate and Test the Workflow
Don’t jump into the migration just yet. First, walk through your diagram. Make sure every data path lines up, and nothing’s missing. Each transformation or validation step should be on point. Testing the flow now lets you spot mistakes early, so you’re not scrambling to fix problems after the process.
Step6 Execute, Monitor, and Optimize
Once your diagram’s ready, it’s time to put it to work. Keep an eye on the workflow as data moves through. Take notes on anything that goes wrong. As you fine-tune the process, update the diagram. Think of it as a living document; with every migration, it gets a little better.
Best Practices & Common Pitfalls
Below are key practices to follow and pitfalls to stay away from.
Best Practice 1: Define the Scope Early
First things first, figure out exactly what data you’re moving, where it’s headed, and who’s in charge. Laying all this out early keeps everyone on the same page and avoids those “wait, who’s doing what?” moments. Teams that skip this part usually end up lost in a mess of shifting priorities.
Best Practice 2: Keep the Diagram Simple and Consistent
Make your diagram easy to follow. Stick to clear symbols, short labels, and keep the layout steady throughout. When you keep things simple, everyone from tech folks to novices can get the idea fast. Throw in too many details or clutter, and you just end up confusing people and dragging out decisions. So, don’t overthink it.
Common Pitfall 1: Skipping Error Paths
Teams love to map out the perfect scenario, but they forget about what happens when things go wrong. A solid diagram needs backup plans and clear ways to handle errors. If you leave those out, small issues can spiral and slow down the whole migration.
Common Pitfall 2: Ignoring Teamwork
Data migration isn’t a one-department job. If teams go off and do their own thing, the diagram stops being useful. When everyone keeps talking and sharing updates, people actually get what’s happening. This way, they can spot problems before things go off the rails.
AI Diagram Generator
Enter your prompt. Upload files if needed. Generate diagrams, charts, or slides instantly.
