Modeling a process looks simple until you're halfway through and realize you've missed half the logic. That's why I rely on IDEF0 flowcharts. They're purpose-built for showing exactly how a system works and what makes it run.
Manual creation, though, becomes a blocker fast. Drawing every interaction takes too long and opens room for error.
EdrawMax solves that. Its IDEF0 Diagram templates let me start from a functional base and focus on clarity, not layout. I spend more time refining systems and less time redrawing lines.
In this article
What Is an IDEF0 Flowchart?
An IDEF0 flowchart breaks down a system into its components, allowing you to see how everything works together. It shows each function, what triggers it, what it needs to run, and what it produces.
It's useful when you want a big-picture view without getting into complex technical stuff. Each box represents a function or activity. Arrows connect to that box from four directions:
- Inputs come in from the left.
- Controls, like rules or policies, drop in from the top.
- Outputs leave on the right.
- Mechanisms, like tools or people, are drawn from below.
This layout follows the IDEF0 format, based on the SADT (Structured Analysis and Design Technique) method. You start with a top-level diagram labeled A-0 and then zoom into smaller, detailed sections by opening child diagrams.
Why Use IDEF0 Flowcharts Templates?
Building IDEF0 flowcharts manually is slow, not because it's hard, but because functional modeling demands precision. You can't wing it. You need to trace every control, resource, and output clearly.
Templates do most of that setup for you. They let you focus on content, what task you're mapping, and what data flows through, rather than shape alignment or diagram logic. You choose a model that fits your use case, then fill in your data.
That's especially helpful when you're under a deadline. Instead of spending half a day creating the diagram structure, you can generate multiple versions in minutes and get feedback from the team. Test ideas, not box positions.
And when you're dealing with stakeholders who aren't familiar with IDEF0, templates can help you present complex systems more clearly. The structure is already readable.
Best IDEF0 Flowchart Templates
Here are some of the best templates from EdrawMax that I usually use to make IDEF0 Flowcharts:
Template 1
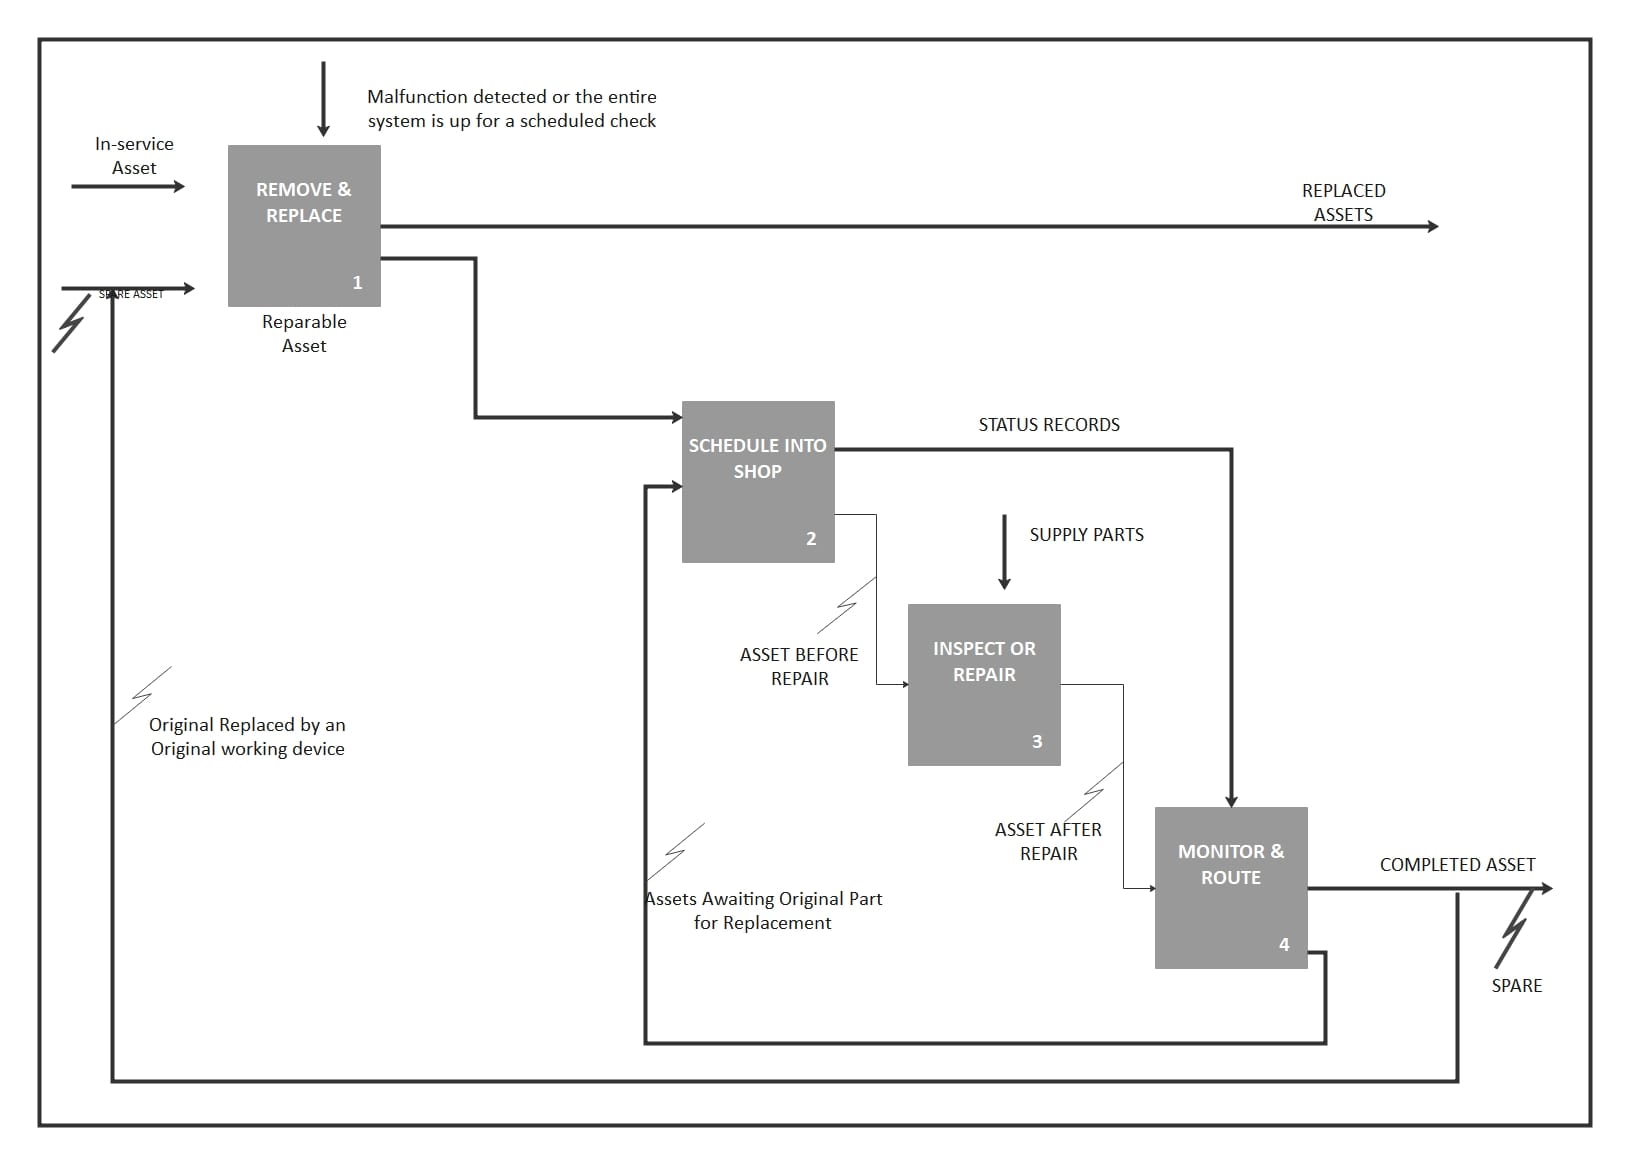
The diagram uses the IDEF0 method to show a structured flow for asset maintenance. It tracks how assets move from being in service to either being repaired or replaced.
Inputs like "In-service Asset" and controls like "Malfunction Detected" shape each stage of the process. Outputs such as "Replaced Asset" and "Completed Asset" help teams measure what's done.
Arrows show how staff and tools support the work. It also highlights key decisions, such as whether to repair, inspect, or replace something.
This diagram is valuable for people managing equipment in manufacturing or transport. It encourages clear, repeatable steps and helps reduce wasted time and confusion.
Template 2
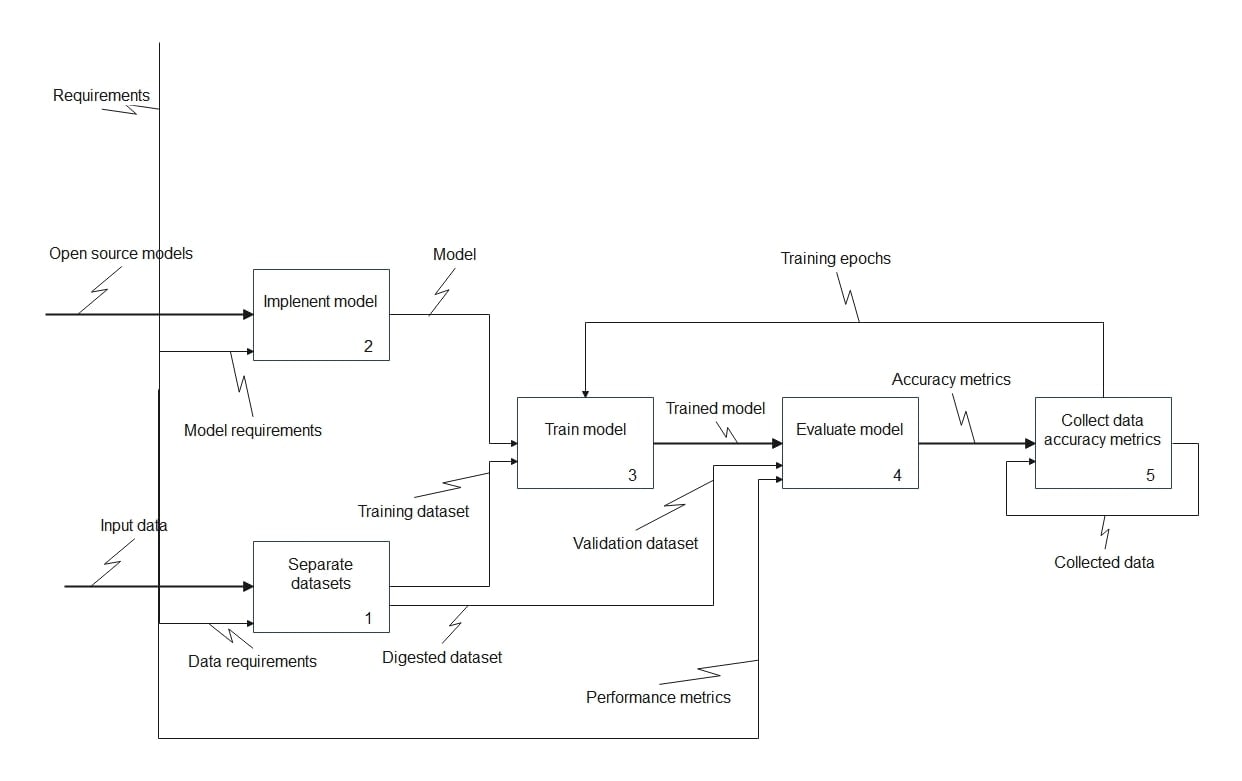
This IDEF0 diagram shows the whole process of training a machine learning model. It starts with preparing the dataset and ends with checking accuracy.
Each block has a clear label, like "Separate datasets," "Train model," and "Evaluate model." Input data and controls, such as training epochs, feed into each task. Outputs, such as the trained model and performance metrics, display the results. The arrows also suggest tools like hardware and algorithms behind the scenes.
This layout is helpful for data science teams who want a clear view of each step. It facilitates documentation, enhances teamwork, and simplifies the overall process.
Template 3
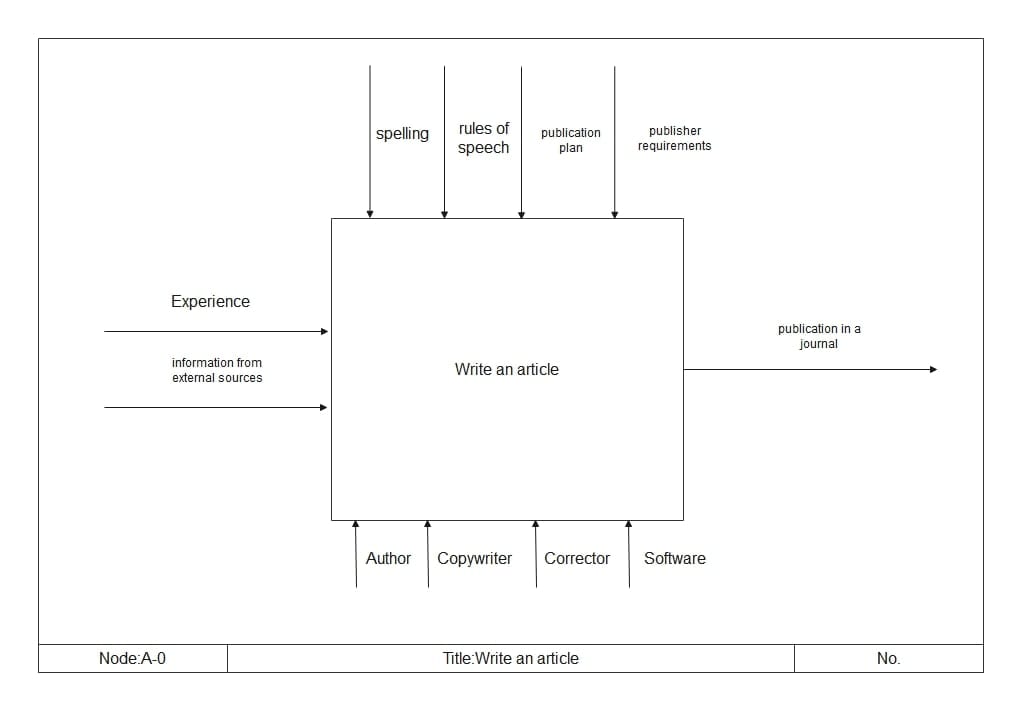
This IDEF0 Node A-0 diagram maps out one main task: writing an article. The inputs, experience, and source information flow into the process.
Controls like spelling rules and publisher requirements guide how the article is written. The output is clear: a finished, published article.
With a clean and easy-to-follow approach, it can be a great way to introduce process modeling without getting too technical.
Content creators, teachers, or anyone new to IDEF0 can use this as a starting point. Each arrow plays a distinct role, indicating what moves the process forward.
Template 4
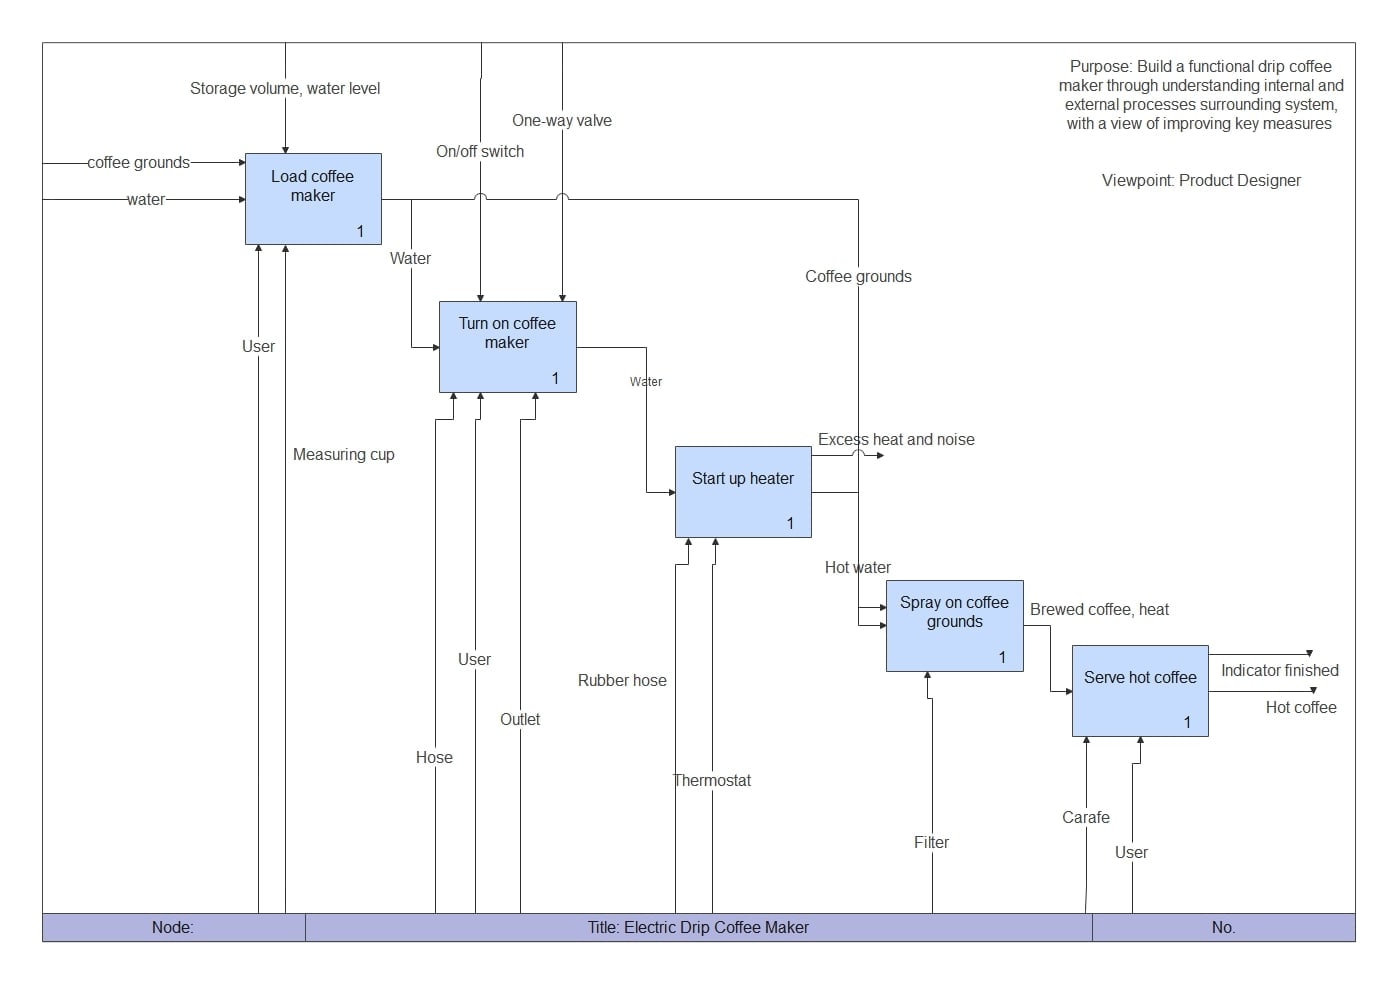
This IDEF0 diagram shows how an electric drip coffee maker works step by step. It begins with loading the machine and moves through brewing to serving.
Inputs include water and coffee grounds. Controls like the thermostat guide the process. The carafe and heating element handle the work. The outputs are hot coffee and used grounds.
Each step is clear and organized, making it easy to see how everything connects. Labels like Purpose and Viewpoint give more context.
This kind of model is helpful for designers, engineers, or training teams. It helps explain the system, test how parts behave, and improve the user experience.
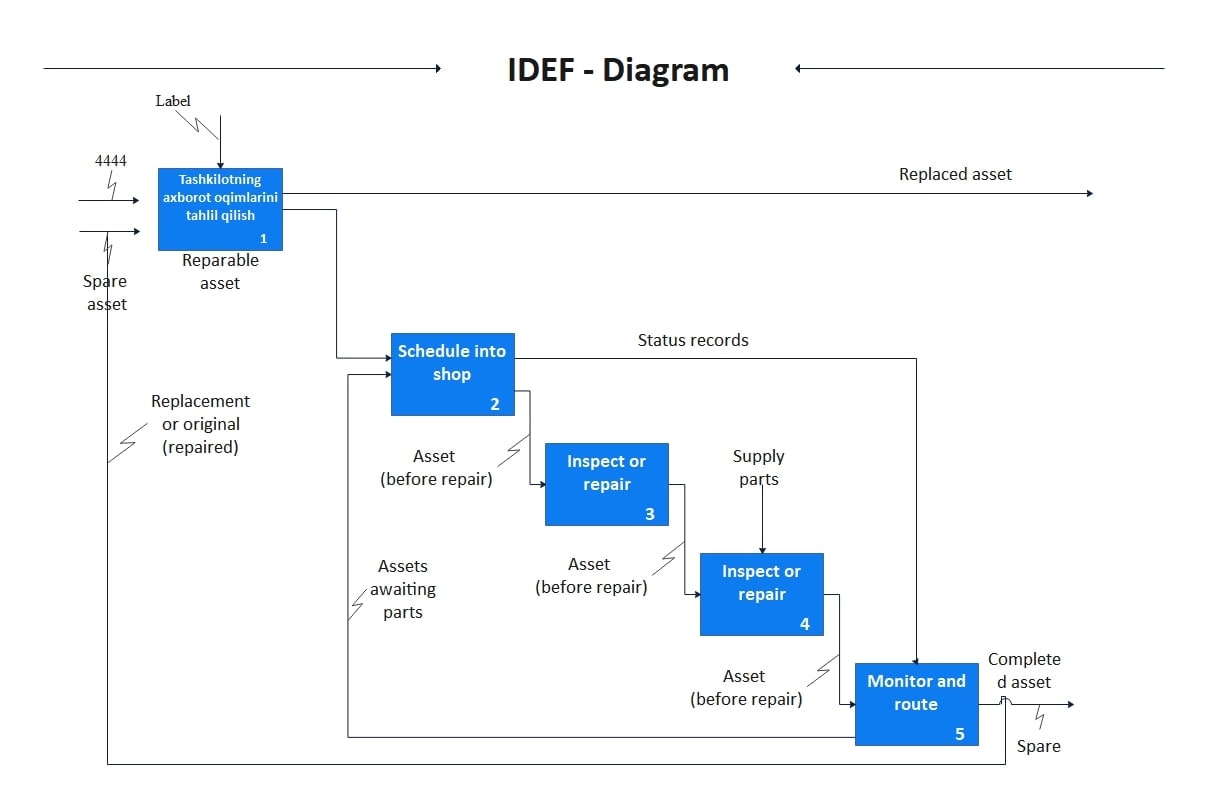
Template 5
Although the first box uses a foreign label, this IDEF0 template performs its job well. It lays out the steps for repair and replacement using familiar symbols.
You can follow the process from asset checks to part supply, inspection, and approval. Inputs include Spare Assets, and outputs like Replaced Asset and Completed Asset show what's done. The arrows walk you through the process clearly.
The structure fits well in industries where equipment requires regular maintenance. It's a solid template for planners and supervisors who want to reduce downtime and effectively track assets.
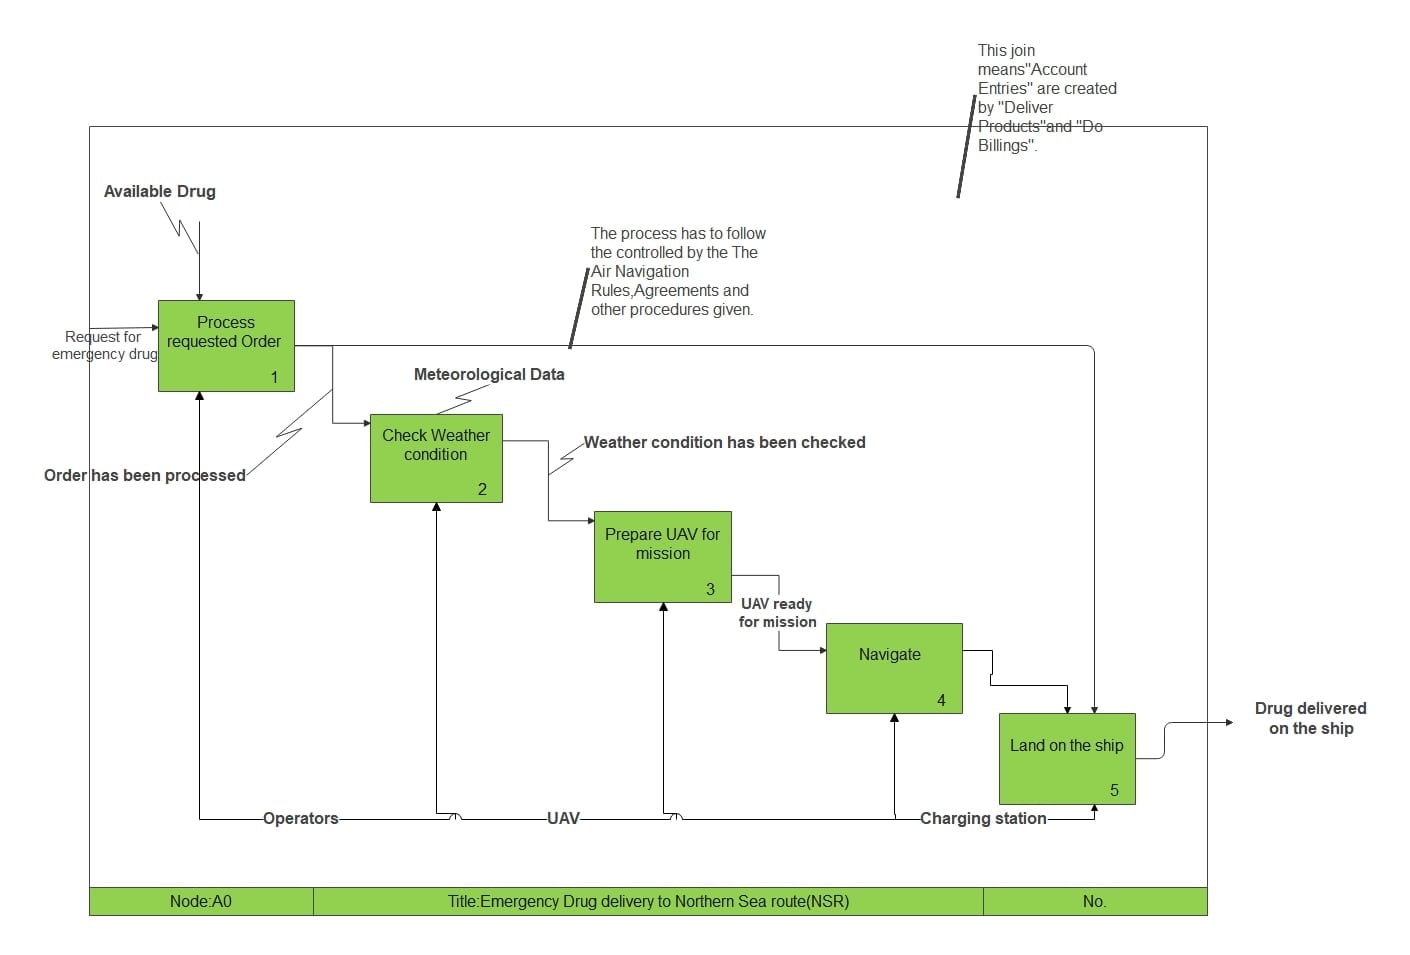
Template 6
The IDEF0 diagram models how emergency medicine is delivered to remote points along the Northern Sea Route.
It includes key actions like order intake, weather checks, UAV loading, and delivery. The process stays compliant through controls such as navigation rules and scheduled flights. Inputs like weather data and drug stock influence how choices are made. Delivery is done through drones and trained operators.
This diagram is well-suited for planning in strict environments, such as emergency services or regulated logistics. It illustrates how parts connect, where resources are required, and how to maintain everything within limits.
How to Customize IDEF0 Flowchart Templates?
When I build IDEF0 flowcharts, I use EdrawMax because it keeps things simple. Everything, from shapes to labels, can be moved freely. I've worked with other tools before, but EdrawMax helps me get to a clean, usable diagram faster.
How to Make an IDEF0 Flowchart Using a Template in EdrawMax?
Here's how I customize IDEF0 templates in EdrawMax:
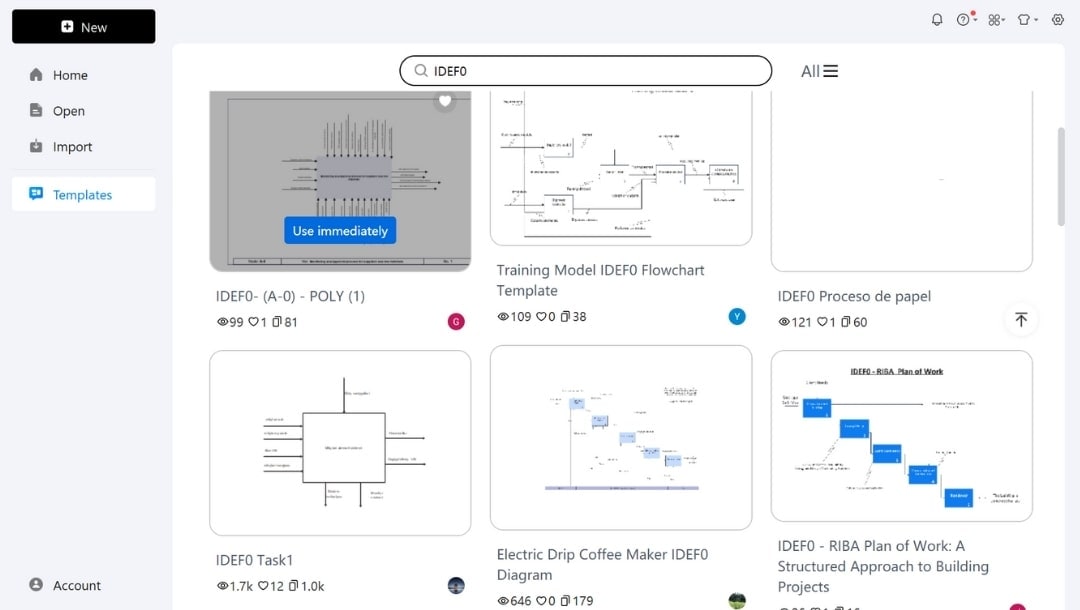
Step1Open the IDEF0 Template
- Launch EdrawMax and go to the Templates tab.
- Find "IDEF0" in the template library.
- Click Use immediately on the one you want, and it opens in the canvas instantly.
Step2Edit Text Labels
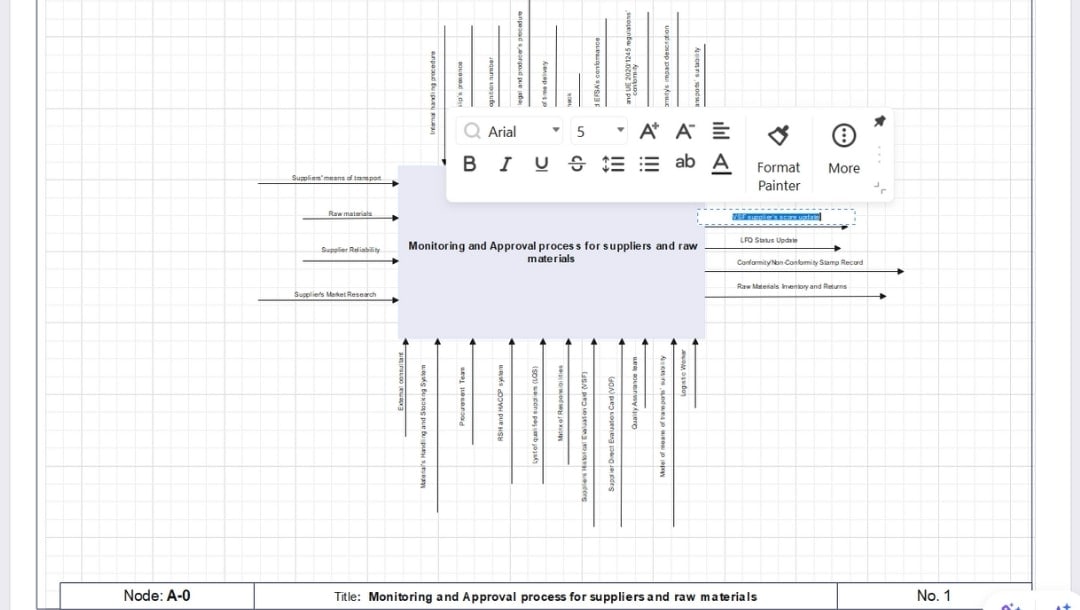
In the bottom title block, edit:
- Title to reflect your customized process
- Node ID if you're creating additional child diagrams
- Diagram No. if you're building a series
- Double-click any element (arrow or process box) to change the text.
- Update the process title and input/output/control labels as per your actual use case. For example, change "VSF supplier's score update" to something more context-specific, like "Vendor Evaluation Score."
- Rename "Raw Materials Inventory and Returns" if your team uses a different terminology.
- Use the mini pop-up menu to modify font size, color, style, etc.
Step3Modify or Add Elements
- Click and drag arrows to adjust their angle, position, or alignment if they look too cluttered.
- If your process involves new departments or tools (e.g., ERP system, QA analysts), drag new rectangles or role icons from the Symbols library on the left side.
- Search for the required shapes in the library's search bar.
- Label and connect them to the process using mechanism arrows.
To add a new flow:
- Use the Connector tool under the Home tab to draw a new arrow.
- Label it as Input, Output, Control, or Mechanism as needed.
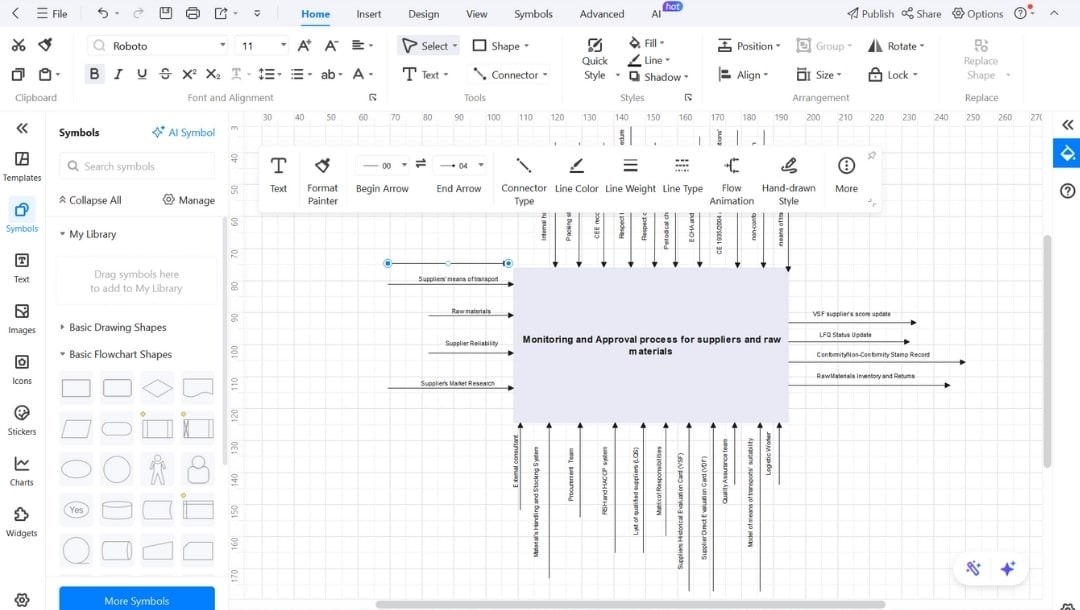
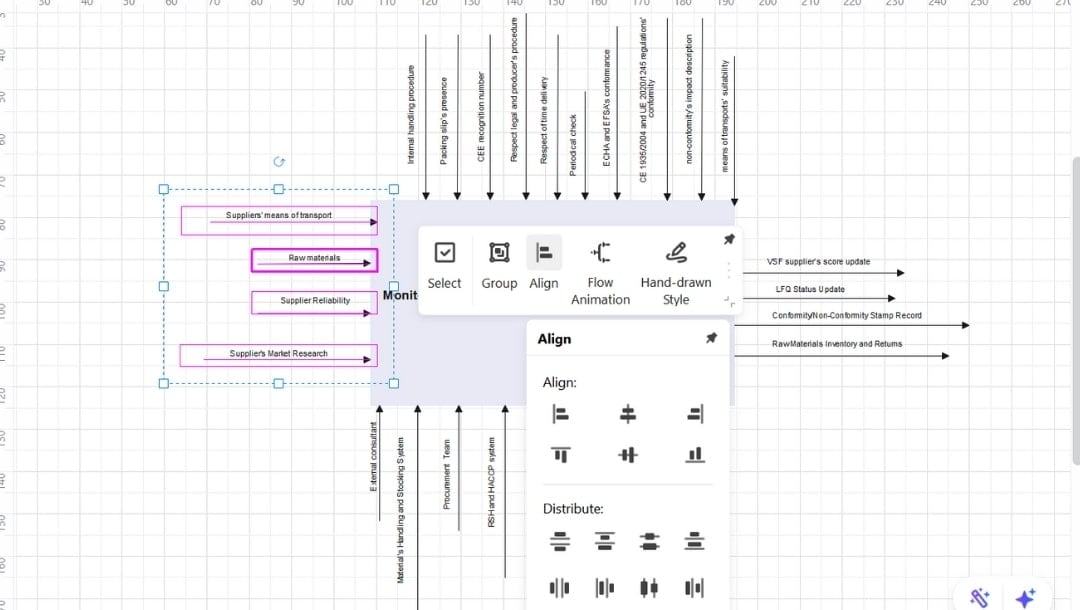
Step4Align Elements and Clean Up Layout
- Select multiple elements and use the Align and Distribute tools in the mini menu to make sure everything lines up neatly.
- Clean spacing makes a significant difference, especially when presenting or sharing.
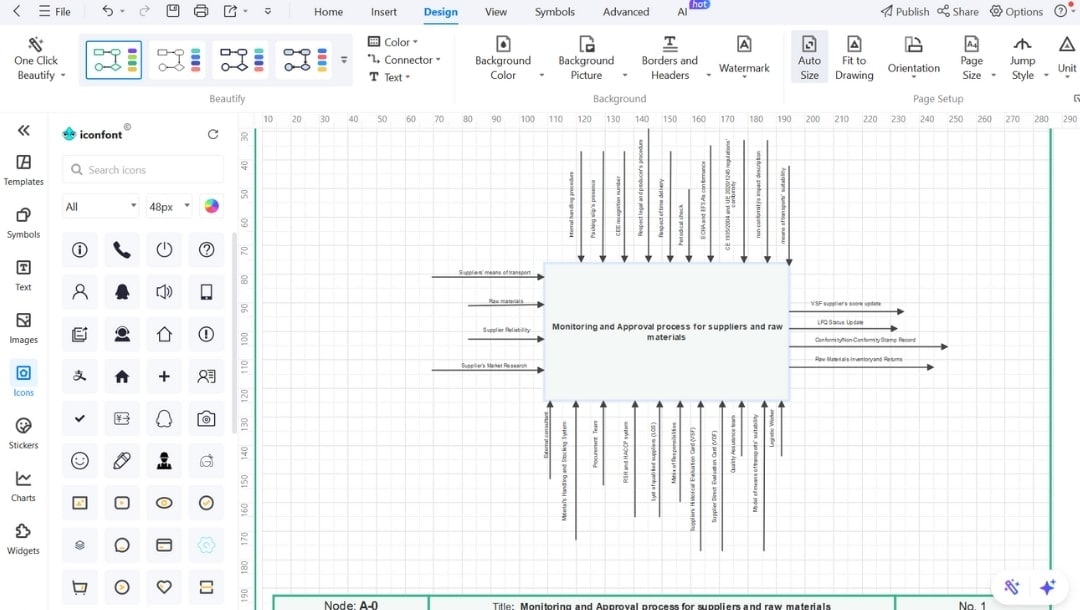
- Go to the Design tab and modify theme colors quickly.
- You can also use the Instant Change Style button in the bottom right corner to modify colors with one simple click.
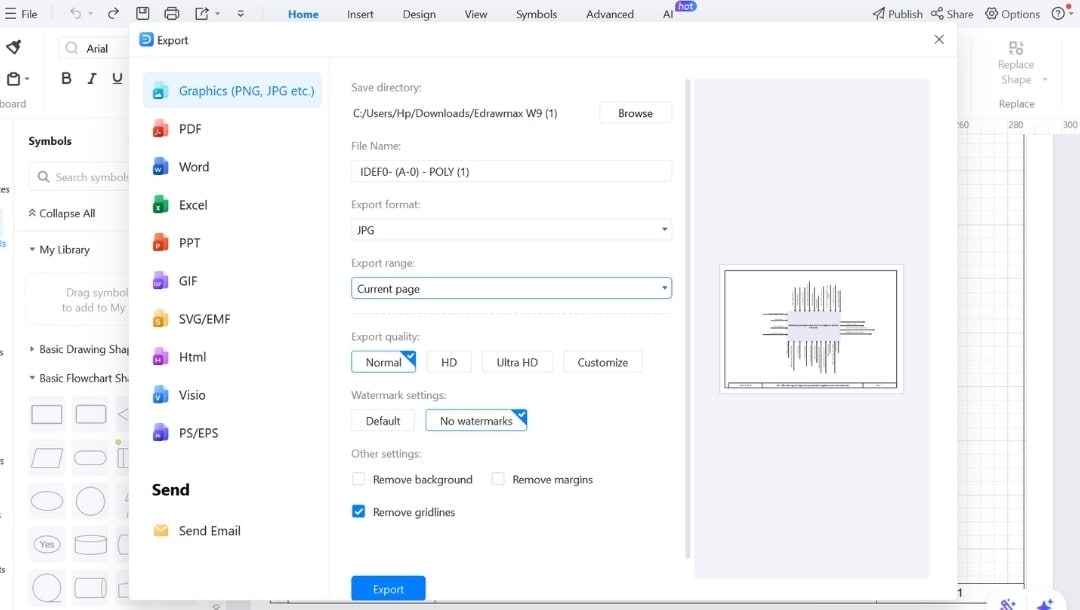
Step5Save and Export
- Once finalized, hit CTRL+S to save it.
- Click the export icon and select your required settings to download the chart as:
- PDF for printing
- PNG or JPG for presentations
- SVG for website use and more
Why EdrawMax?
EdrawMax takes care of the structure so you can focus on the logic. It's the fastest way to build solid IDEF0 flowcharts without getting stuck in the details.
Here's why it works:
- Built-In IDEF0 Symbols: All standard IDEF0 shapes, functions, inputs, outputs, controls, and mechanisms are ready to drag and drop. No hunting for symbols.
- 30k+ Templates: Skip the blank page. Use editable templates based on actual workflows to expedite diagram creation and enhance clarity.
- Smart Connectors & Layouts: Connectors snap and align automatically. Diagrams stay neat, readable, and logically structured; no manual tweaking needed.
- Flexible Export Options: Export to PDF, Visio, Word, PowerPoint, or images, whatever fits your workflow.
- Cloud Sync + Cross-Device Access: Start on desktop, mobile, or online. Your diagrams are always synced and version-safe.
- Minimal Learning Curve: Clean interface, tooltips, and built-in guides make it easy to get started, even if you've never used IDEF0 before.
Top Tips for Creating Professional IDEF0 Flowcharts
These practices help me build IDEF0 diagrams that don't just look right; they work when it counts.
- Start with a defined scope. Before I touch any tool, I write down three things: the process I'm diagramming, where it starts and ends, and what's involved at each step. This helps avoid extra pieces that don't belong. If I'm mapping returns, I don't include shipping or inventory.
- Draw arrows first. I focus on flows, inputs, outputs, controls, and mechanisms before I place any boxes. Once that's set, the functions fall into place naturally.
- Label with actions. I always use active phrases like Process Payment or Review Ticket. Labels like Module A don't mean anything to most people and only slow things down.
- Make it instantly readable. I show the draft to someone unfamiliar with the project. If they hesitate, I revise spacing, labels, or layout. The goal is clarity at first glance.
- Let color serve a role. I color-code arrows by type, input, control, and mechanism so the chart is visually apparent. I avoid colors that don't add meaning.
Final Words
EdrawMax makes IDEF0 flowcharting less of a chore and more of a strategic task. Its templates save you from starting at zero and help you focus on decisions, flows, and outputs.
I use it when I need to move fast and still create diagrams my team can understand at a glance. The built-in symbols and layout tools make sure nothing gets lost in translation.
If your goal is clarity without chaos, this tool gets you there. Give it a shot now.


