


If you've ever tried designing an org chart that works beyond 10 people, you know how fast things break without a system. Coca-Cola didn't get its model right by accident.
Its structure helps it coordinate across continents, align local campaigns, and launch products globally, all at once.
In this write-up, I'll dissect Coca-Cola's system into practical insights. Whether you're scaling a business, resolving communication bottlenecks, or constructing a hybrid structure, Coca-Cola's organizational structure offers patterns you can readily apply.
It's not just for corporate fans but for anyone managing people across functions or locations. You'll walk away with a structure you can model immediately, even if you're managing cross-functional teams or scaling operations fast.
I'll also explain how you can create an org chart yourself. So let's get in.
In this article
Matrix Organizational Structure of Coca-Cola
Coca-Cola uses a matrix structure that blends functional expertise with geographic focus. This setup creates two reporting lines, one for core functions like marketing or finance, and another for regional divisions. The goal: balance global consistency with local responsiveness.
Key Features
Functional Dimension
- Departments like R&D, marketing, and finance report to global functional heads.
- These heads set shared standards, tools, and performance metrics.
- Functional leaders are part of the Executive Leadership Team (ELT).
Geographic Dimension
The company operates across four main regions:
- North America
- EMEA (Europe, Middle East & Africa)
- Latin America
- Asia Pacific
Two global groups, Global Ventures and Bottling Investments Group (BIG), oversee acquired brands and bottling partners.
Each region adapts products and delivery methods to local needs.
Dual Leadership Model
- Employees report to both a functional lead and a regional manager.
- This ensures a unified global direction while remaining responsive to market shifts.
How It Works in Practice
- Functional expertise: Global R&D builds drink formulas; regional teams adapt them locally.
- Market focus: Each region runs campaigns aligned to local preferences.
- Cross-collaboration: Teams span marketing, finance, and sales, bridging functions and geographies.
- Innovation: Product innovation teams report to central and local leadership to accelerate feedback and support.
Why Coca-Cola Organizational Structure Matters?
- Defines goals, like new products, market growth, or sustainability, that shape the structure.
- Reveals approval flows for budgets and marketing plans.
- Shows how local insights reach global decision-makers.
- Identifies overloaded teams and extra reporting layers.
- Maps how departments collaborate and share updates.
- Tracks values in action via HR and regional leadership.
- Clarifies who owns what across finance, marketing, and operations.
- Outlines task flows from sourcing to packaging.
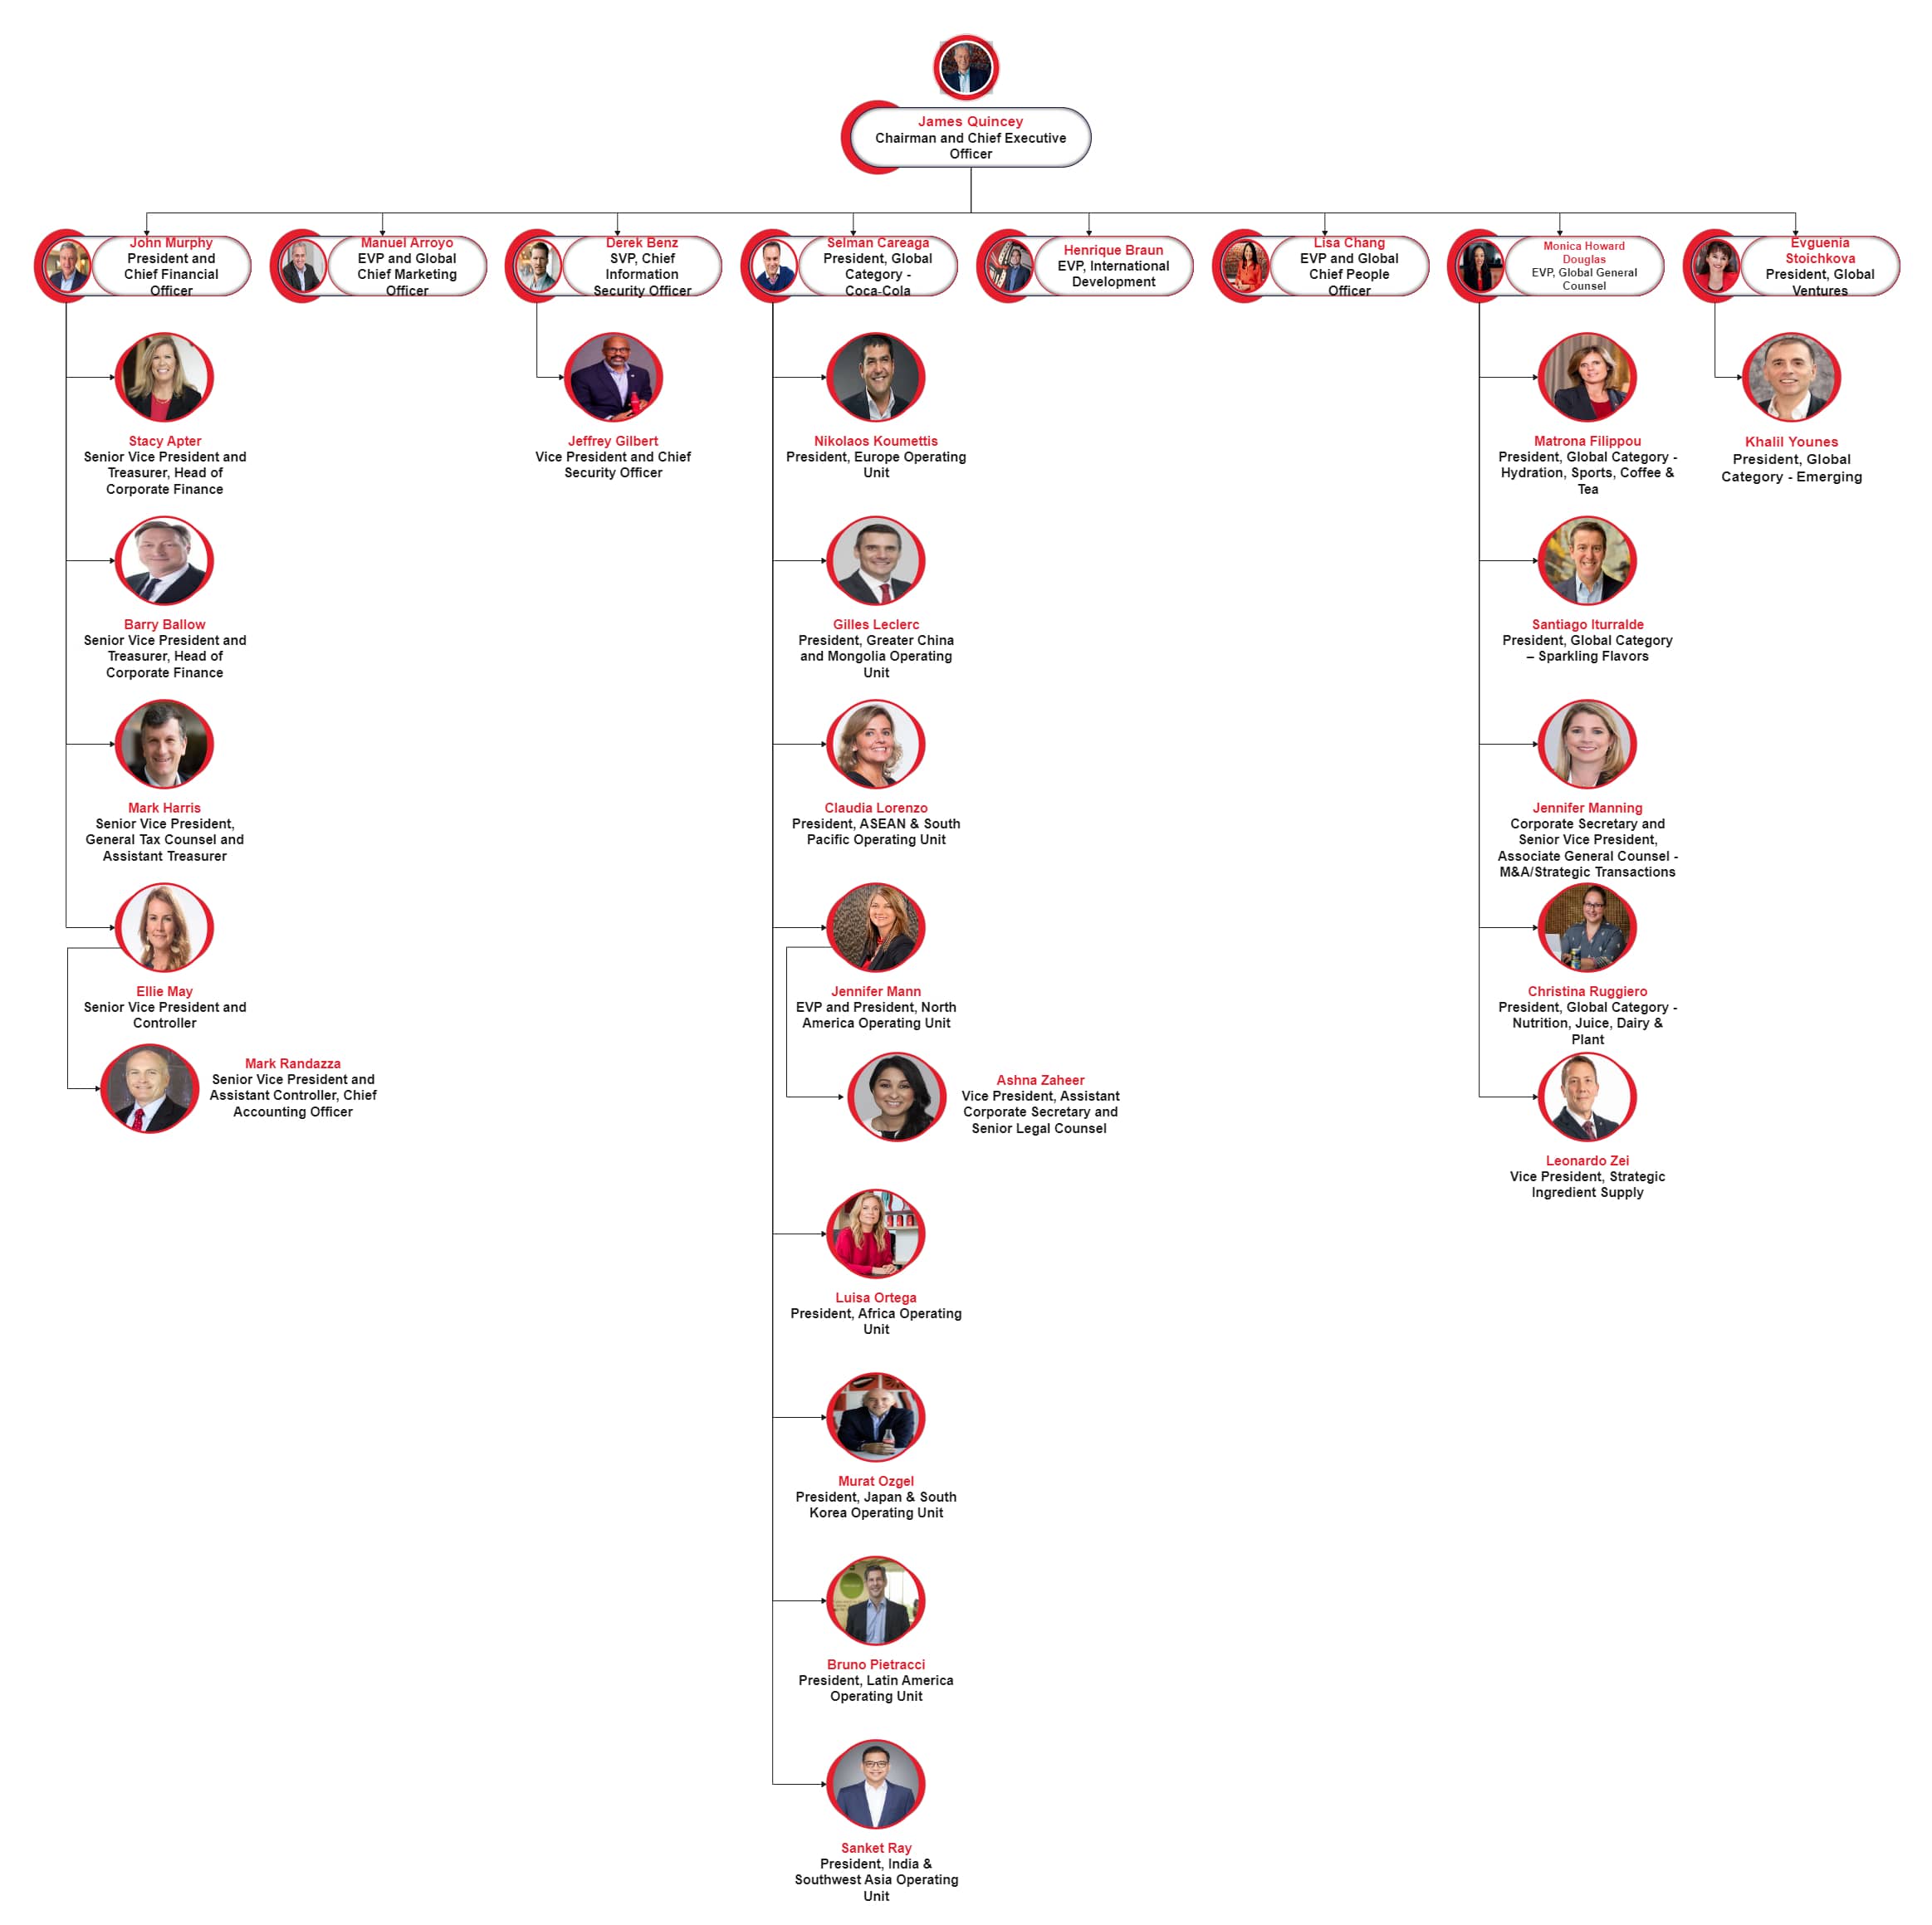
Key Components of Coca-Cola's Organizational Chart
Coca-Cola's matrix structure operates across three layers: Executive Leadership, Regional Management, and Functional Management. Each plays a distinct role in delivering global strategies.
Executive Leadership
Board of Directors
- Sets long-term vision and mission
- Approves high-level investments and M&A
CEO
- Leads the ELT and holds full business accountability
C-Suite
- CFO: Oversees finance and investor relations
- CMO: Leads branding, campaigns, and sponsorships
- COO: Manages logistics, supply chain, and manufacturing
- CTO: Handles IT systems and digital innovation
Global Committees
- Focus on ethics, sustainability, and risk
- Review metrics quarterly to update policies
Regional Managers
Four Major Regions
- North America
- EMEA
- Latin America
- Asia Pacific
Regional Presidents
- Own profits and operations
- Adjust global strategies to fit local needs
Regional Function Heads
- Lead marketing, finance, and supply chain at the regional level
- Report to both regional presidents and global function heads
Country Managers
- Tailor company goals to each market
- Liaise with bottling partners and retailers
- Ensure compliance with local regulations
- This layer ensures Coca-Cola remains globally consistent while responding locally.
Functional Managers
Core Functions
- Brand Development: Manages product flavor, packaging, and partnerships
- Finance: Oversees global financial systems and tax
- HR: Handles recruitment, training, and company culture
- R&D: Tests new formulas and ingredients
- Legal: Manages compliance and IP
- Supply Chain: Secures materials and handles logistics
Functional Vice Presidents
- Report to the relevant C-Suite leader (e.g., Marketing VP to CMO)
- Set targets and frameworks for execution
Cross-Functional Teams
- Built for special initiatives (e.g., regional product launches)
- Operate across departments to stay agile and connected
How It All Connects?
- Dual Reporting: Regional leads adapt global rules to fit local conditions; functional heads maintain consistency.
- Coordination Tools: Shared dashboards and regular meetings help track performance and course-correct in real time.
- Information Flow: Clear roles and structured communication prevent bottlenecks.
Coca-Cola's system balances centralized control with decentralized execution, supporting growth in over 200 countries.
How to Create Coca-Cola's Org Chart with EdrawMax?
EdrawMax lets me create clean, accurate org charts without design headaches or platform friction. Here's how it earns a permanent place in my workflow:
- 20,000+ Templates & Over 26k Symbols: I skip blank canvases and grab ready-made icons, no redrawing needed.
- Drag-and-Drop Interface: Moving boxes and connectors takes seconds.
- One-Click Styling: I apply brand colors or fonts across all nodes instantly.
- Cross-Platform Access: I edit on Windows, Mac, or Android, with the same experience everywhere.
- Multiple Export Options: One chart becomes an SVG for the site, a PDF for print, a PPTX for presentations, and more.
- Infinite Canvas: I map over 200+ leads without resizing or cramming boxes.
- Built-In Presentation Mode: I pitch directly from the chart. There is no need to recreate slides.
EdrawMax helps me build, edit, present, and share org charts faster, with zero tech stress and total control.
Steps to Make Coca-Cola's Org Chart Using a Template
Here's how to build Coca-Cola's org chart in EdrawMax using a premade template. I keep every step simple so it's easy to follow.
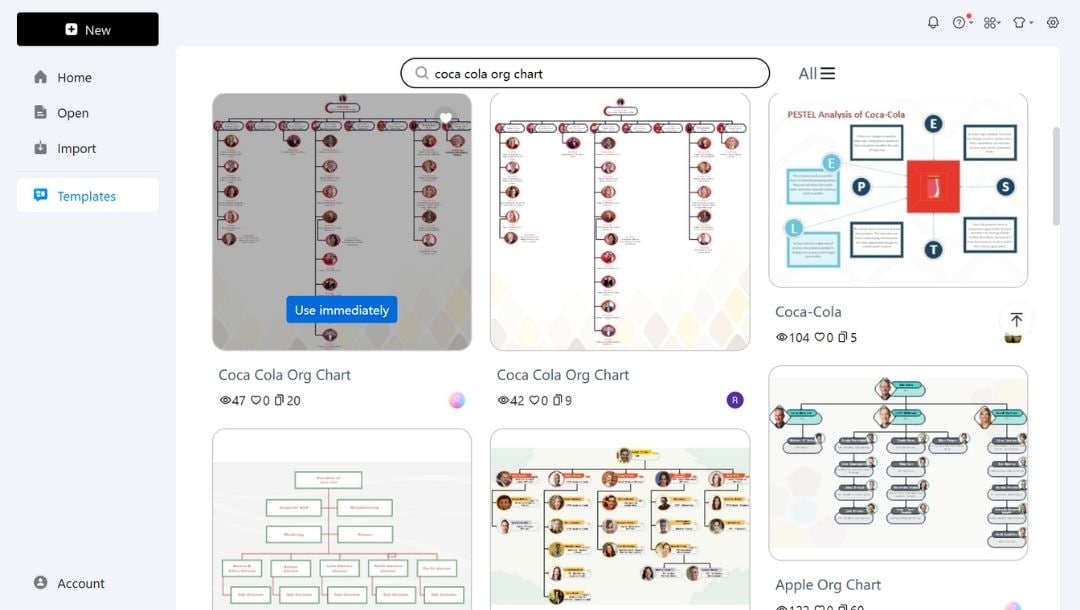
Step1Select the Pre-Made Template
- Open EdrawMax and go to the Templates section on the left panel.
- Type Coca-Cola organizational chart in the search bar and tap Enter.
- Click a template to see a larger preview. Or hit Use immediately on the one closest to Coca-Cola's matrix structure.
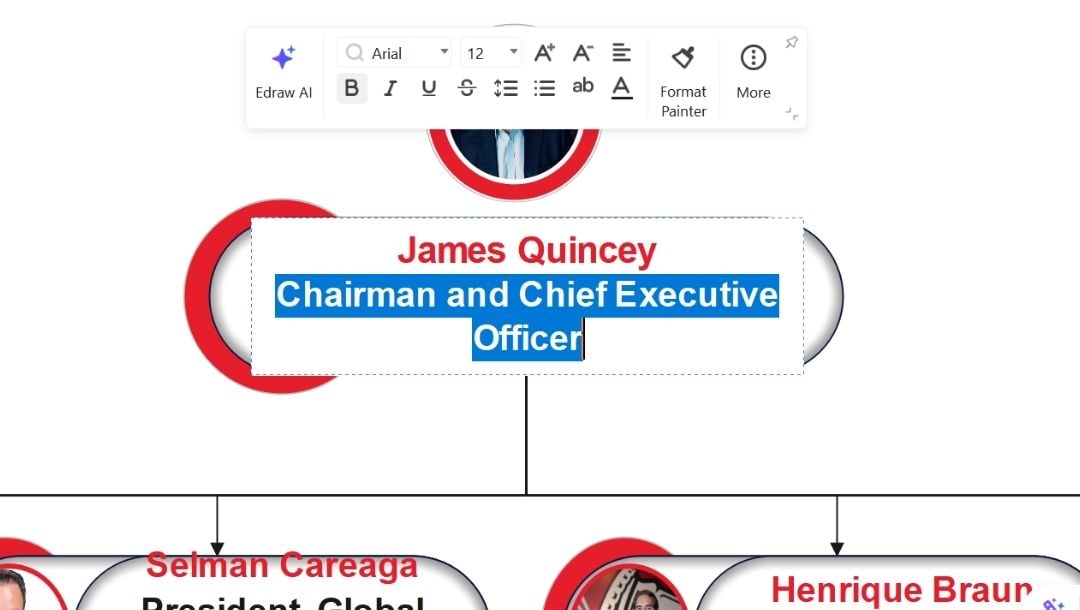
Step2Update It with Your Own Data
- To replace/edit any placeholder text, double-click the root box and add your own text.
- Enter names and exact titles (e.g., VP of Finance - Global).
- Drag the shape corners if the text overflows.
- Use the pop-up menu to modify text, font style, color, size, etc.
- Choose separate colors for names and roles for a better view.
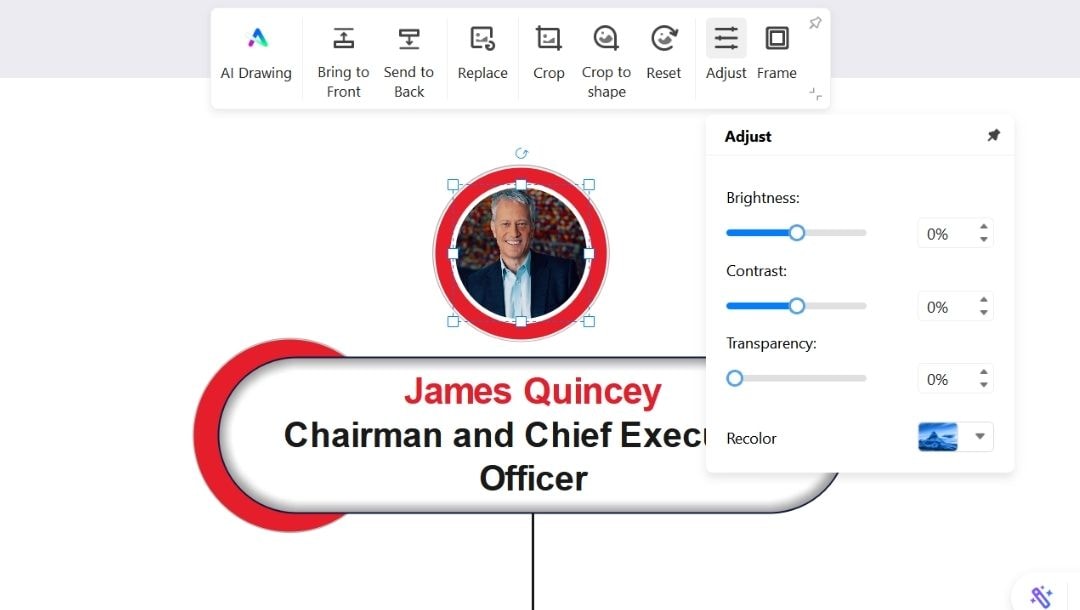
- Click any image to modify or replace it.
- Use the pop-up menu to adjust Crop, Brightness, Contrast, and Transparency.
- Repeat this for each role and position.
- The drag-and-drop feature helps you easily adjust alignments.
Step3Customize Layout and Design
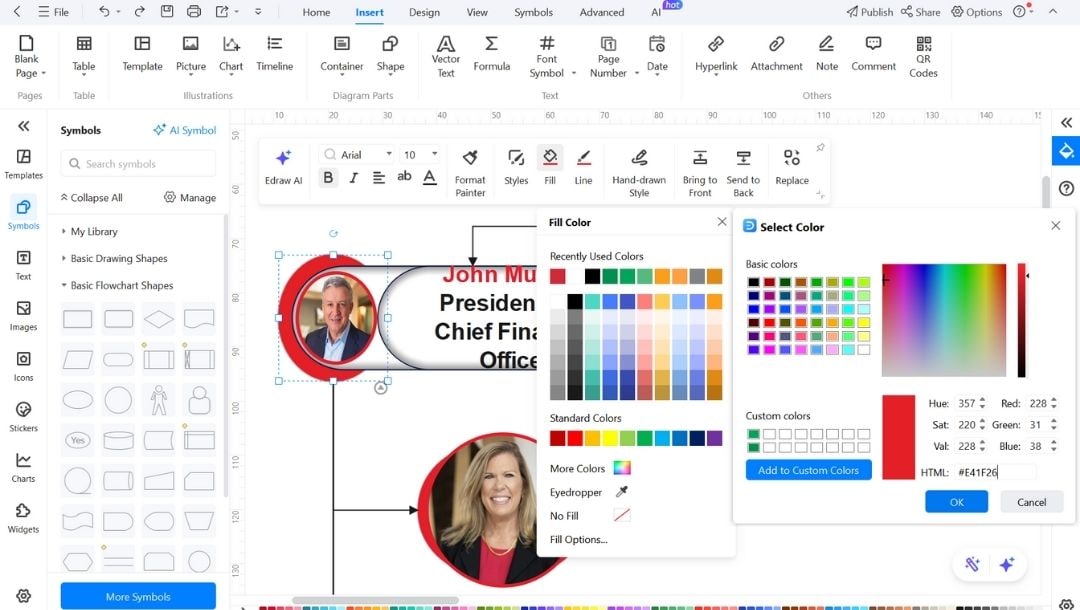
- Tap on any shape and use pop-up menu features (Style, Fill, Line) to modify or replace it with other shapes.
- Use the shape's edges to resize a shape or click and drag it to reposition it anywhere on the canvas.
- For instance, select any shape, open Fill, More Colors, and enter #E41F26 (Coca-Cola red).
- You can also try the instant style change button on the bottom right for quick theme modification.
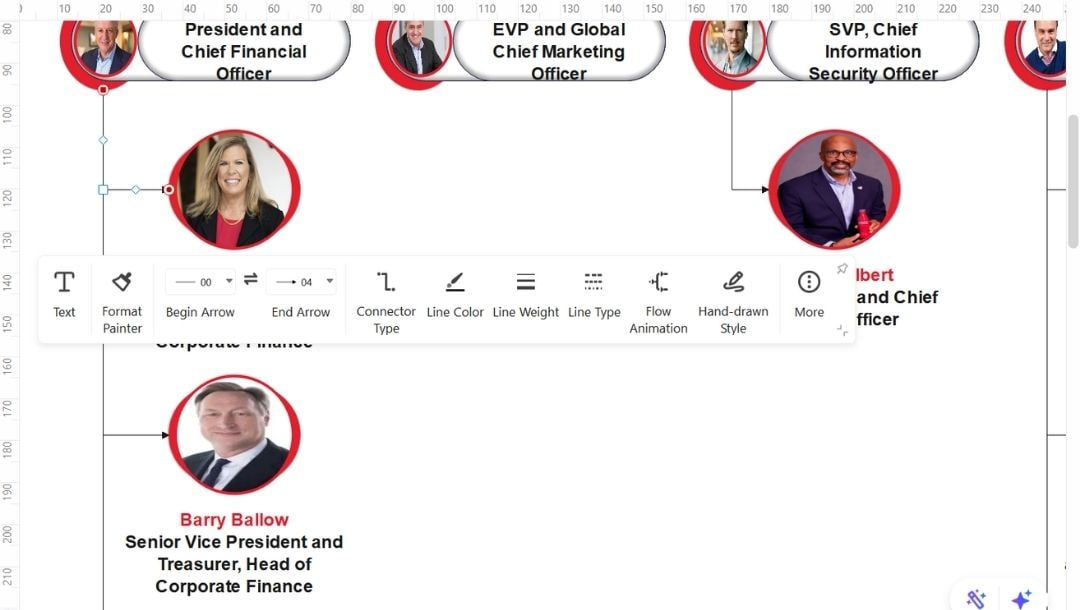
- Click a connector line and modify its end style, type, color, weight, etc., from the pop-up menu.
- i.e. Go to Line Type. For primary lines, pick solid, and for matrix lines, pick dashed.
- Explore Icons if you need to use them. Click any to add it to your canvas and resize it from corners or click and drag to reposition it where you want.
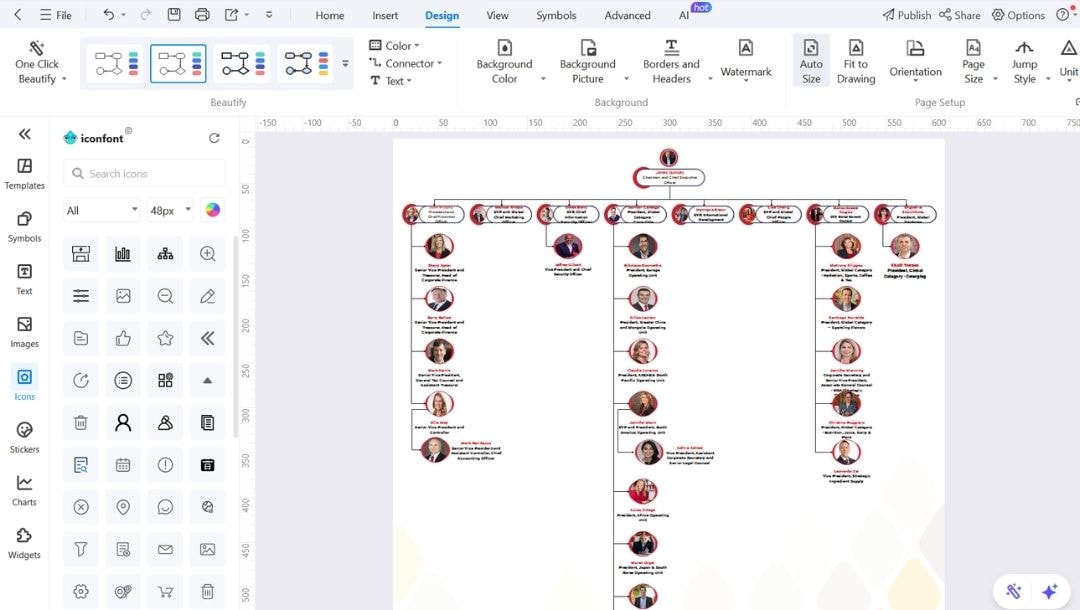
- Go to the Design tab in the upper menu to try other premade theme styles with One-Click Beautify.
- Group by Division. Drag-select a region or function block and press Ctrl + G to lock grouping to avoid messing up.
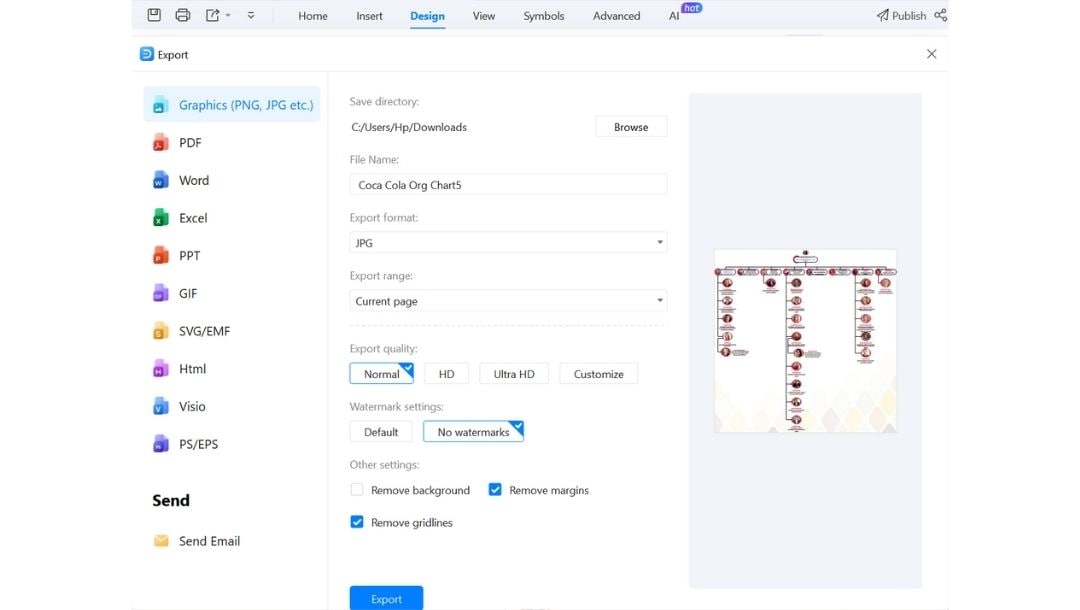
Step4Final Review and Export
- Before exporting the final file, proofread and review your data carefully. Scan every box to confirm spelling and hierarchy.
- To download your file, hit the export icon in the upper menu, choose the required format from the available options, and adjust settings.
- Once done, click the blue Export button, and you will have it.
Benefits of Visualizing Organizational Structures
- Visual maps simplify complex reporting lines into clear diagrams. Seeing boxes and connectors helps teams understand who reports to whom quickly. This clarity reduces confusion in cross-department projects and speeds up communication.
- Onboarding becomes faster with visual charts. New hires use diagrams to find supervisors, peers, and support staff. This approach cuts orientation time by letting employees explore the structure independently.
- Charts reveal resource gaps. Adding headcounts next to departments shows which teams need more staff or training. Overlays highlight heavy workloads or uneven spans of control. Leaders then adjust roles or recruit as needed.
- Live diagrams help during reorganizations. Changes like new roles or removed positions are updated instantly. This keeps everyone aligned and avoids extra meetings for project or budget updates.
- Visual org charts promote accountability. Each person knows their place and approval chain. This reduces bottlenecks and speeds decision-making. A current chart acts as a reliable reference for planning and reviews.
Pro Tips to Make an Effective Organizational Structure
- Clear reporting lines require assigning one direct manager per role. This helps employees know exactly who to contact for approvals and feedback.
- Balance the control range by limiting managers to five to eight direct reports. This keeps supervision effective and communication smooth across functions and regions.
- Align every role with a business goal. Whether it's expanding in Asia or reducing supply costs, this makes teams accountable for clear outcomes.
- Use cross-functional teams only for key strategic projects. Stick to a single reporting line for daily tasks to avoid duplication and delays.
- Standardize job titles and descriptions with a central template. This includes responsibilities, skills, and performance metrics for consistency across regions and functions.
- Embed feedback loops by holding quarterly reviews involving HR, finance, and business units. Use data on workload and bottlenecks to update the organizational chart quickly.
- Use visualization tools like EdrawMax to keep a live org chart with linked roles and headcount info. This helps track changes and simplifies onboarding and planning.
- Plan scalability by outlining extra layers ahead of growth, such as regional managers or support teams. This keeps the structure flexible for new markets and launches.
Final Thoughts
As markets shift and teams go remote, Coca-Cola's matrix structure remains smart. Its blend of functional oversight and regional autonomy supports both control and agility.
The Coca-Cola organizational chart shows how to scale globally while staying locally relevant. Whether refining your company hierarchy or exploring how top brands operate, this model is worth studying and replicating.
Plus, with platforms like EdrawMax, you can turn this structure into a real-time, adaptable chart for your team's future.
AI Diagram Generator
Enter your prompt. Upload files if needed. Generate diagrams, charts, or slides instantly.


