


The library management system handles books by issuing, returning, and renewing them. It also manages new member registration, fines, and cataloguing. Plus, it provides access to digital resources. The activity diagram shows the workflow. The state diagram illustrates the object lifecycle.
However, the UML deployment diagram focuses on the physical infrastructure. It answers questions such as:
- Where does the library database live?
- Which servers handle authentication?
- How are client PCs, kiosks, and mobile apps connected?
This is a useful tool for architects and IT people. Just another step to verify the infrastructure deployment when scaling out and troubleshooting.
This article covers deployment diagrams for library management systems. This will cover what a deployment diagram is. It will show how to make one using EdrawMax. Also, it will give three examples with explanations.
In this article
- What is a Deployment Diagram for a Library Management System?
- Main Components of a Library Deployment Diagram
- 3 Examples of Deployment Diagram for Library Management System
- How to Create a Deployment Diagram for a Library Management System
- Best Practices for Designing Deployment Diagrams
- Ending Notes
What is a Deployment Diagram for a Library Management System?
A UML deployment diagram shows where and which artifacts are located on nodes. It shows where software operates and is hosted in the physical setup.
For managing a library system, we need a deployment diagram that shows:
- Workstations: This covers staff computers, self-check kiosks, and student devices that connect to the system.
- Application Servers: Machines with the library-management application software installed on them.
- Database Servers: Store catalog, member, and transaction data.
- Outside of the E-Library: A set of library web services or from a credit card handler, e-book provider, or from a university's identity provider.
It provides an answer to “where” and “how” software inhabits a physical network.
Main Components of a Library Deployment Diagram
There are several UML notations for deployment diagrams. Each part explains how a piece of software fits into the library’s IT infrastructure.
Nodes
- Nodes can correspond to hardware or an execution environment.
- Examples: A library’s database server, web server, or self-check kiosk.
- Nodes could also be cloud services (AWS RDS for database hosting).
Artifacts
- An artifact represents software items such as files, apps, or executables. These will be installed on the nodes.
- Demonstration: Library Management Application (Library Management Software. Jar) placed in the application server.
Associations (Communication Paths)
- Lines that connect nodes represent network communication among devices.
- For example, A client PC transmits to the application server using HTTPS.
- DBC is used to communicate between the application server and the database server.
Deployment Specifications
- More details and settings on how nodes, or artifacts, are programmed.
- Example: An app server is running Tomcat 9 on Linux.
- The specs assist the admins in duplicating or debugging the environment.
3 Examples of Deployment Diagram for Library Management System
Deployment Diagram for Library System Functions
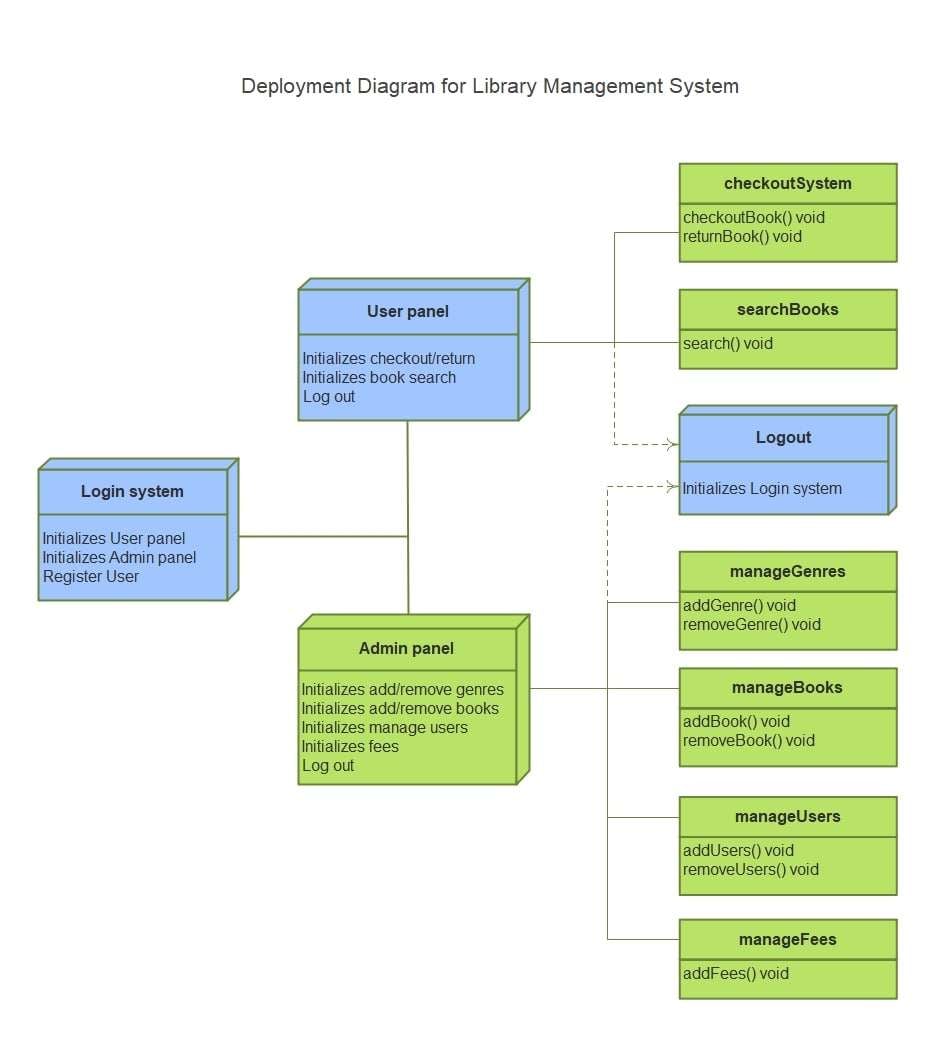
Here’s the presentation of the library management system's functional elements. All components are assigned. It demonstrates how the users and administrators interact through dedicated panels. The intuitive login is ready for both users and admins. This feature lets you offer services safely and easily. The User Panel lets you check out, return, or search for books. The logout functionality takes care of the invalidation of the session. Operations to be performed on the books or users can be in a one-to-one relation with a module. This diagram shows how responsibilities are clearly defined. This helps both library staff and users.
Deployment Diagram for Library System Level
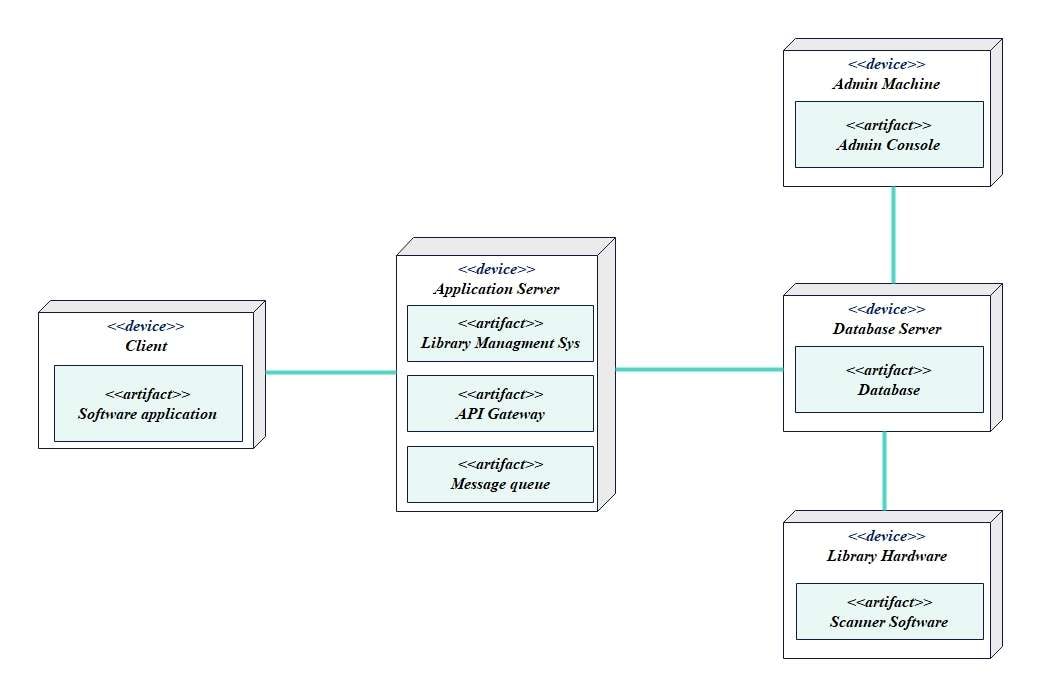
The diagram shows how the library system is deployed on various devices and servers. Users access the library software through applications that connect to an application server. This server includes the management system, API gateway, and message queue. The database server stores important information. The admin machine controls everything from the console. Furthermore, scanning and other library hardware communicate with the system in real time.
Decoupling emphasizes scalability, reliability, and effective user, administrator, and backend system communication. This provision ensures that all site features, whether administrative or not, work properly. It promises high system availability and uninterrupted service.
Deployment Diagram for Library Enterprise Scale
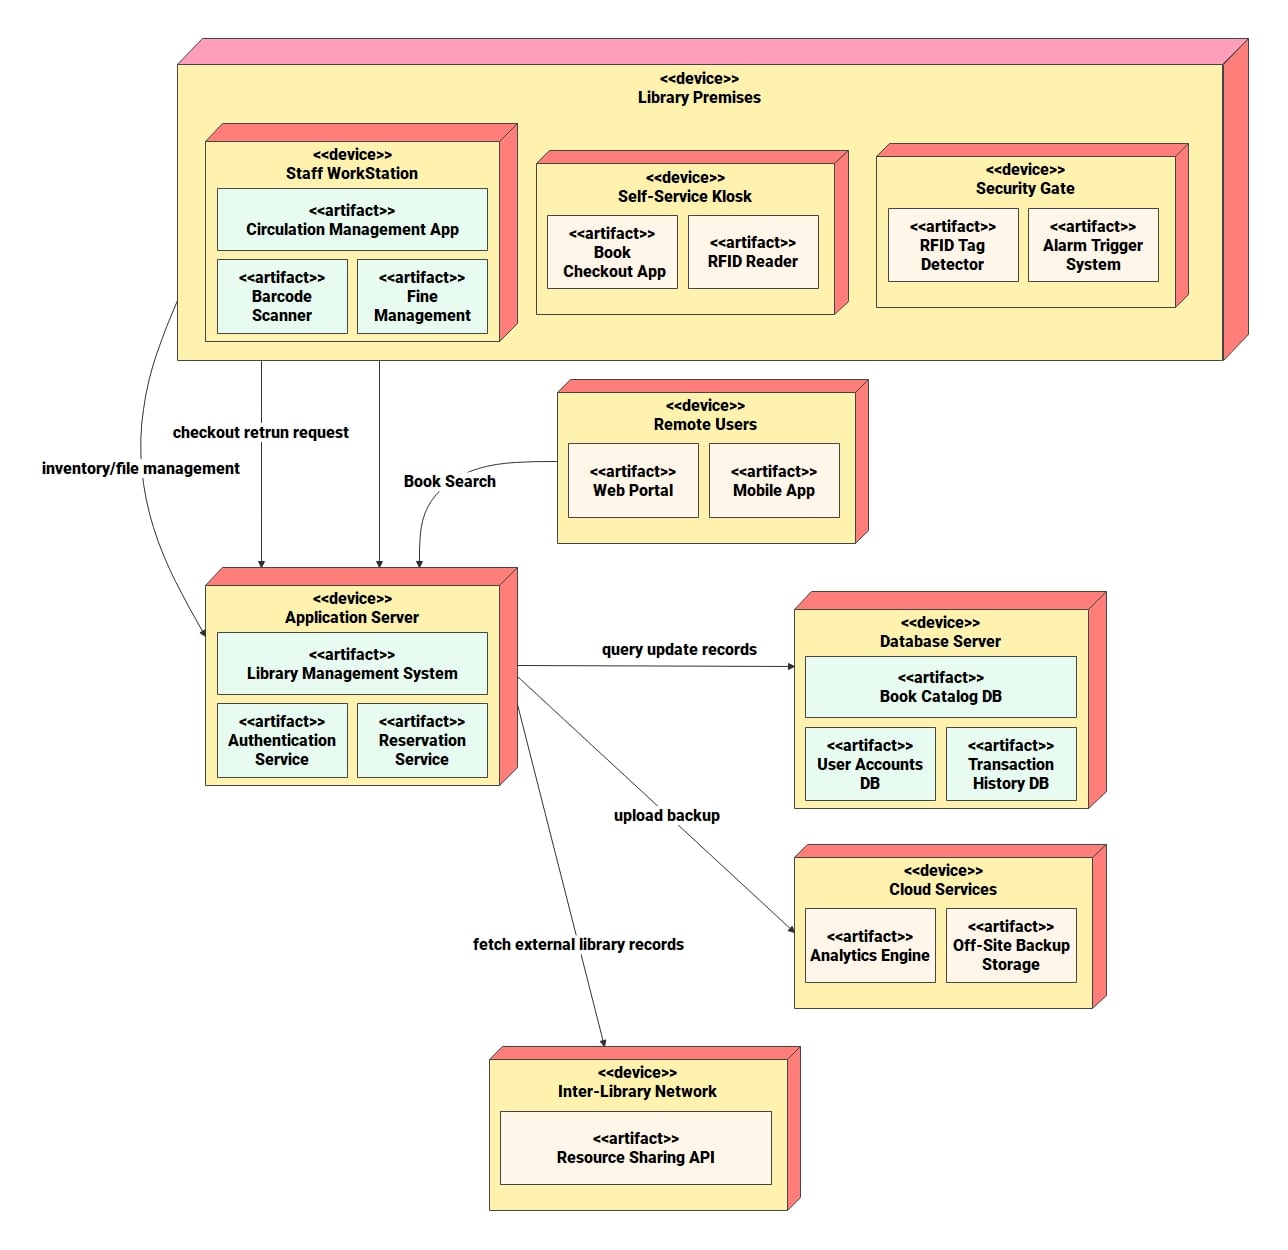
This deployment diagram gives an overview of a modern library setup. It has a staff desk, a self-service kiosk, and security gates. These connect to a back-end application server. The server stores core services like authentication and reservations. Remote users access the service via a web portal or mobile app.
The database server handles book collections, user accounts, and transactions. Analyze all drive data offline using cloud services. This ensures full data protection and integrity. Libraries already have a network to share resources beyond their own. This diagram shows how the library fits into on-premises infrastructure, cloud services, and external networks. It creates a reliable, secure, and scalable management system.
How to Create a Deployment Diagram for a Library Management System
You can easily create a deployment diagram for your library system with EdrawMax. It has drag-and-drop symbols and many export options.
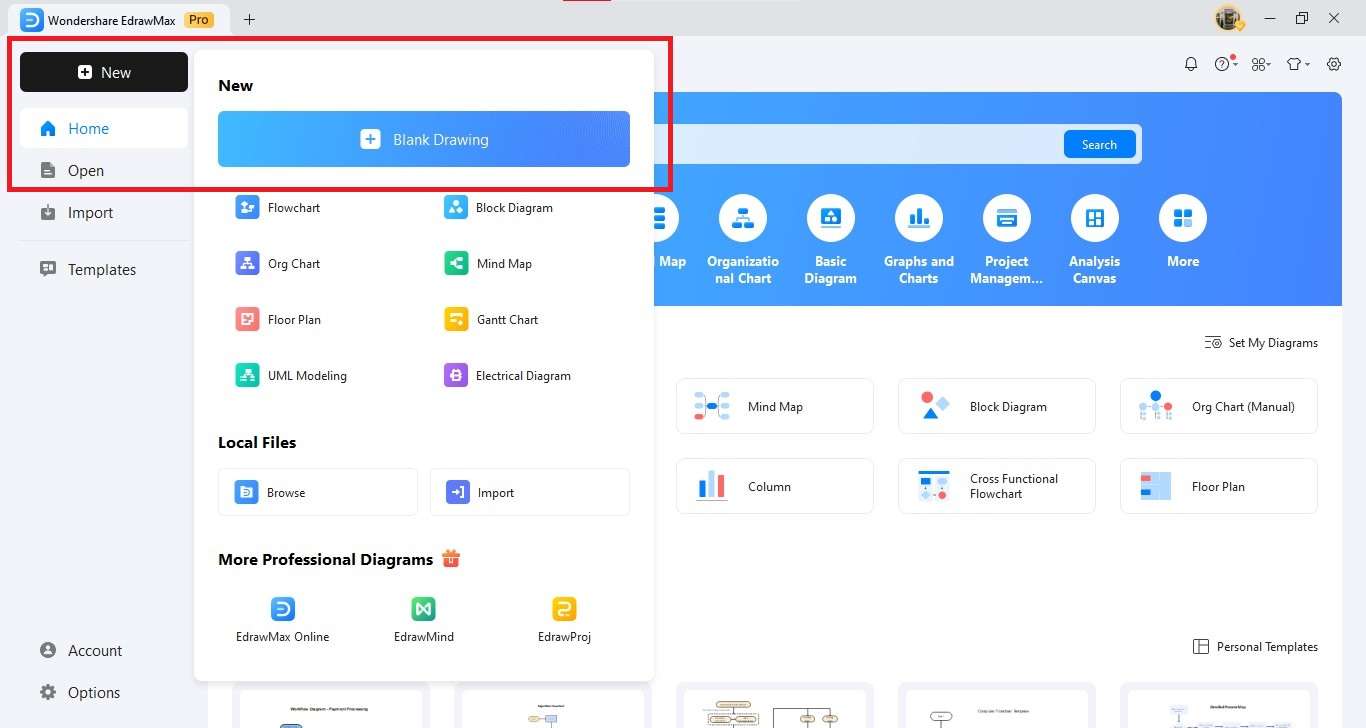
Step1 Create a New Canvas
- Open EdrawMax on your computer.
- Begin by selecting New → Blank Drawing from the left panel.
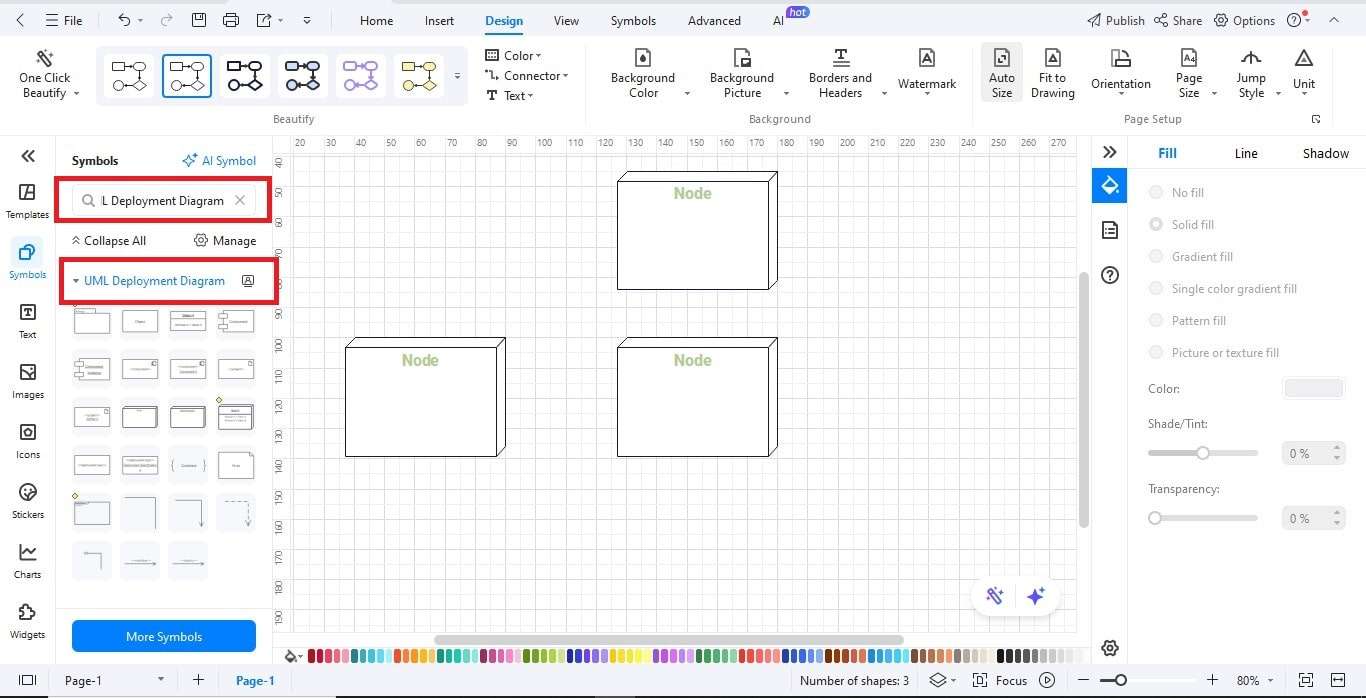
Step2 Insert Nodes
- Click the UML Deployment Diagram set from the symbol library.
- Draw Node shapes onto the design surface to depict hardware devices.
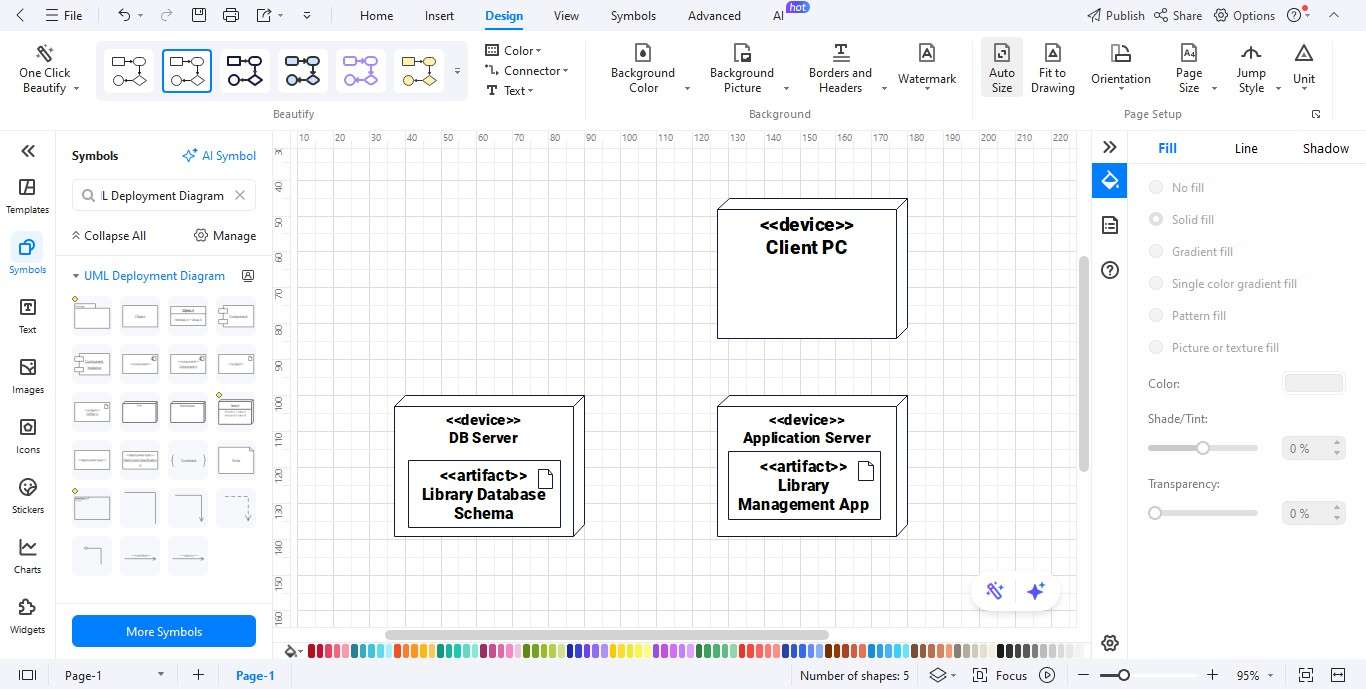
Step3 Add Artifacts
- Drag Artifact symbols down into the nodes.
- Example: Under the Application Server node, position Library Management App.
- The Library Database Schema should be in the DB Server node.
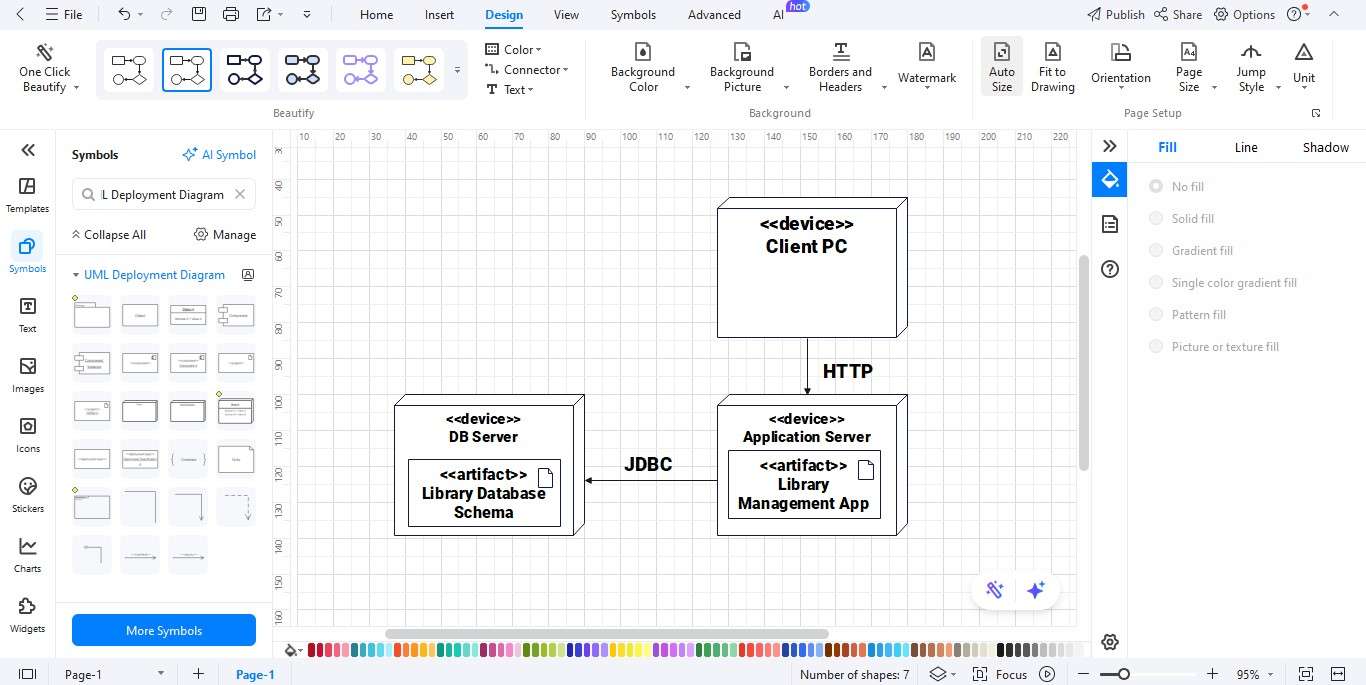
Step4 Connect Nodes with Paths of Communication
- Use lines for communication sections.
- Annotate the paths with information such as HTTPS, JDBC, or REST API.
- Example: Client PC → Application Server (HTTPS).
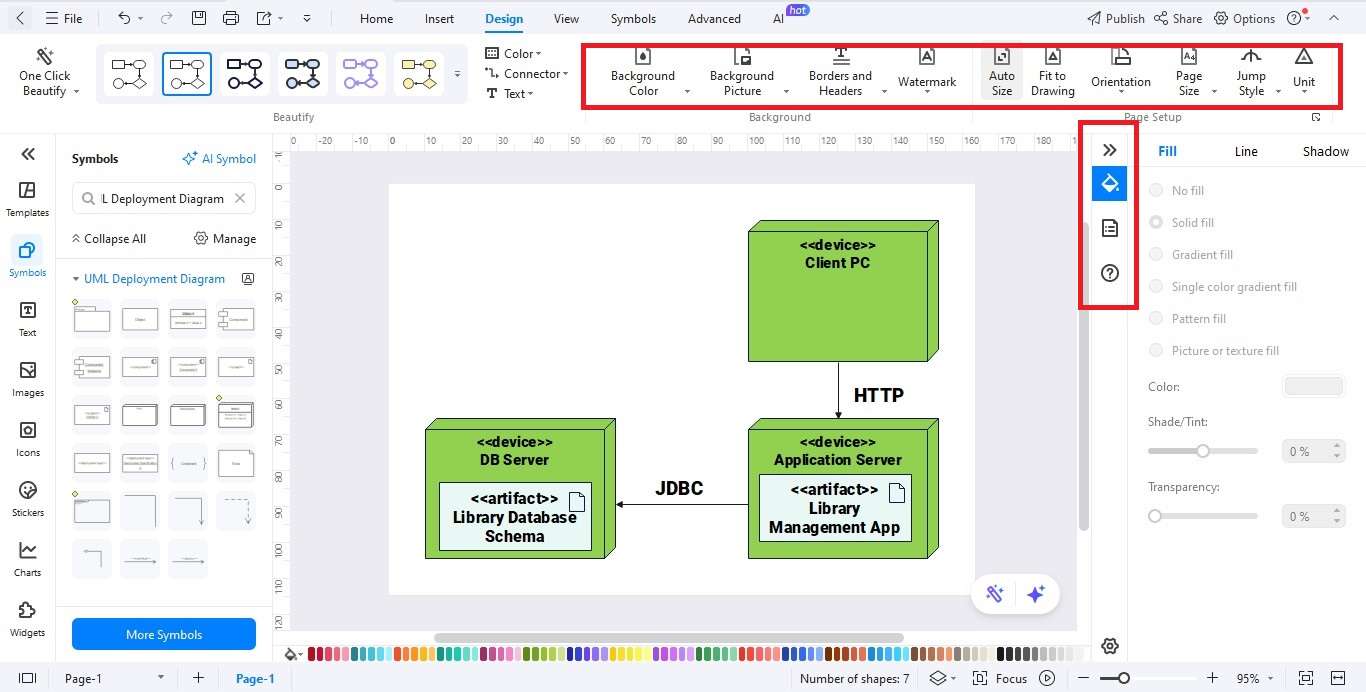
Step5 Personalize Your Diagram
- Adjust the colors, fonts, and line styles using the Format toolbar.
- Use the alignment and spacing tools to make the diagram as easy to read as possible.
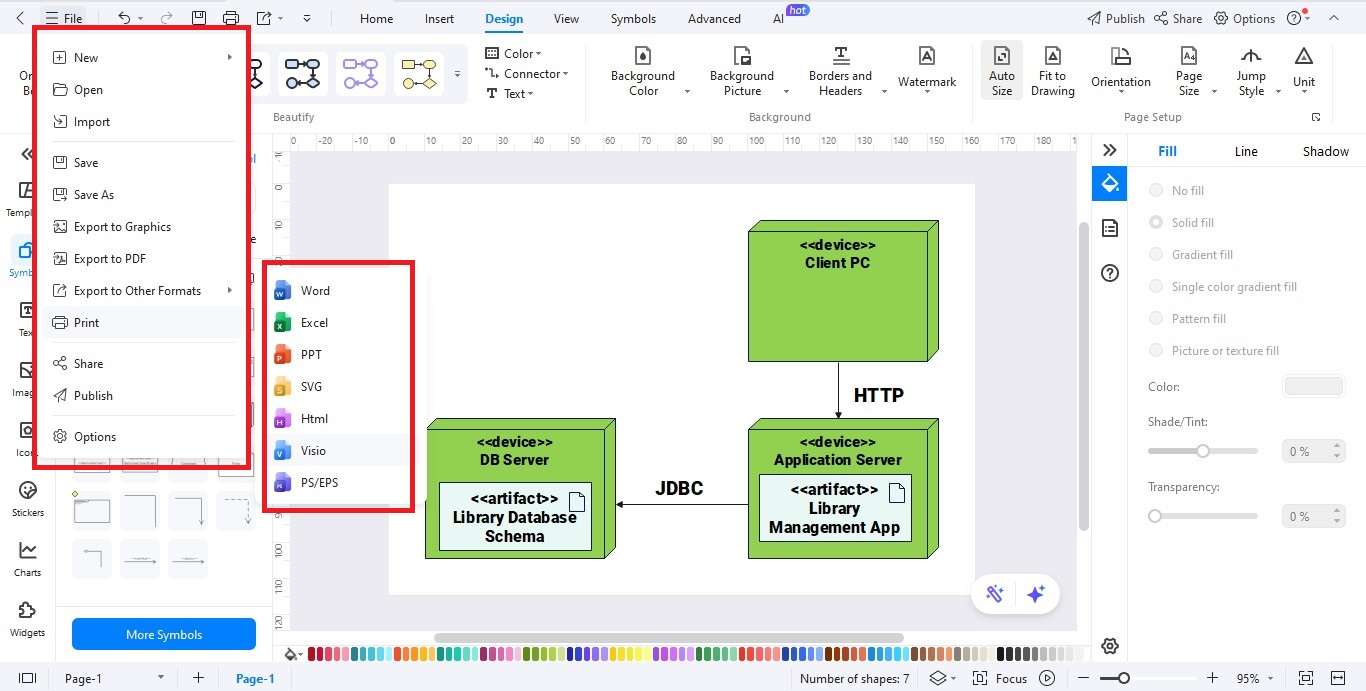
Step6 Export Your Diagram
- Click the Export button.
- Choose the appropriate file format: PNG, JPG, PDF, Word, Visio, or SVG.
- Save the file and distribute it to the stakeholders.
Best Practices for Designing Deployment Diagrams
Here are some best practices for using deployment diagrams:
- Simplify it: Include only key nodes and artifacts. Avoid overloading details.
- Use Consistent Names: Clearly name servers, databases, and services.
- Mark the Communication: Indicate paths as HTTPS, JDBC, REST, and other communication protocols.
- Show Specs: Include operating system, versions, and settings.
- Clearly Distinguish Third-Party Systems: Differentiate external services by using colors or labels.
- Confirm with IT Workers: Verify diagrams with technicians to reflect reality.
A deployment diagram works as both a blueprint and a handbook for operation and design.
Ending Notes
A library management system deployment diagram shows how the system’s data is organized on hardware. It details how the applications, databases, and client machines are provisioned and interconnected. Modeling the nodes and artifacts helps architects, developers, and operators understand how the system acts in real-world situations.
Deployment diagrams are key for all types of libraries. They vary from small local libraries to university libraries. Some use client-server setups, while others rely on cloud solutions. Creating them with EdrawMax is easier. You can use drag-and-drop nodes, customize artifacts, and access formatting tools.
A deployment diagram, along with best practices, is more than just documentation. It’s a strategic tool that helps ensure smooth operations and future scalability. Put simply, deployment diagrams are not just technical diagrams. They help librarians, developers work together with IT.
AI Diagram Generator
Enter your prompt. Upload files if needed. Generate diagrams, charts, or slides instantly.


