


ATM monitoring is the heart of today’s banking system. It includes cash withdrawals, deposits, balance inquiries, fund transfers, and transaction recording.
To fully understand how the system functions, it's important to look at different types of UML diagrams: activity diagrams show workflows, state diagrams illustrate system lifecycles, and deployment diagrams reveal the physical architecture. For instance:
- Where is the ATM database located?
- What servers manage card authentication?
- How do ATMs communicate securely with the bank’s data center?
You’ll learn about its core components, how to build one, and see three examples to guide your design.
In this article
What is a Deployment Diagram for an ATM Management System?
A deployment diagram in the Unified Modeling Language shows how artifacts are placed on nodes. Deployment diagrams show how nodes relate to the artifacts they host. They also capture the paths of communication between these nodes.
In the context of an ATM management system, deployment diagrams help show:
- ATM Terminals: These machines are mainly located at banks, shopping centers, and gas stations.
- Application Servers: These servers are located in the bank's data center. They ensure PIN verification, balance inquiries, and transaction authorization happen correctly.
- Database Servers: These servers manage customer data, like account balances and transaction history.
- Third Party Systems: This group includes interbank networks like Visa and MasterCard. It also covers payment gateways, fraud detection tools, and authentication servers.
The point of a deployment diagram is that it’s a bird's-eye view of infrastructure. It has become a troubleshooting and scaling guide for IT administrators. For developers, it means you can ensure your software gets deployed the way your infrastructure is running.
Main Components of an ATM Deployment Diagram
A deployment diagram for the ATM system follows a standard model. Let’s break it down.
Nodes
- Represent physical hardware or the environments in which they are executed.
- Examples: ATM, application server, database server, interbank network gateway.
- Nodes can be either physical, like an ATM terminal, or virtual, like a cloud-based fraud detection system.
Artifacts
- Represent software entities installed on nodes.
- For instance: Banking Database Schema on a Database Server.
- Artifacts can also include APIs, JARs, web services, or executables.
Communication Paths
- Illustrate the interconnections between nodes.
- For example, the ATM connects to the App Server over a VPN (which is encrypted).
- In banking, these paths are crucial as they typically represent secure, encrypted, and firewalled channels.
Deployment Specifications
- Provide more details on configurations and versions.
- For example:
- ATM: Running Windows Embedded OS with ATM Client Software version 2.5.
- App Server: Powered by Linux, Tomcat 9, and Core Banking App version 5.2.
- By including these specifications, the diagram becomes a living reference document for IT teams.
Examples of Deployment Diagram for ATM Management System
Deployment Diagram for ATM Security
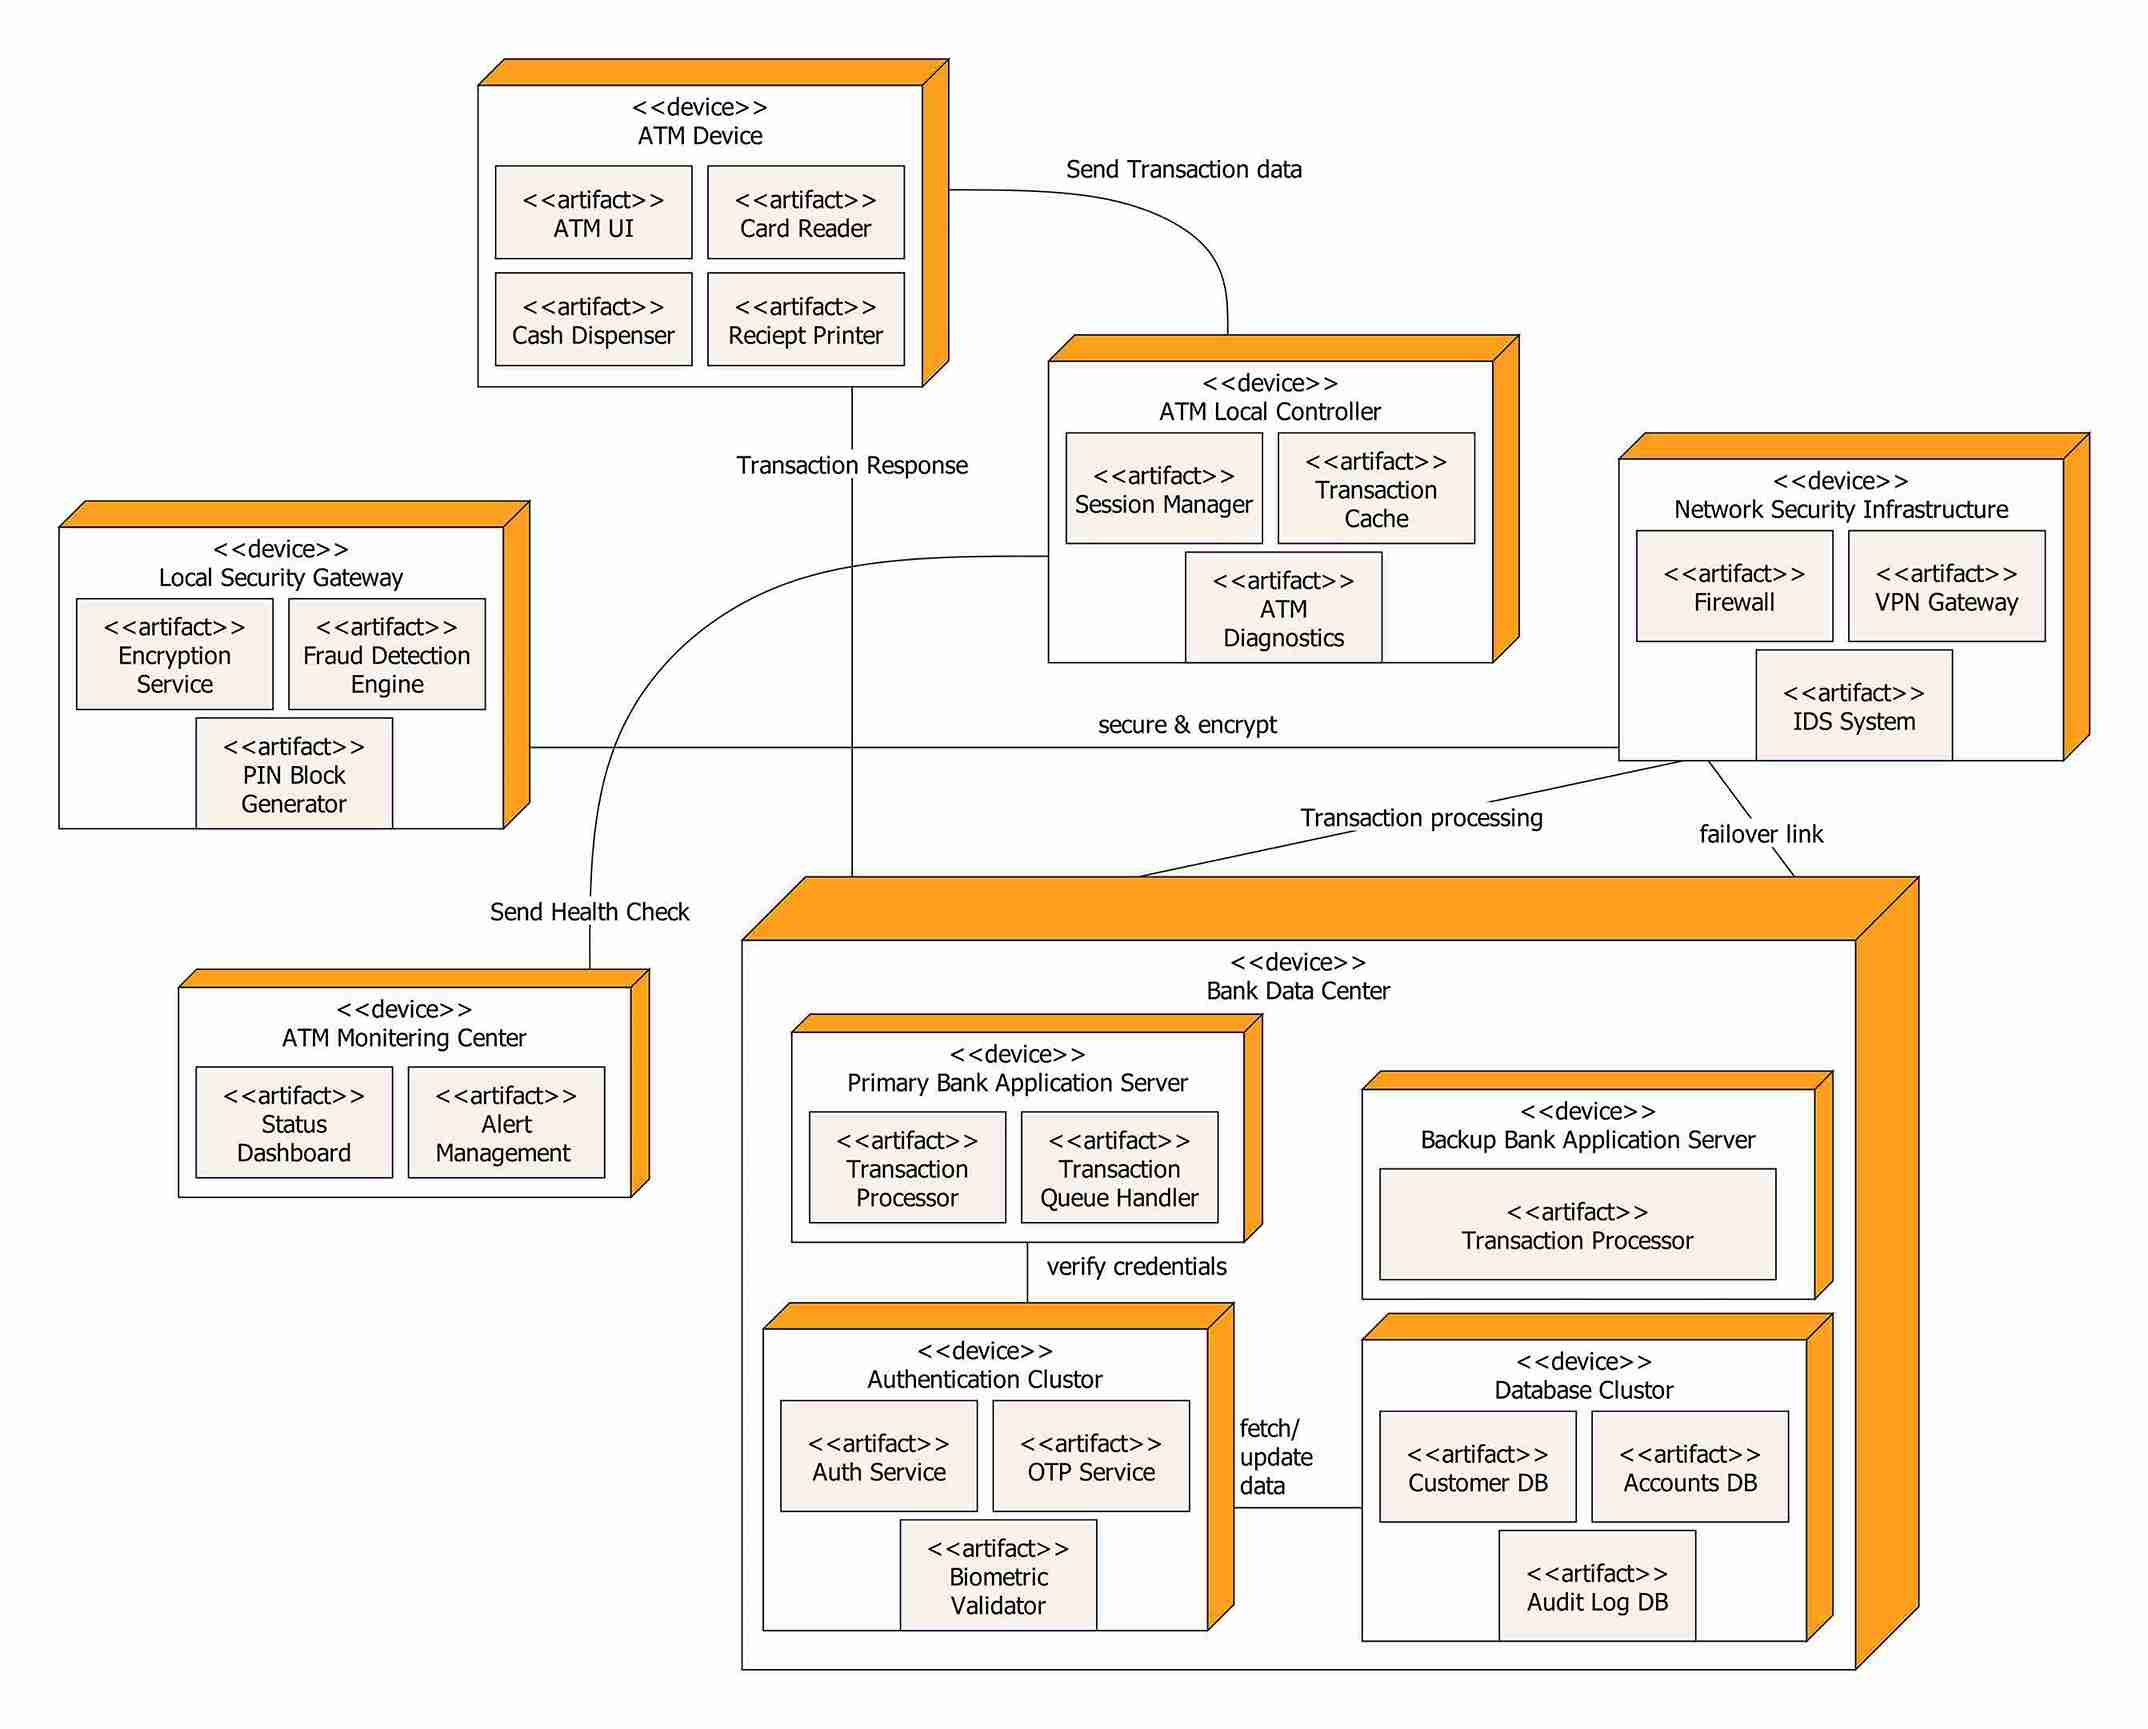
This deployment diagram depicts a highly secure and processing-rich ATM system. The ATM shares transaction details with the ATM Local Controller. It uses the card reader, cash dispenser, and receipt printer inside the machine.
Most encryption, like PIN Block Generation, happens on the Local Security Gateway. This keeps data transfer secure. An IP Network Security Infrastructure includes firewalls, VPN gateways, and IDS systems. These elements offer extra protection. T
he Bank's Data Center has primary and backup application servers. It includes primary and secondary authentication clusters and database clusters. This center validates transactions, authenticates customers, and updates accounts. This architecture is used for reliability, security, and scalability.
Deployment Diagram for ATM Cloud-Integration
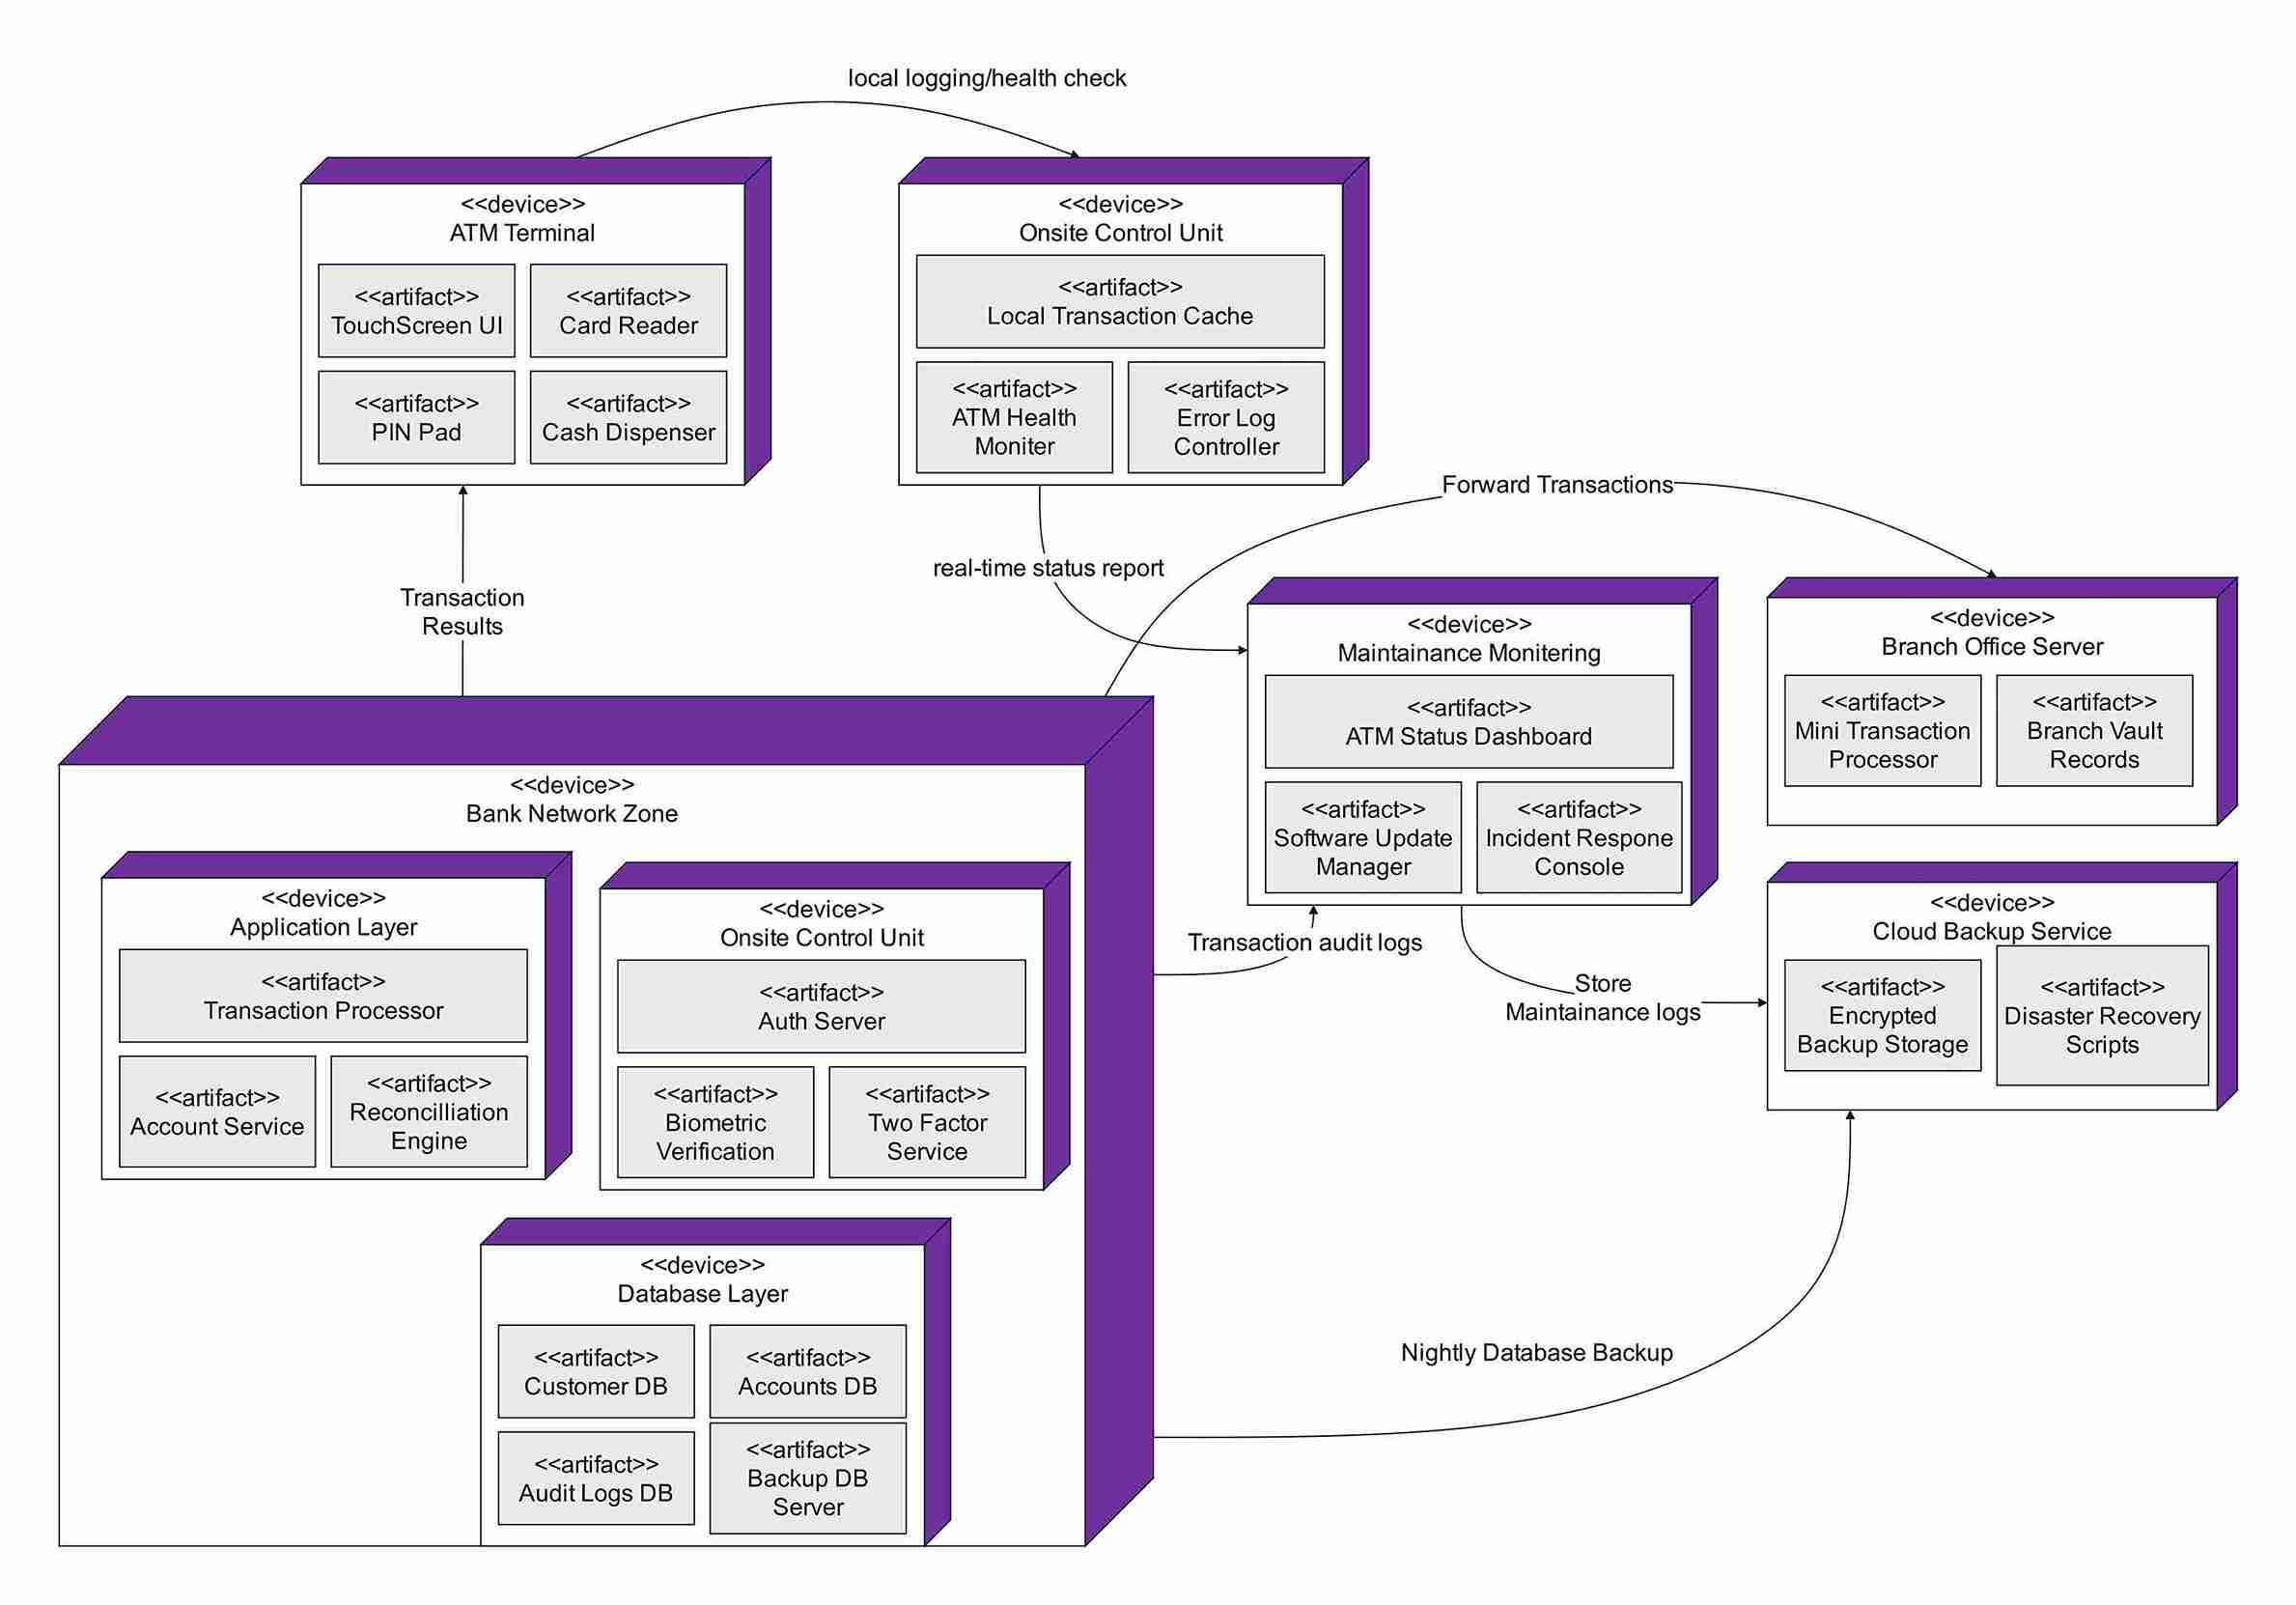
This diagram shows a deployment scenario. Here, ATMs are closely monitored. They connect to both local branch systems and cloud backup services. The ATM terminal connects to an Onsite Control Unit. This unit stores local transactions and generates health logs. This leads to the Bank Network Zone.
Here, application layer transactions happen. The data layer of OLTP (online transaction processing) is located here, too. It also has multiple backup servers to protect transaction information. Vault records are handled by branch office servers. Encrypted backups are stored in cloud services. Disaster recovery scripts are also ready. This architecture is focused on resilience and business as usual.
Deployment Diagram for Simple ATM
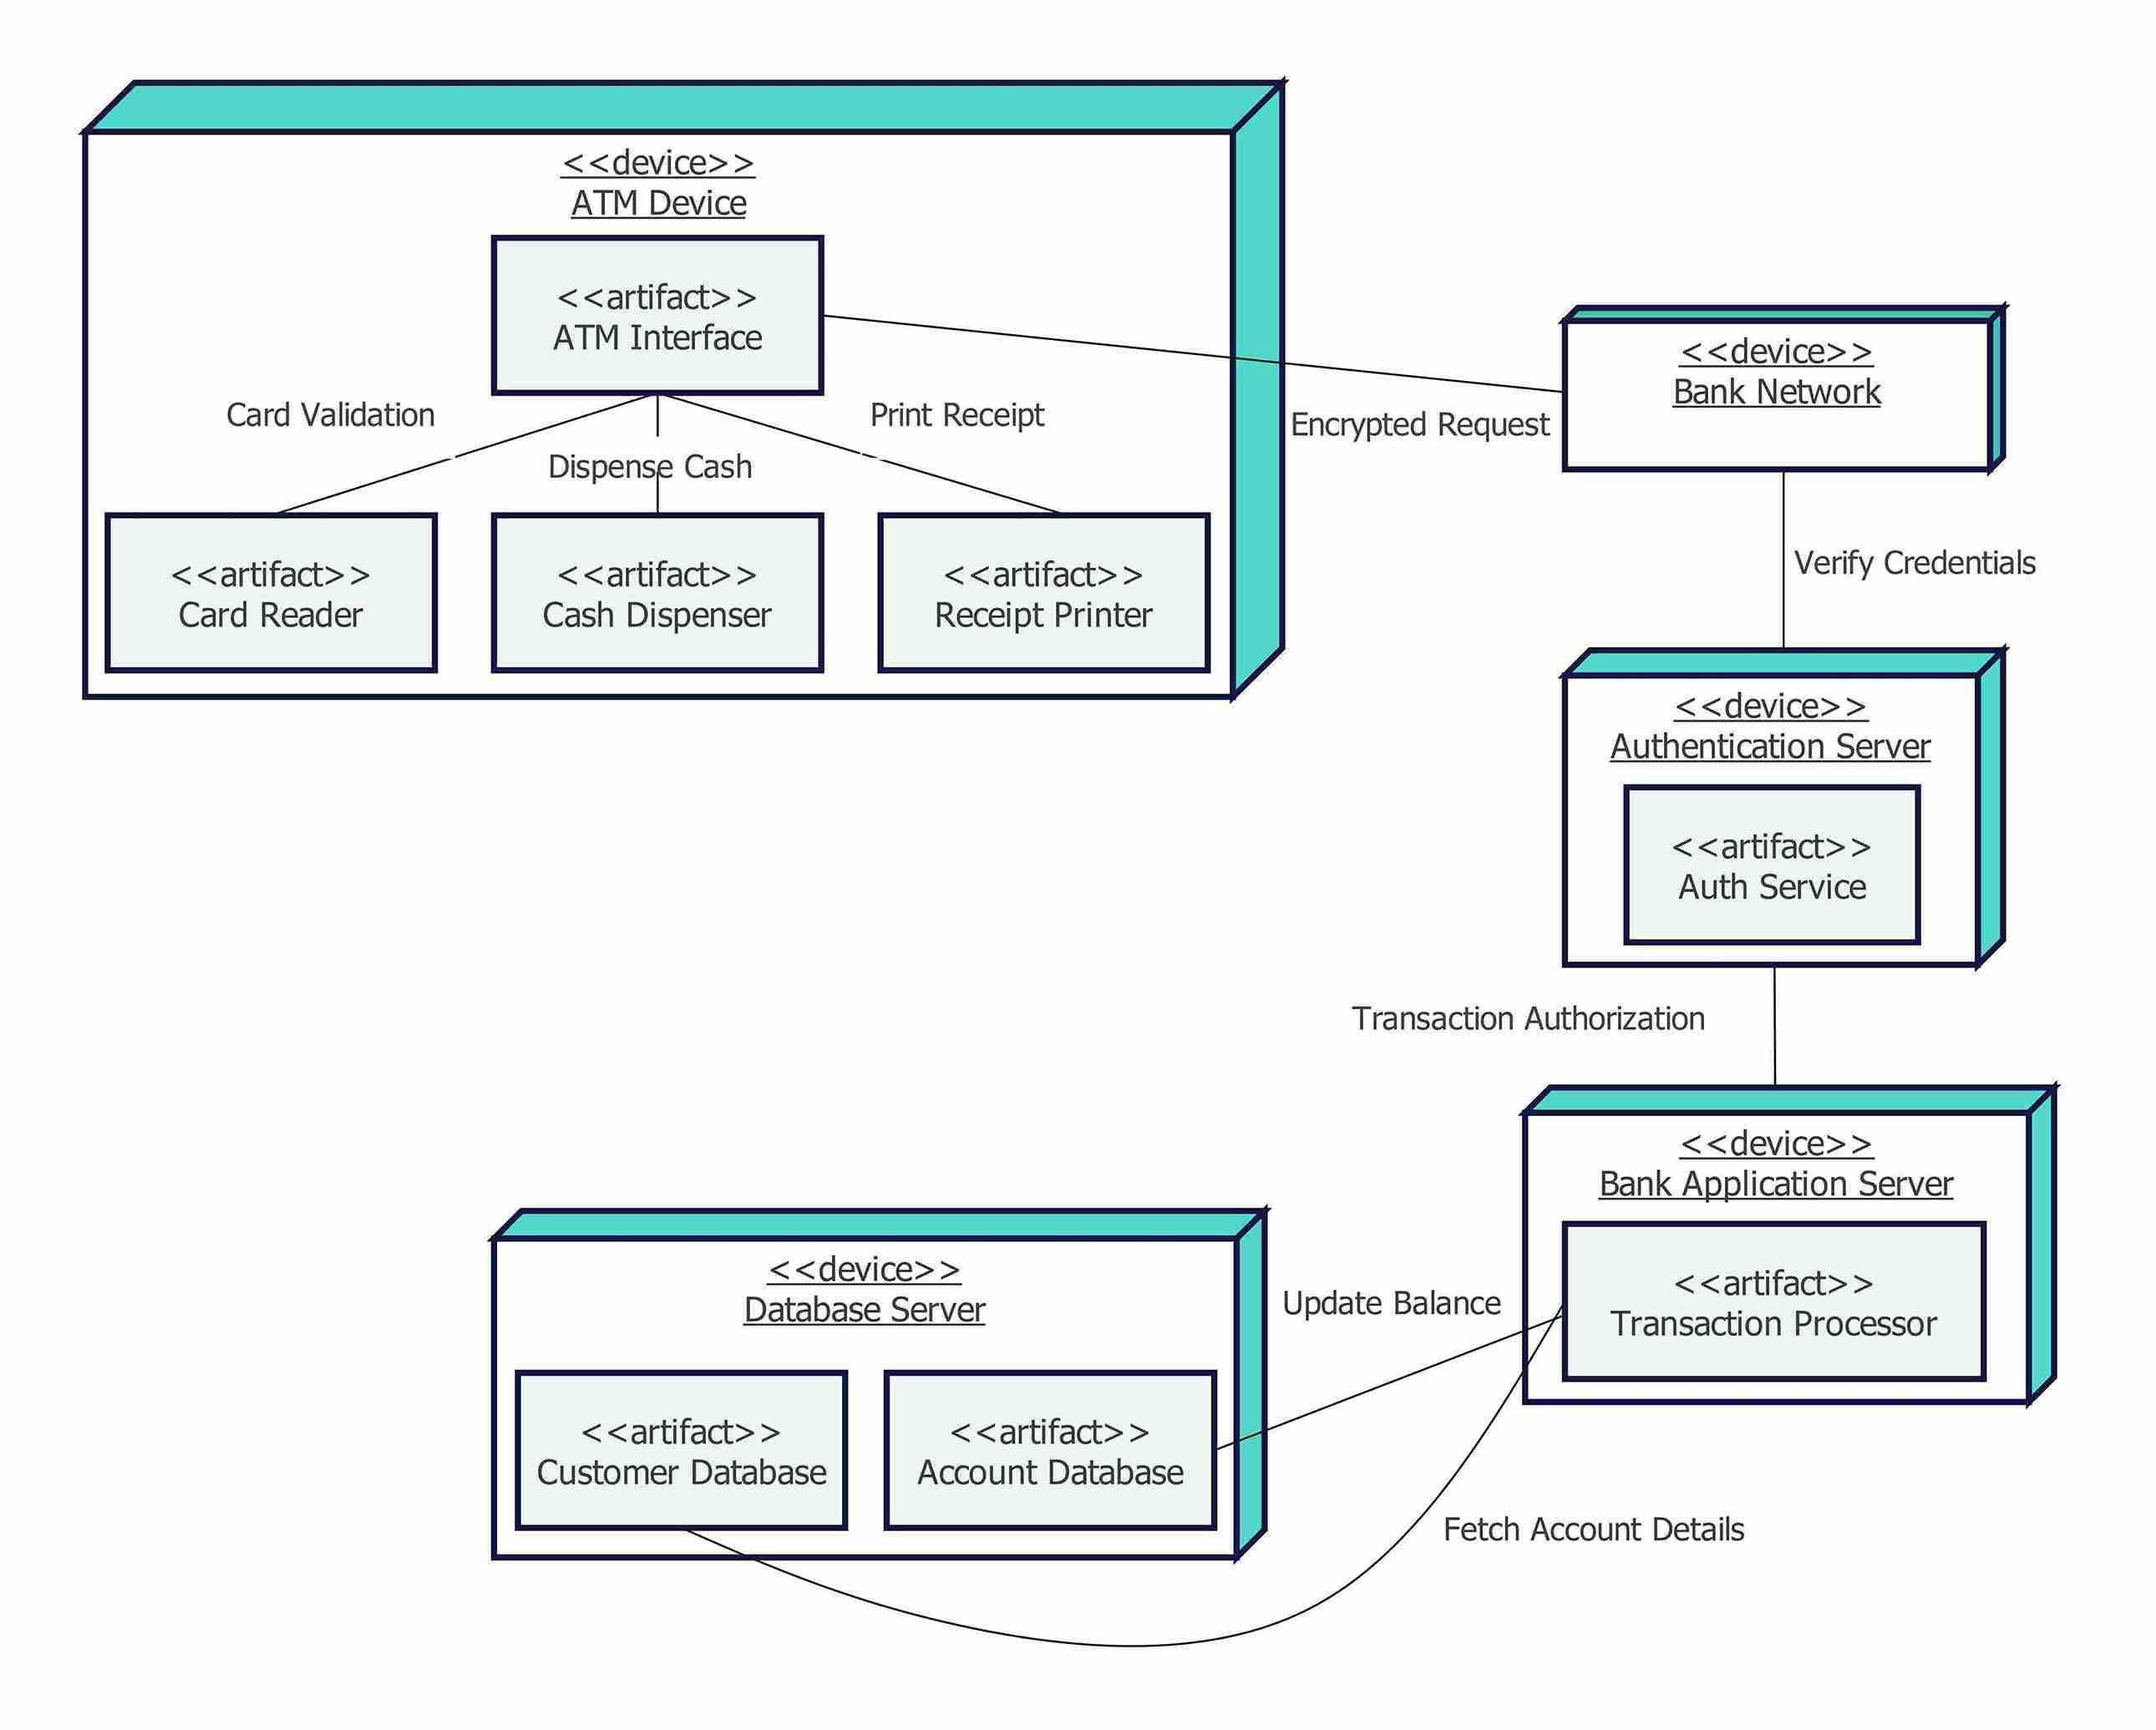
The deployment diagram illustrates a simplified ATM network. The ATM has several parts: the card reader, cash dispenser, receipt printer, and interface. It sends an encrypted request to the bank network. Authentication is performed by an authentication server that runs an authorization service.
The bank application server processes the transaction. It then interacts with a database server. The database server holds customer and account databases. It updates balances and fetches account details. This architecture emphasizes minimalism. It shows the basic link between the ATM and the bank system. It also includes key components like authentication, transaction processing, and the database manager.
How to Create a Deployment Diagram for an ATM Management System
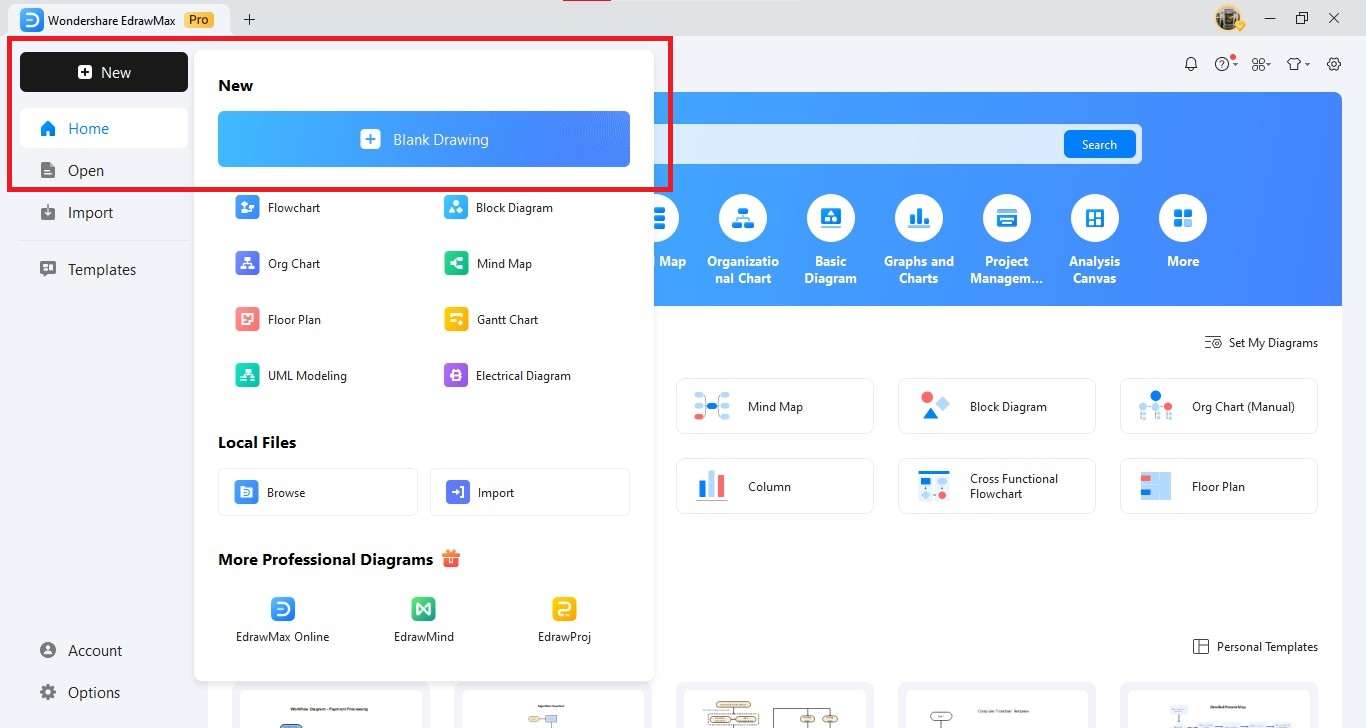
Step1 Create a New Canvas
- Open the EdrawMax application on your desktop.
- Begin with a blank drawing. Navigate to New → Blank Drawing from the left menu.
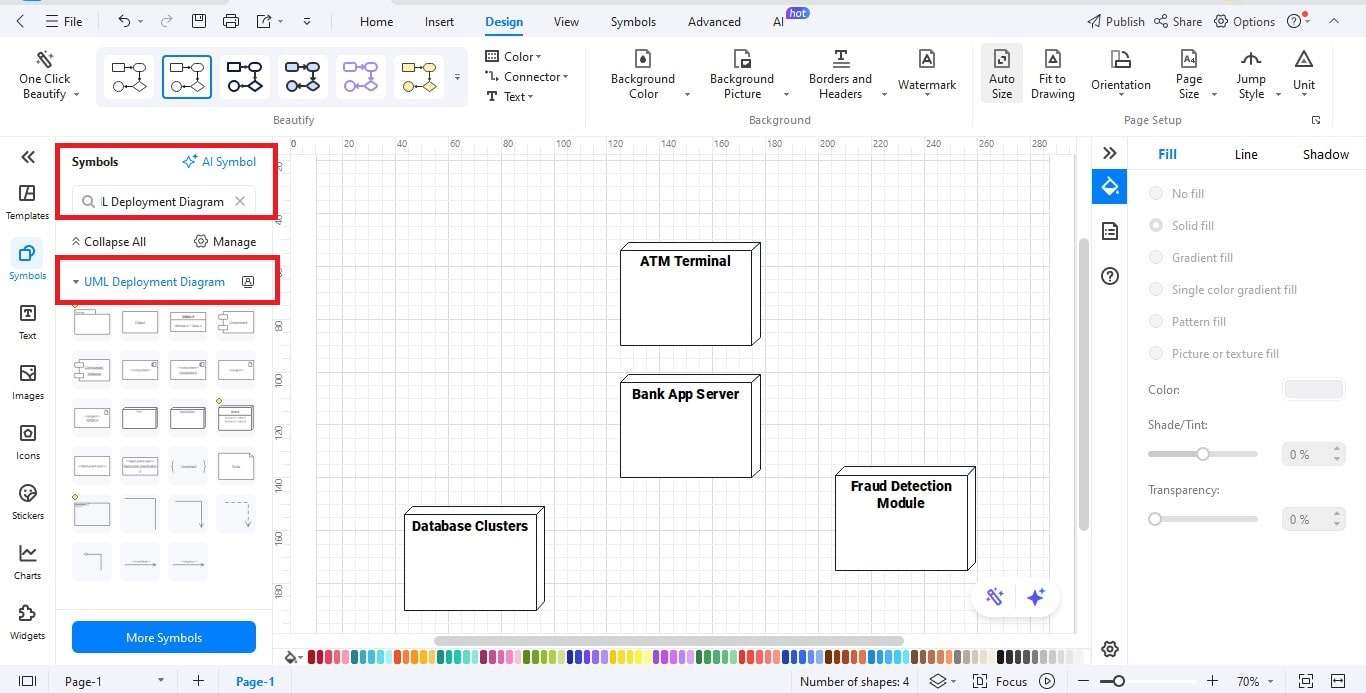
Step2 Insert Nodes
- Navigate to the UML Deployment Diagram symbols.
- Drag and drop Node shapes into your diagram.
- Create nodes for the ATM Terminal, Banking App Server, Database Cluster, and Fraud Detection Module.
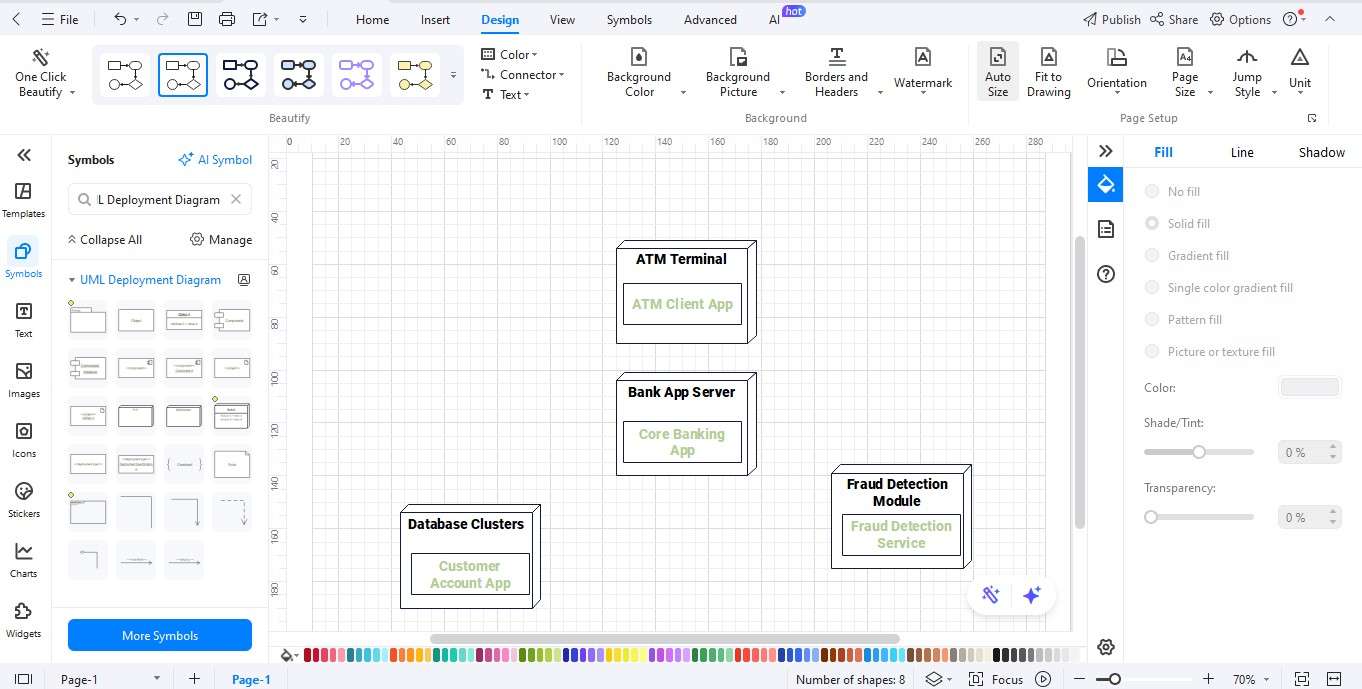
Step3 Add Artifacts
- Place artifacts in nodes to display deployed software on the node.
- Example: ATM node → ATM Client App.
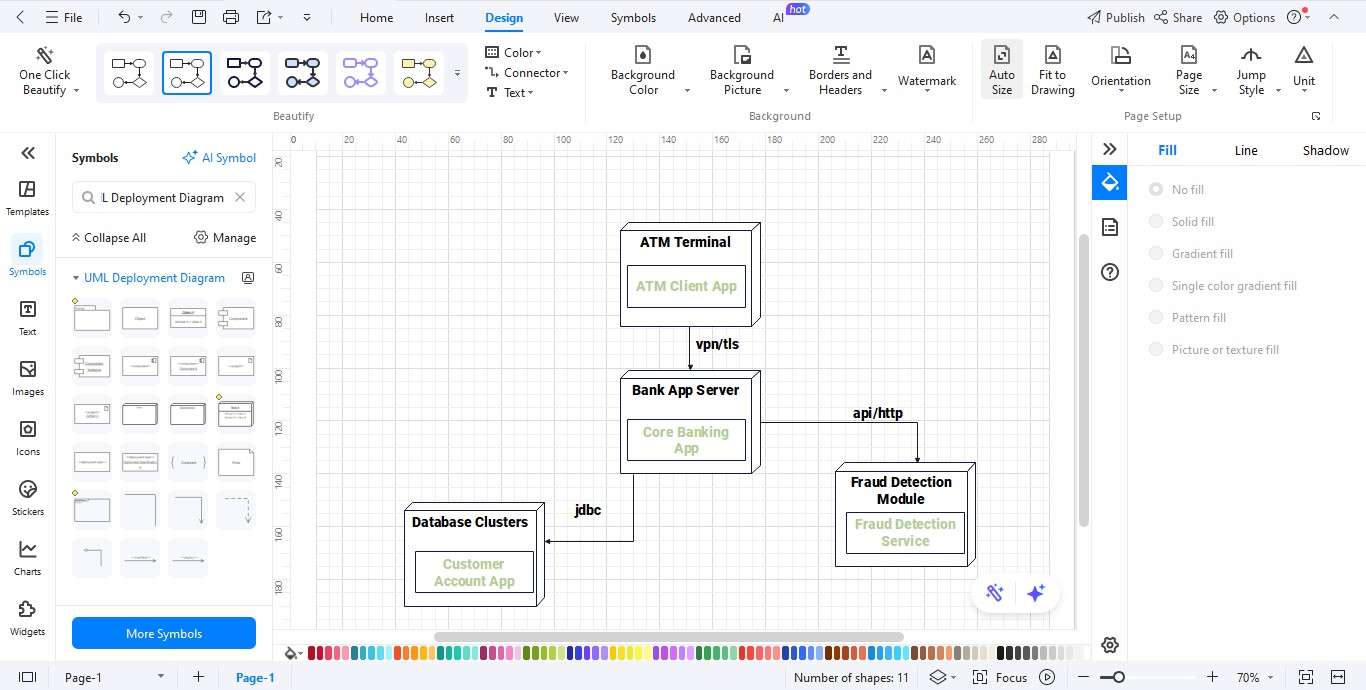
Step4 Interconnect Nodes with Communication Paths
- Use connectors to show communication between the nodes.
- Example: ATM → App Server (VPN, TLS 1.3).
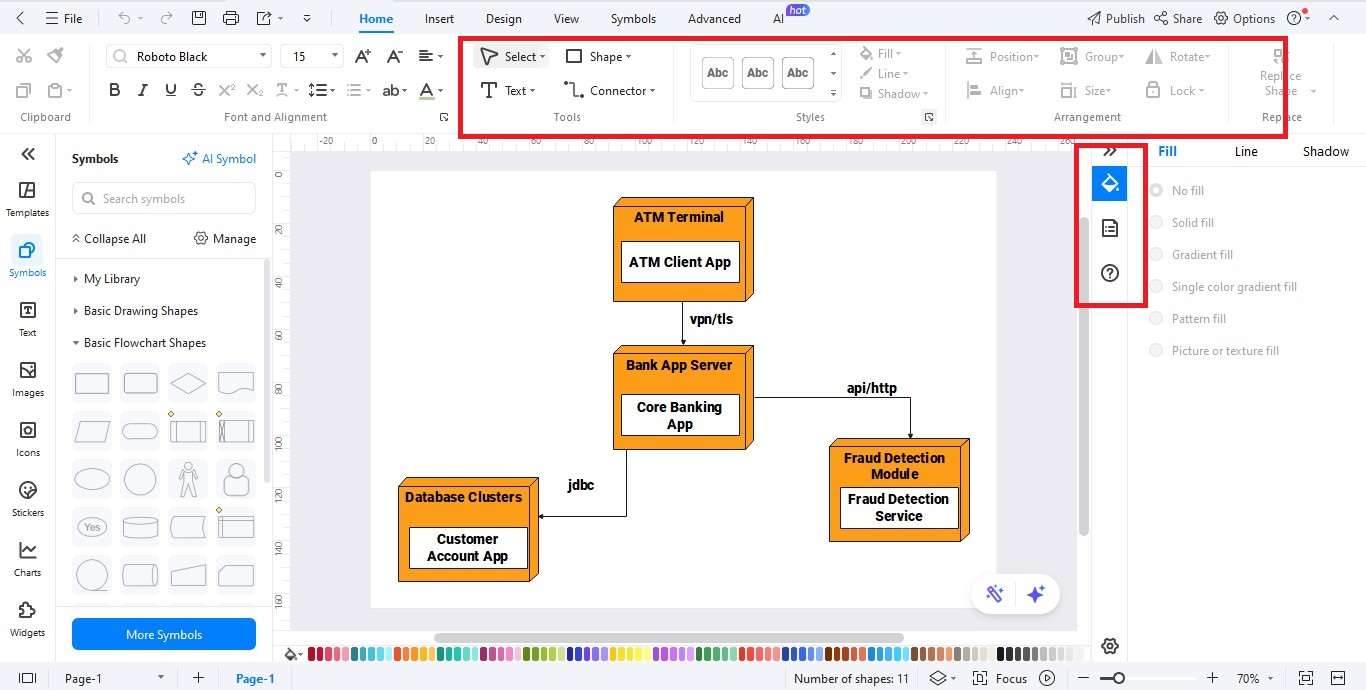
Step5 Personalize Your Diagram
- Use colors and labels to clarify your diagram.
- Add notes for encryption protocols, firewall layers, and redundancy.
- Align the nodes and space them for a neat look.
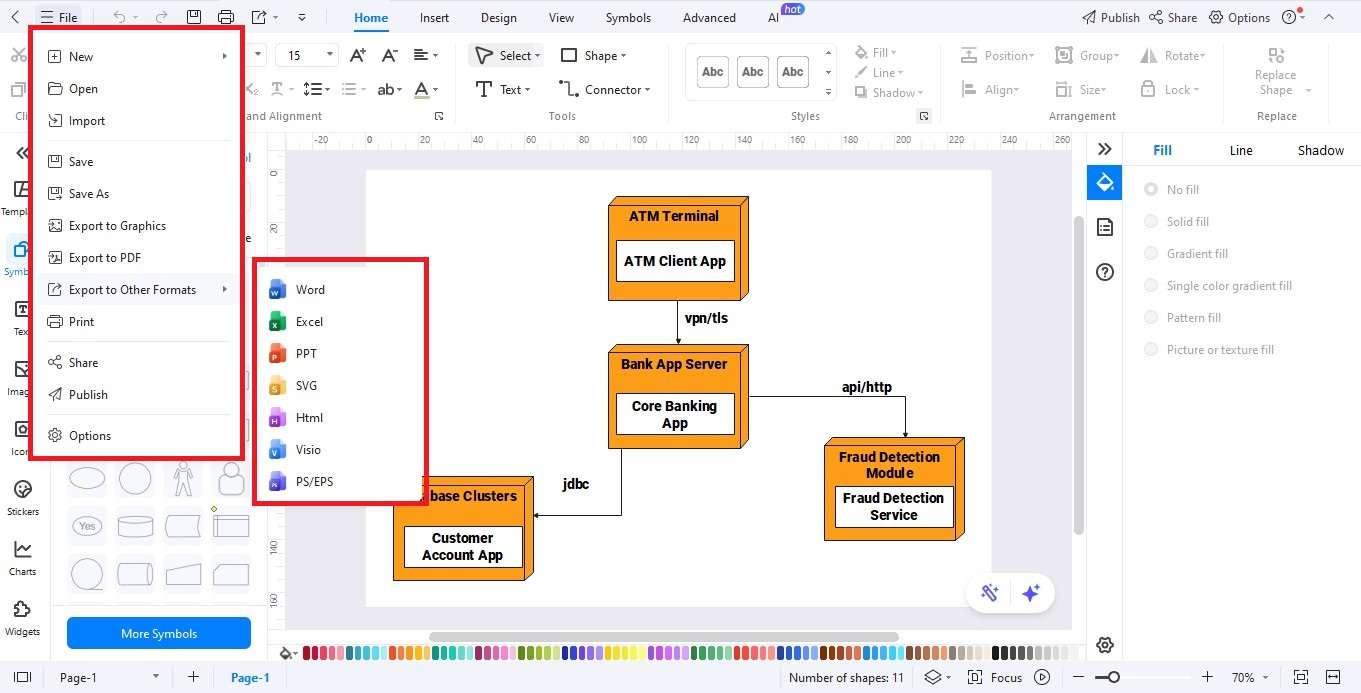
Step6 Export Your Diagram
- When you're finished, click the Export button.
- Save as PNG, PDF, SVG, Visio, or Word.
- Now, share with stakeholders or add to IT architecture documentation for better collaboration.
Best Practices for Designing ATM Deployment Diagrams
Keep diagrams simple and clear. Focus on essential nodes without extra details.
- Use Consistent Labels: Name ATMs, servers, and gateways the same way.
- Show Security Clearly: Include VPNs, SSL/TLS, firewalls, and encryption.
- Use Color Coding: Differentiate client devices, servers, and external systems.
- Explain Redundancy: Banks use failover servers, high availability, and backup clusters.
- Document Versions and Configurations: List the OS, software, and database in use.
- Review with Stakeholders: Validate with IT staff, network engineers, and security experts.
Ending Notes
A deployment diagram of the ATM management systems is not just a static picture. It shows how an ATM connects with a server, database, and outside services in real setups. This helps banks to strengthen security planning by defining new protocols. It minimizes design errors by matching software to physical configurations. It also improves communication among developers, IT officers, and bank managers. Deployment diagrams ensure that banking systems stay reliable, secure, and focused on customers. They cover everything from a point-of-sale ATM in rural areas to a core banking system in urban branches. Now, with cloud power, these systems gain extra scalability. It is quite easy, efficient, and collaborative to create these diagrams with tools like EdrawMax. In the tough banking world, deployment diagrams support both stability and innovation.
AI Diagram Generator
Enter your prompt. Upload files if needed. Generate diagrams, charts, or slides instantly.


