


The ATM process is familiar to everyone: insert your card, enter your PIN, select an amount, and receive your cash. Though this seems simple to the customer, it involves a complex, secure, and time-sensitive sequence of operations within the banking system. Each transaction must occur in the correct order.
Behind this seamless experience are interactions between the ATM, the customer, and the bank’s servers. To design, analyze, or document ATM software effectively, you need a clear way to represent these interactions. A UML sequence diagram is the ideal tool for this.
A sequence diagram shows the step-by-step flow of actions, detailing which actor performs what and when. This guide will explain what UML sequence diagrams are, their key components, and how to create one. We’ll also demonstrate how to use sequence diagram makers and share best practices for making your diagrams clear and useful.
In this article
What is a Sequence Diagram? Visualizing Time-Ordered Interactions
A sequence diagram shows the series of events happening between different actors. It is concerned with the sequence of transmissions and receipts over time. With an ATM, this may include the Customer, the ATM interface, and the Banking System. Imagine it as a conversation script. There is a role to each lifeline (or participant), and the diagram indicates when each one talks and when they listen.
The time is never at the same level, as it is always downward. It is used by developers to know what the system logic is like prior to writing code. Its dynamic nature helps the developers to understand the use case better. It is used by Testers to create test cases. Analysts apply it in ensuring that requirements are addressed.
Alternatively, it can be viewed as a structured call log. All requests and all replies are monitored, and it is not hard to see a step (or a step sequence) ignored or in the wrong sequence. Order and security are important in a critical process such as an ATM cash withdrawal, so sequence diagrams are necessary.
Core Components of a Sequence Diagram
To build a clear sequence diagram for ATM management, you need to know its main parts. Let’s look at them in detail:
Lifeline
For ATM management, the common lifelines are: Customer, ATM Interface, and Banking System. Each lifeline shows how long a participant is involved in the sequence and is represented by a dashed line.
Activation Bar
An activation bar shows when the participant is actively performing a task or waiting for a response. For example, when the PIN validation takes place, the activation bar (a thin rectangle) shows that the server is processing.
Messages
Messages are the arrows between lifelines that show how communication is processed over time.
- Synchronous Message (solid arrowhead): The sender sends a request and waits until a response is received. Example: verifyPIN() sent to the bank.
- Return Message (dashed arrow): The receiver sends a reply to the sender. Example: PIN Valid or PIN Invalid.
- Asynchronous Message (open arrowhead): Optional. It means the sender continues without waiting. Example: an ATM might send a maintenance alert without blocking other functions.
Frame
A frame is a labeled box that wraps around the sequence diagram. It helps define scope. For example, you might label it sd Successful Cash Withdrawal to show the process you’re modeling.
Combined Fragments
These are optional but powerful. They allow you to show conditions and loops. For example:
- alt (alternative): Used for choices, such as “PIN valid” vs. “PIN invalid.”
- opt (optional): Used for optional flows, such as printing a receipt.
- Loop: Used when an action can repeat, like retrying PIN entry up to three times.
Together, these components let you capture both the main success path and variations in the ATM withdrawal process.
Examples of Sequence Diagram for ATM Management System
Sequence Diagram for ATM Cash Withdrawal

In this figure, the Customer, ATM Interface, ATM Control, Transaction Unit, and Printer communicate to accomplish a withdrawal. The process begins when the Customer inserts their card and provides the PIN. At this stage, the ATM Control will authenticate the PIN and subsequently query the customer’s account.
A request is forwarded to the Transaction Unit, where account information is returned. When this process is completed, the ATM prompts the customer to take his/her card before the payment is received. Lastly, a customer asks to be given a receipt, which is provided by the Printer. In this model, interaction between the interface, control logic, and supporting units, such as printing, is done in steps.
Sequence Diagram for ATM Process

This figure simplifies the interaction to three key entities: Customer, ATM, and Bank. The ATM requests the card and PIN. If valid, it displays options for the Customer to select a transaction and enter an amount. The ATM then transmits the request to the Bank, who process it and sends the result back.
A successful response will result in the ATM giving out cash, while a failure will be indicated by an error. Bad PINs re-enter. This sequence points out the success/failure results of transactions and the validation of the Bank.
Sequence Diagram for ATM Security

In this sequence, the Bank Cash Officer and Security Guard arrive at the ATM location. The Security Guard requests access authentication, which the ATM verifies with the Bank Server. Upon successful verification, the vault is opened, and the event is logged. Cash cassettes are loaded by the Cash Officer, after which the ATM updates its inventory records.
Any mismatch triggers a manual verification. Diagnostics are then run to detect any hardware issues; if any are found, maintenance tasks are scheduled. Finally, the vault is closed, confirmation is received, a replenishment report is sent, and the officer is escorted back securely.
How to Create a Sequence Diagram for an ATM Management System
With EdrawMax, it's easy to create sequence diagrams. Here are the six steps you need to follow to draw your own ATM system sequence diagram:
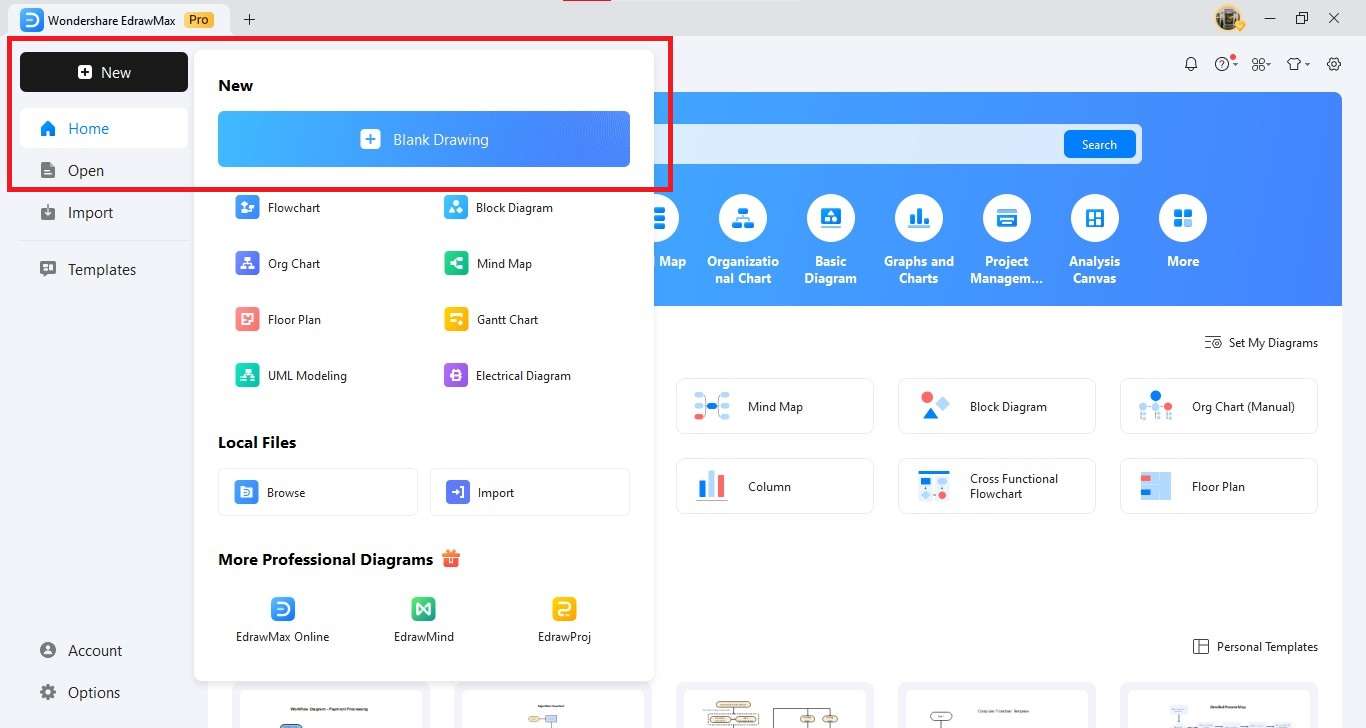
Step1 Create a New Canvas
- Launch EdrawMax on your computer.
- Now click New → Blank Drawing from the left-side panel.
- A fresh canvas is presented for you to create the sequence diagram.
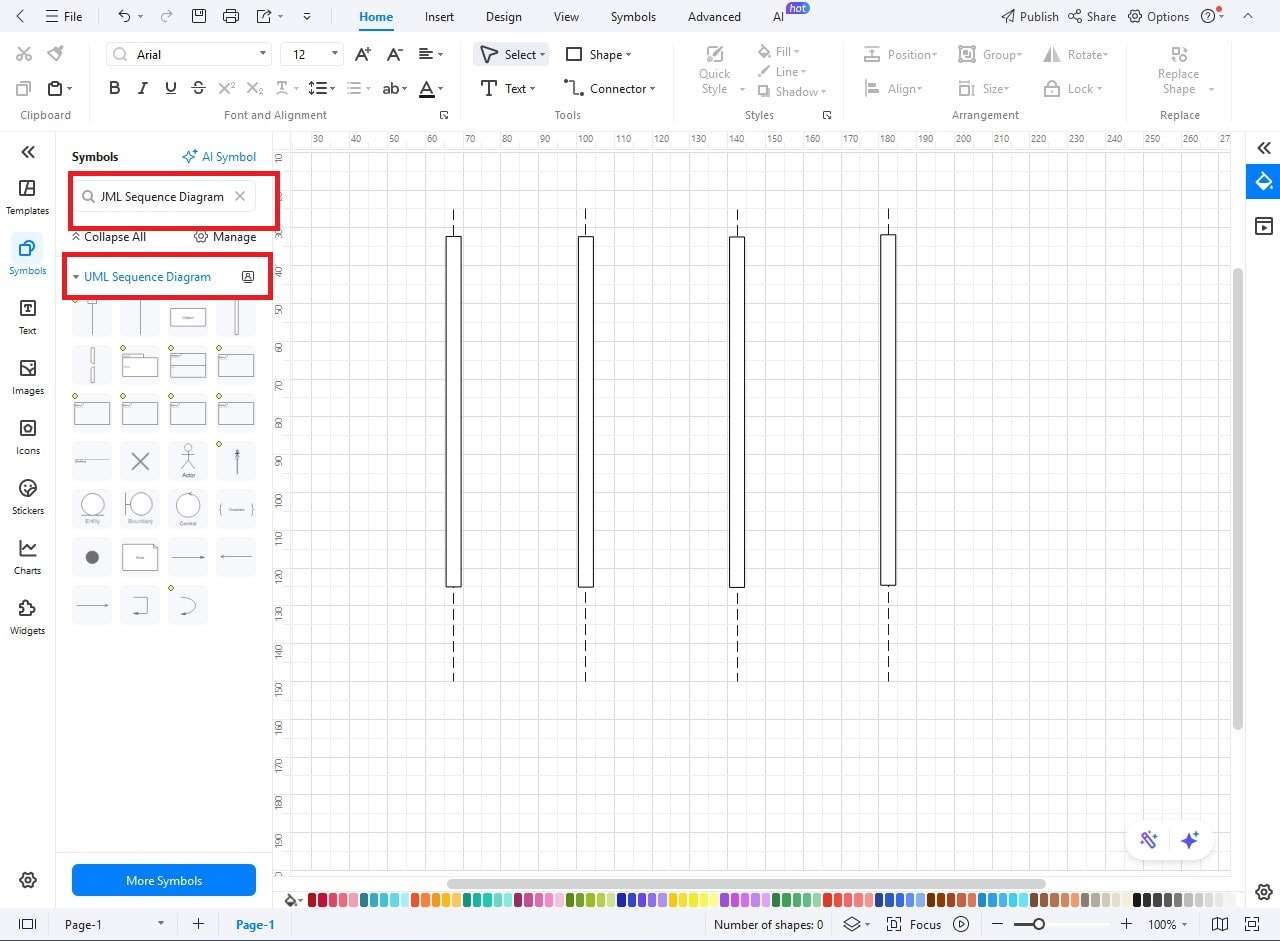
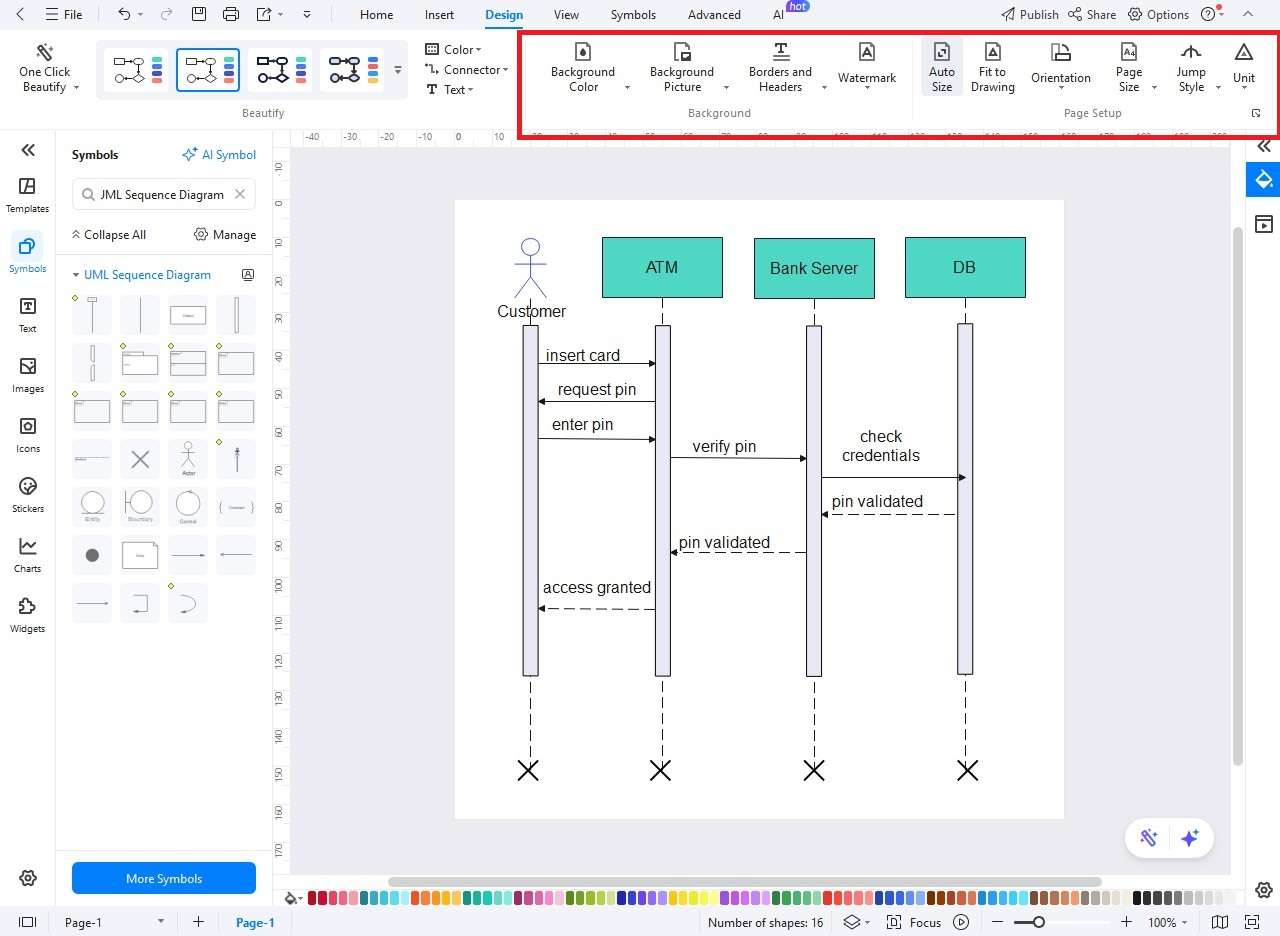
Step2 Add UML Sequence Diagram Symbols
- Open the Symbol Library and activate UML Sequence Diagram symbols.
- Drag and drop the lifelines (vertical dashed lines) for the main actors: Customer, ATM, Bank Server, Account Database.
- Lay them side by side from left to right.
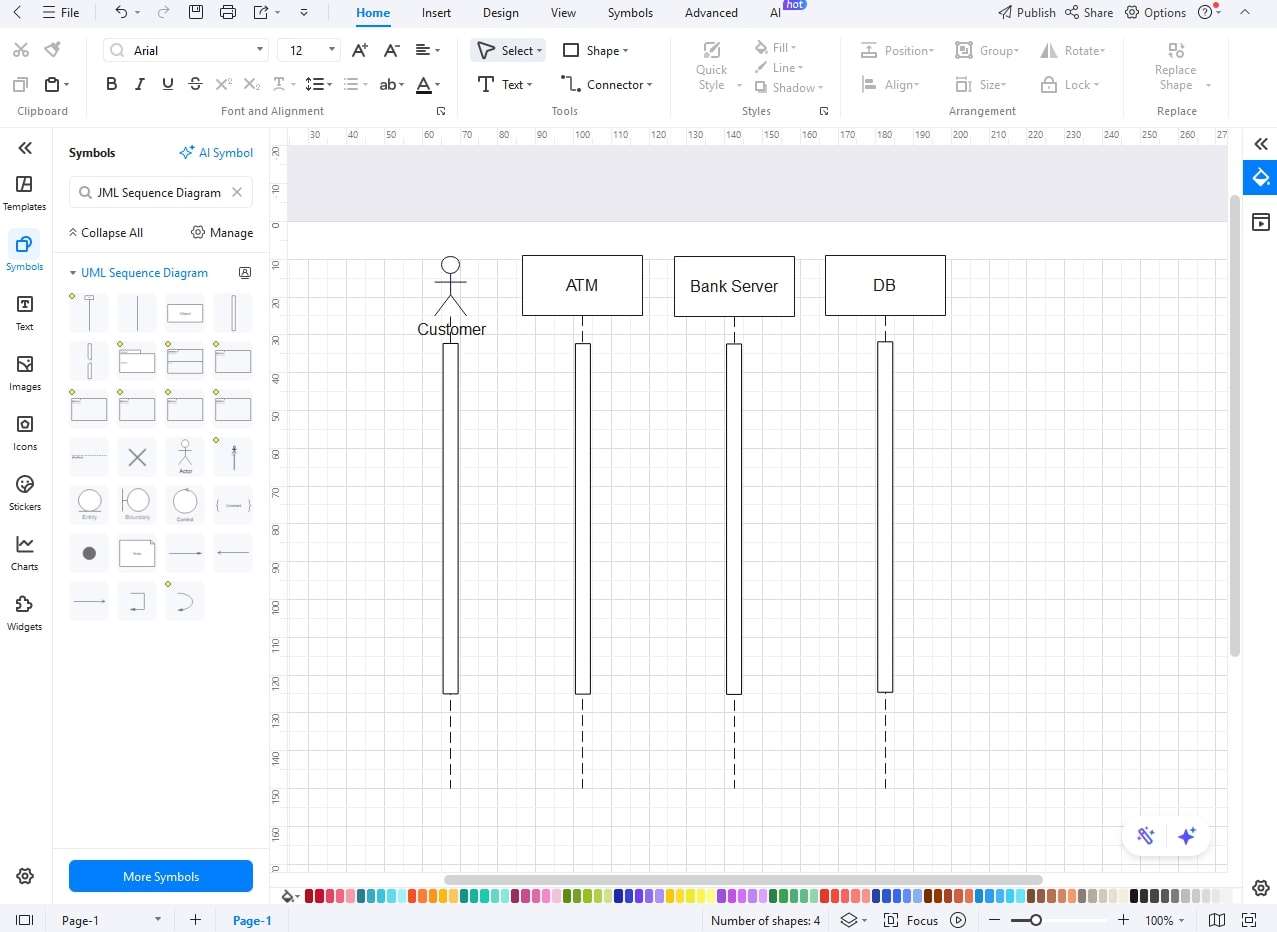
Step3 Identifying Objects and Actors
- Include actors such as Customer and Bank System.
- Include objects such as an ATM Machine and an Account Database.
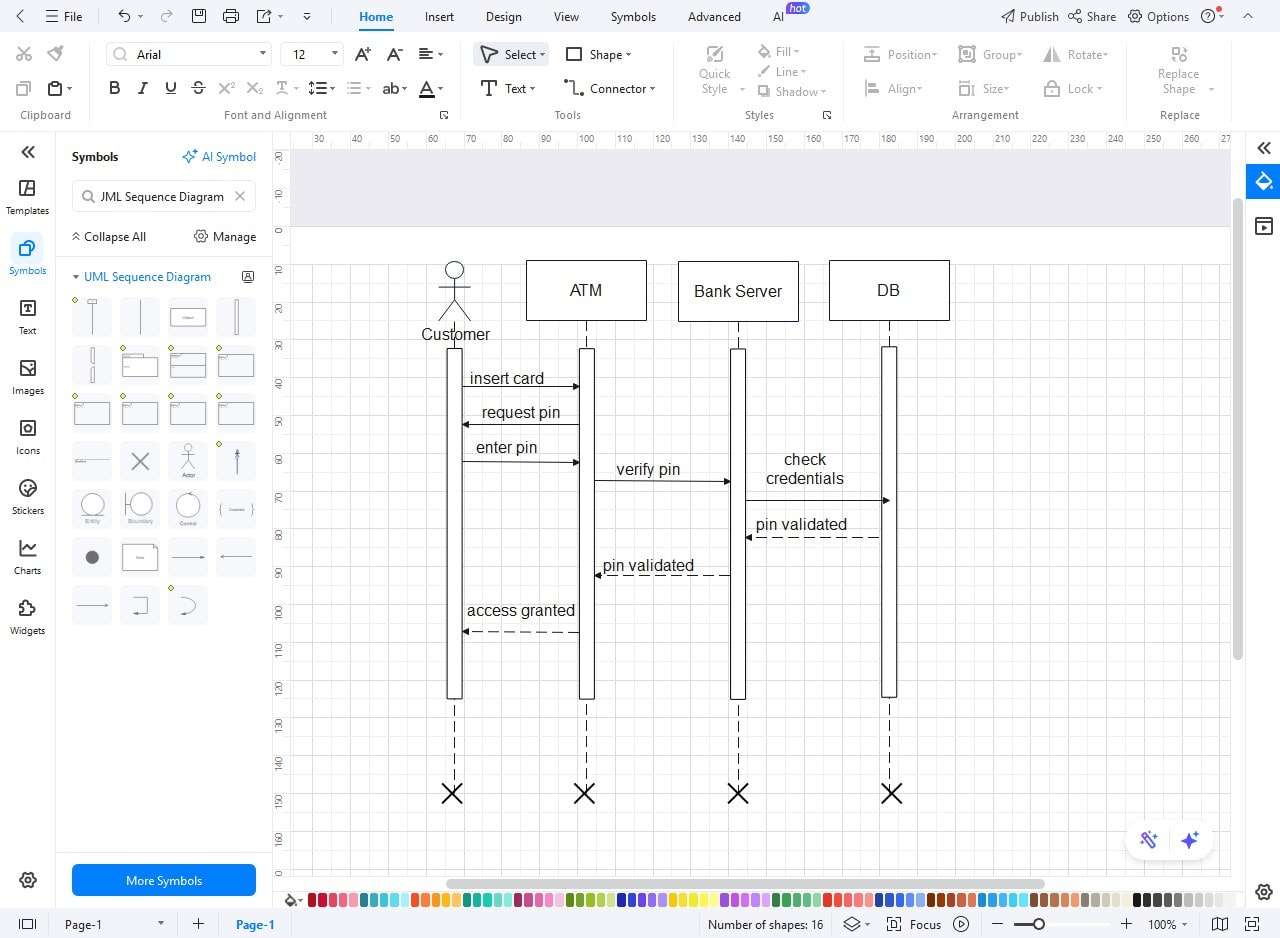
Step4 Insert Messages Between Lifelines
- Synchronous messages (e.g., enterPIN()) should be drawn using solid arrows.
- Use dashed arrows for feedback messages (e.g., PIN Validated).
Step5 Customize and Refine
- Enable fonts, colors, and line styles from the Format Toolbar.
- Ensure lifelines are evenly spaced.
- Include messages for critical states, such as PIN incorrect or low funds.
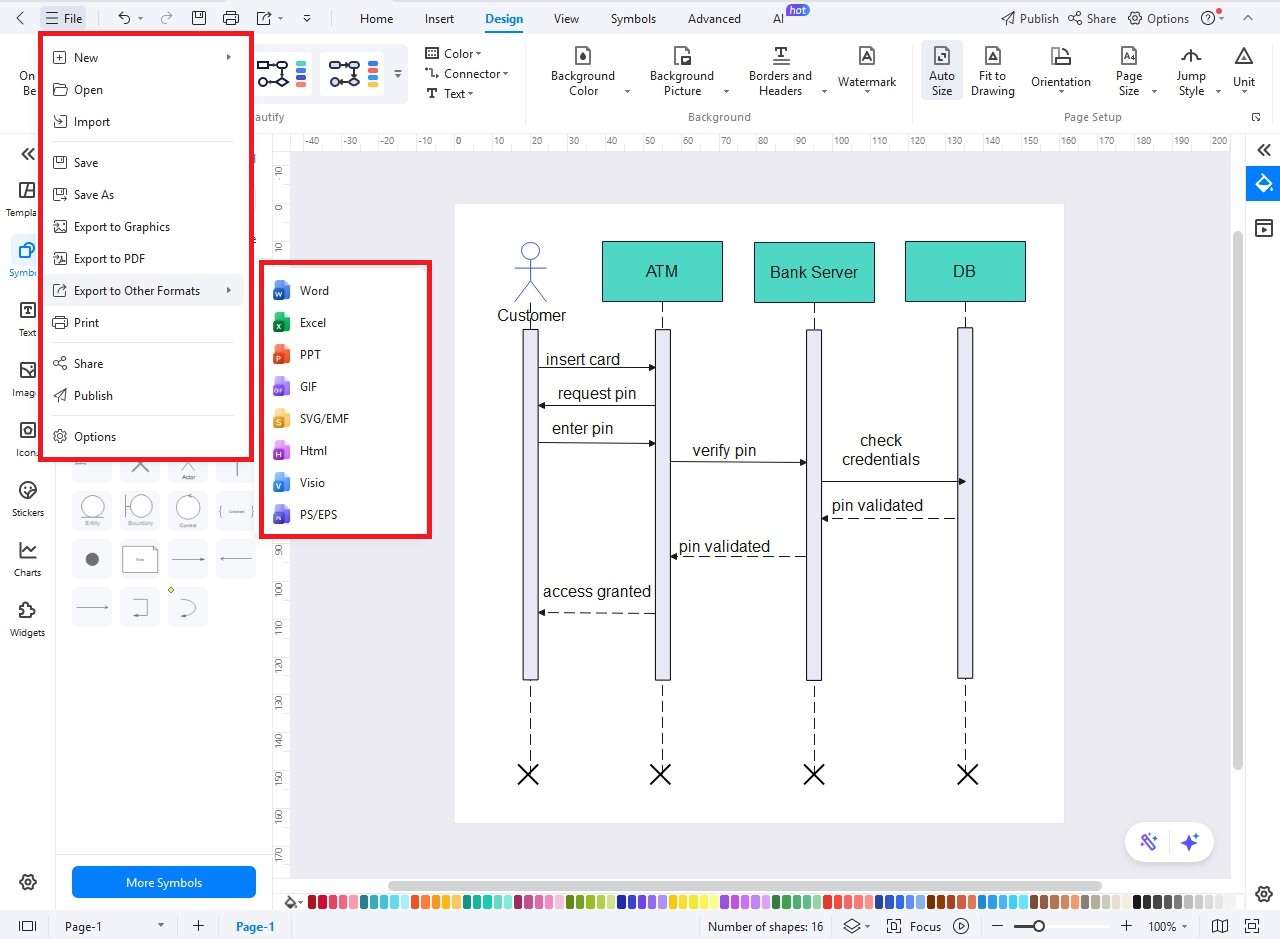
Step6 Export and Share
- Click the Export button in EdrawMax.
- Export in multiple formats such as PNG, JPG, PDF, SVG, or Visio.
- Pass to your developers, bankers, or include it in system documentation.
Good Practices for Effective Sequence Diagrams
- Start with a Single Direction: Go with the happy path first and then add error cases. Use separate diagrams.
- Name Messages Clearly: Use verb-noun forms like verifyPIN(), authorizeWithdrawal(), dispenseCash().
- Use Activation Bars: They make it clear when an object is running code or waiting.
- Make it Readable: Line up the lifelines, do not cross arrows, and divide long processes into smaller diagrams.
- Version your Files: Save diagrams with version numbers or a date in the name.
Ending Notes
A sequence diagram for ATM management is more than just a chart. It’s a precise map of how customers, machines, and banking servers interact step by step. You present lifelines, activation bars, and messages sequentially, thus simplifying complex flows.
It becomes easier for the developers to write maintainable code. Testers can create better test cases covering both the success and error cases. Analysts can verify requirements. Such tools as EdrawMax allow drawing such diagrams quickly and easily, and even a novice can do it.
Be it modeling a successful cash withdrawal or working with such cases as invalid PIN or insufficient funds, sequence diagrams can be used to make sure that ATM systems are secure, reliable, and easily serviceable.
AI Diagram Generator
Enter your prompt. Upload files if needed. Generate diagrams, charts, or slides instantly.


