


A library management system handles key operations such as managing books, tracking members, processing borrow and return actions, and overseeing staff activities. To keep these processes running smoothly, it's essential to understand how information flows between users, system functions, and data storage.
A data flow diagram (DFD) makes this easier by mapping how data moves through the system—who initiates it, how it's processed, and where it's stored. This gives both technical and non-technical stakeholders a clear view of how the system works.
Developers rely on DFDs to plan database structures and system logic. Librarians and administrators use them to ensure workflows reflect real-world library operations.
In this article, we’ll break down how data flows through a library system. You’ll learn the different DFD levels, core components, and how diagramming tools can help you quickly create and share diagrams.
In this article
What is a Data Flow Diagram?
A data flow diagram is a picture of how data moves through a system. It does not show code. It shows who sends data, what process changes it, and where it is stored.
A DFD for library management is built using four elements:
External Entities
- Student/Member – the person borrowing or returning books.
- Librarian – staff managing the system.
- Book Supplier – provides new books to the system.
- Admin – manages users, books, and overall records.
Processes
- Borrow Book – checks availability and updates records.
- Return Book – updates stock and calculates fines if needed.
- Search Book – finds book details by title, author, or subject.
- Manage Membership – register new members, update info, or cancel accounts.
- Fine Calculation – calculate penalties for overdue books.
Data Stores
- Book Database – stores attributes like ISBN, title, author, and stock availability count.
- Member Database – contains student/member profiles.
- Transaction Records – logs of borrow and return operations.
Data Flows
- Borrow Request → Borrow Book Process → Transaction Records.
- Return Request → Return Book Process → Transaction Records.
- Add Book → Book Database.
- Fine Payment → Member Account.
These components together form the library management system DFD. They also ensure that the system captures every key activity.
Examples of DFD for a Library Management System
Data Flow Diagram for Library Administration
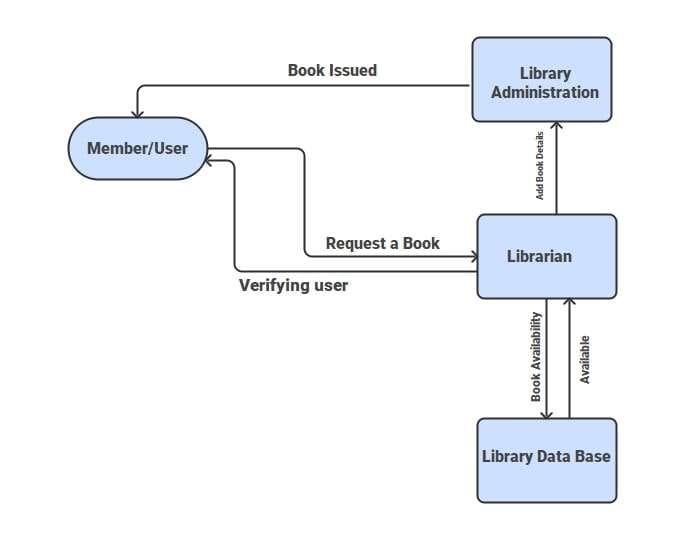
This Data Flow Diagram (DFD) outlines the library management process. You can easily adapt it to your library system. The process starts when a member requests a book. The librarian authenticates the request and checks the library database for availability. If the book is in stock, the library administration authorizes the issue and updates the record.
This system creates a smooth connection between users, the librarian, and library administration. It also ensures accurate database records. Overall, the DFD clearly shows the book issuing, verification, and recording processes. It highlights user authentication, book availability checks, and proper management updates.
Data Flow Diagram for Book Tracking
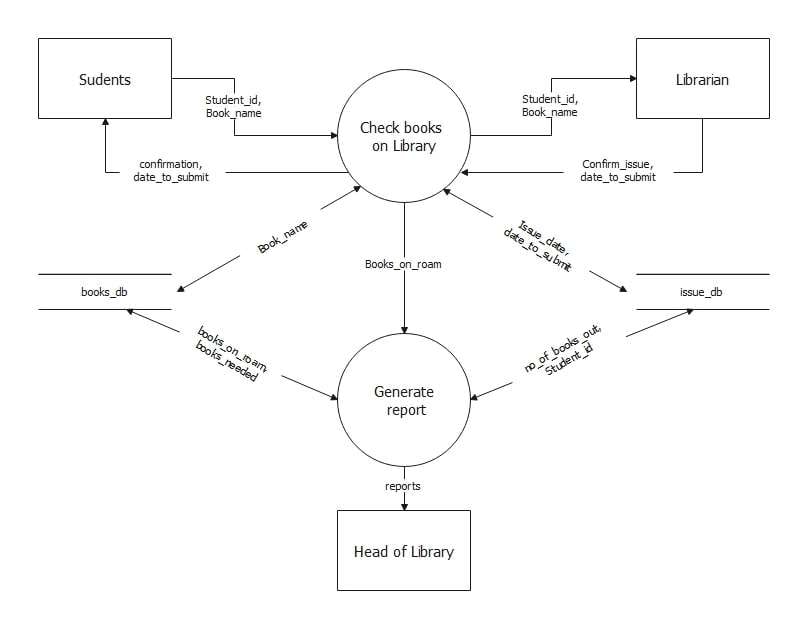
The DFD highlights the monitoring and reporting function of the library management system. Students and librarians interact when students browse books. They submit their student ID, book titles, and issue details. The system records these transactions in the issue database and stores data in the books database.
It also generates reports on issued books, overdue items, and student lending records for librarians to review. This DFD shows how Books on Loan can be tracked effectively and transparently. It illustrates a clear flow of information from patrons to databases to reports, leading to better library management.
Data Flow Diagram for Library Operations
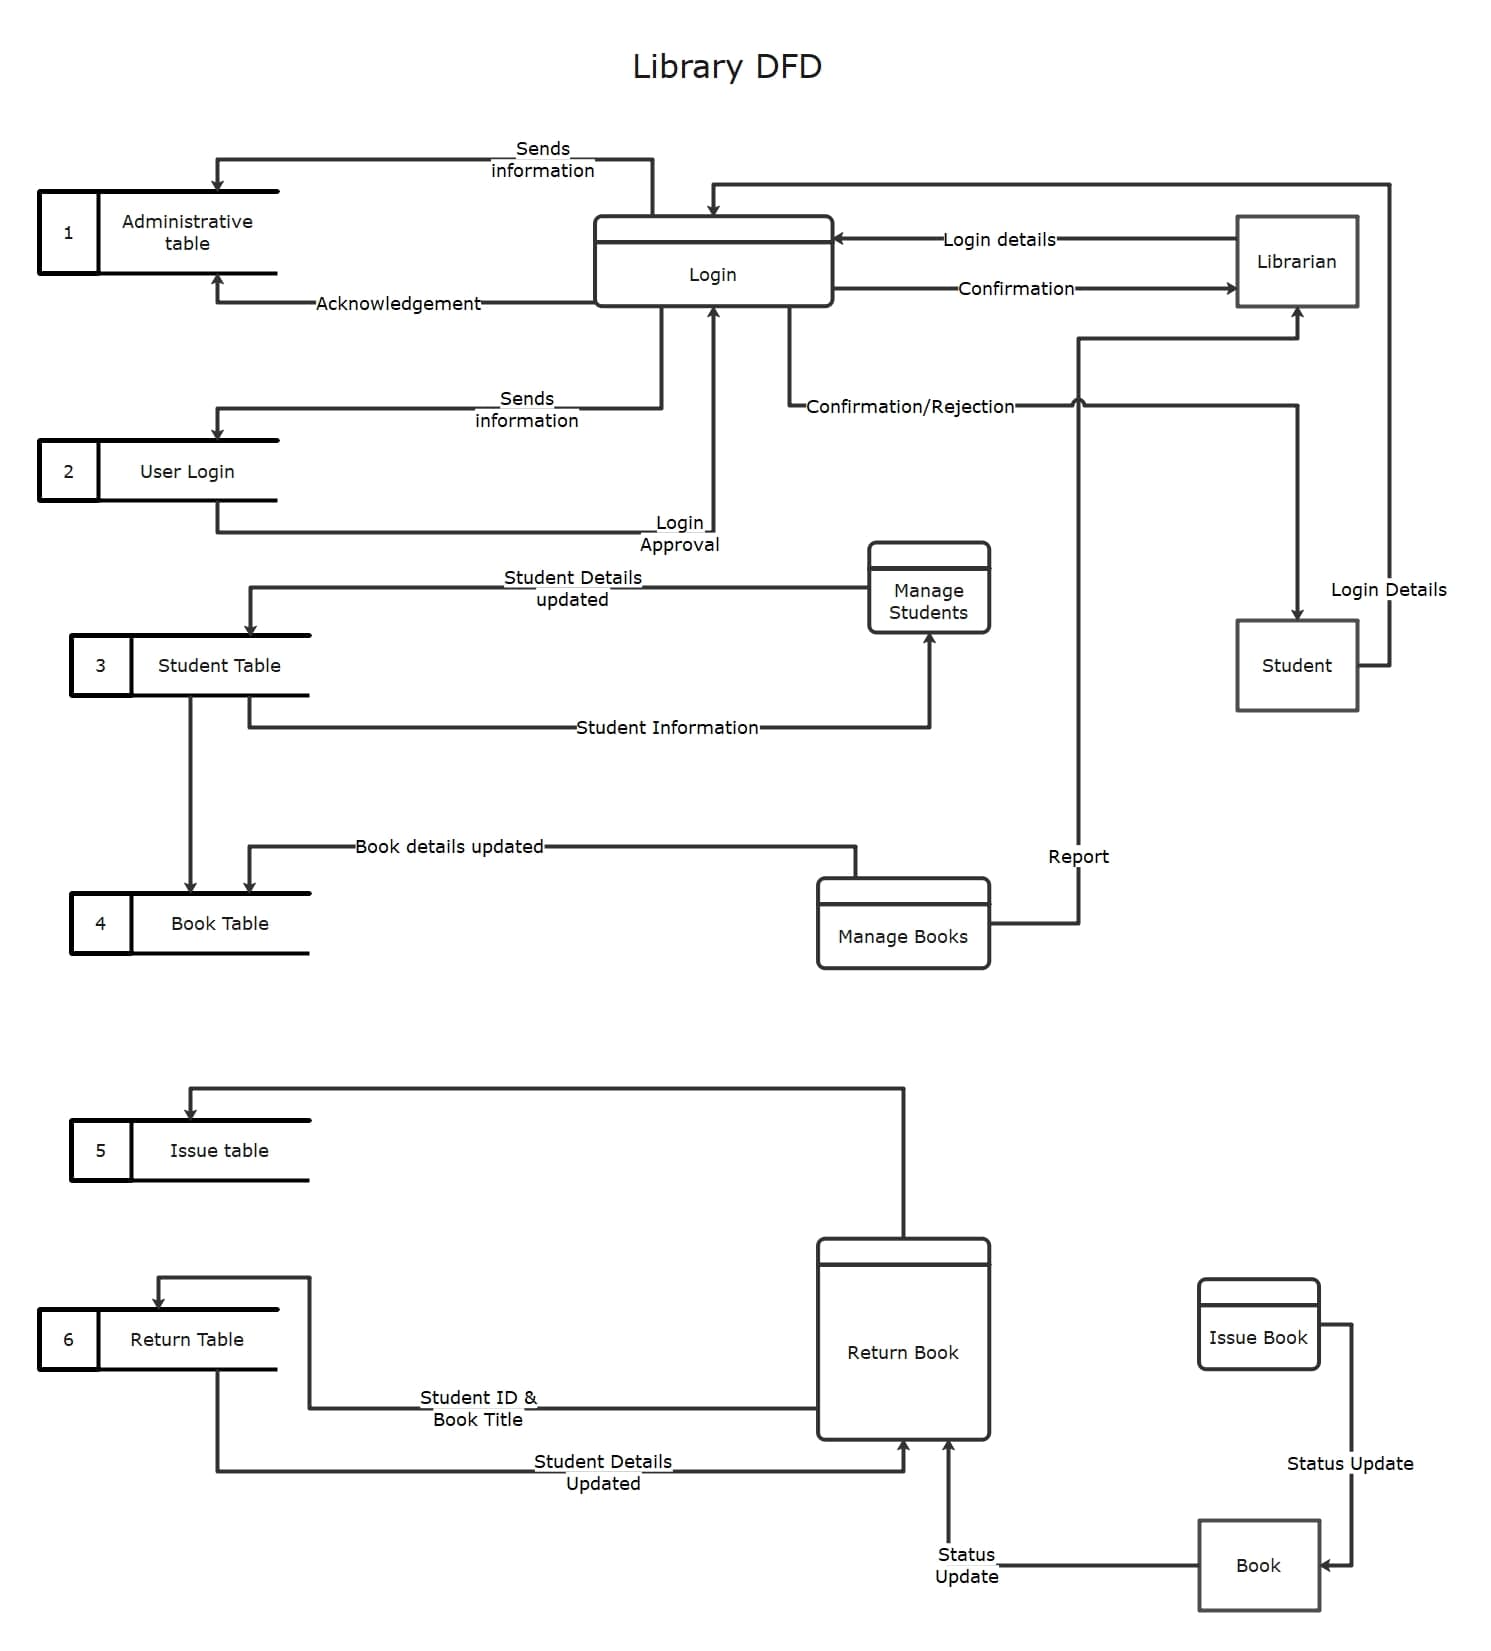
The DFD shows a complete library system. It includes user and admin login functions at the start of their operations. Librarians and students log in to access services. The system manages student information, book records, and transactions.
The DFD features an issue table and a return table. These tables help track the borrowing and returning of books and update the database.
Reports are generated for available books, status updates, and user interactions. This graph illustrates the flow of protocols in the library. It covers authentication, book handling, borrowing, and returning. It also highlights how automation improves efficiency, accuracy, and user experience in modern library systems.
How to Make a DFD for Any System in 4 Basic Steps
Step 1: Define the system’s boundary and actors
Identify and list the system’s actors interacting with the system within the defined scope. Create your external entities.
Step 2: Draw Level 0
Add one process for the whole system. Connect it to each entity with clear labels on all arrows. No data stores at this level.
Step 3: Create Level 1
Split the main process into 4–6 core processes. Add needed data stores. Also, remember to balance with Level 0: There should be no difference between the inputs and outputs.
Step 4: Review and enhance
A process should have inputs and outputs. Avoid unlabeled arrows. Do not connect an external entity directly to a data store; flows must pass through a process.
How to Create a Data Flow Diagram for Library Management
Understanding the theory is one thing, but creating a professional DFD yourself is the best way to learn. You don’t need complex software or any design background to begin.
Using the free online Data Flow Diagram builder, EdrawMax, you can create readable, standard-compliant Data Flow Diagrams in your web browser. This allows you to apply the concepts immediately.
It is a lean but effective tool with an easy user interface, ready-to-use DFD symbols, and cloud storage to facilitate collaboration. It’s perfect for students, analysts, and anyone new to diagramming.
Why Use EdrawMax for Your DFD?
- No Installations: Launch directly in your browser, saving time and storage.
- Smart Symbols: Drag-and-drop processes, data stores, external entities, and flows without worrying about alignment.
- Templates to Start Fast: Pre-built DFD templates for systems like library, bank, or hospital management cut setup time.
- Collaboration Ready: Post diagrams online to receive feedback.
- Many Export Options: PNG, JPG, PDF, Word, Visio, or SVG formats available for saving or embedding.
Steps to Create a DFD for Library Management with EdrawMax
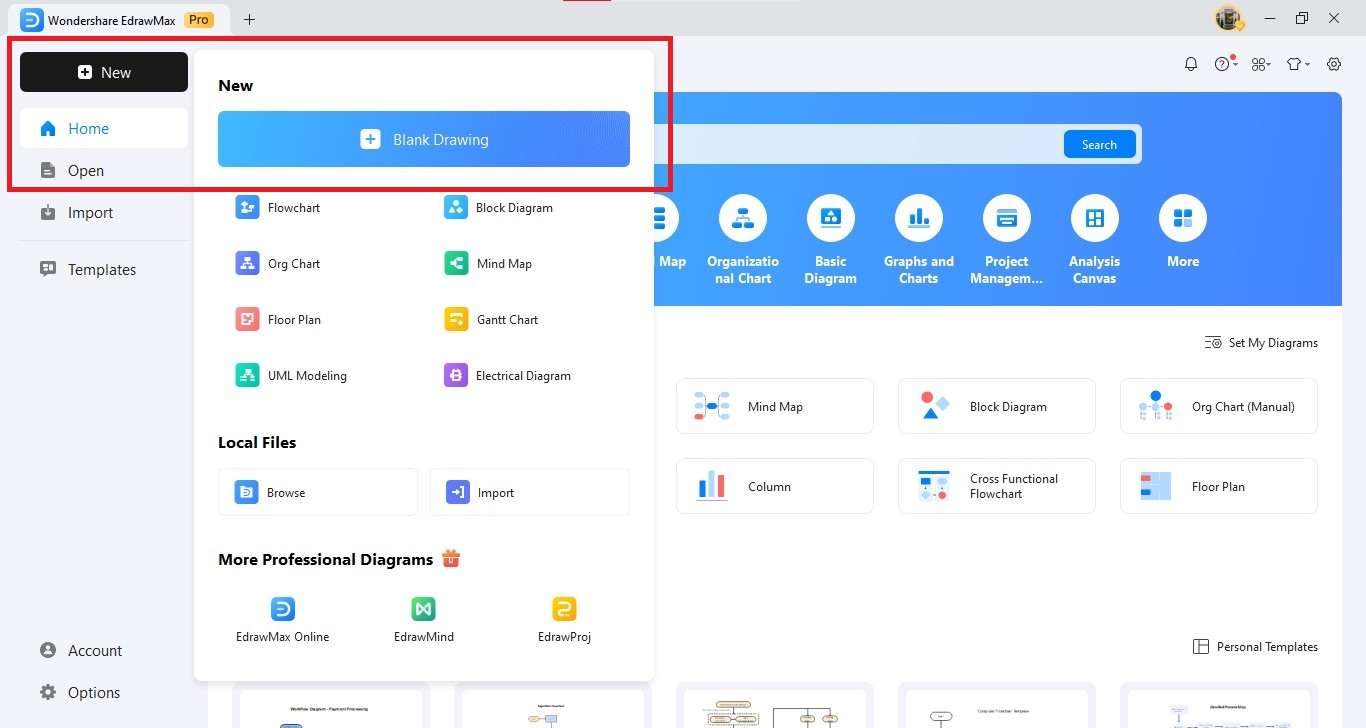
Step 1: Create a New Canvas
- Open EdrawMax on your desktop.
- Find New on the left panel and click it.
- Choose Blank Drawing to start with a clean canvas.
Step 2: Insert DFD Symbols
- Open the Symbol Library in the left panel.
- Turn on DFD symbols: Process, Entity, Data Store, and Data Flow.
- Drag and drop these shapes onto your canvas. Resize and position them as needed.
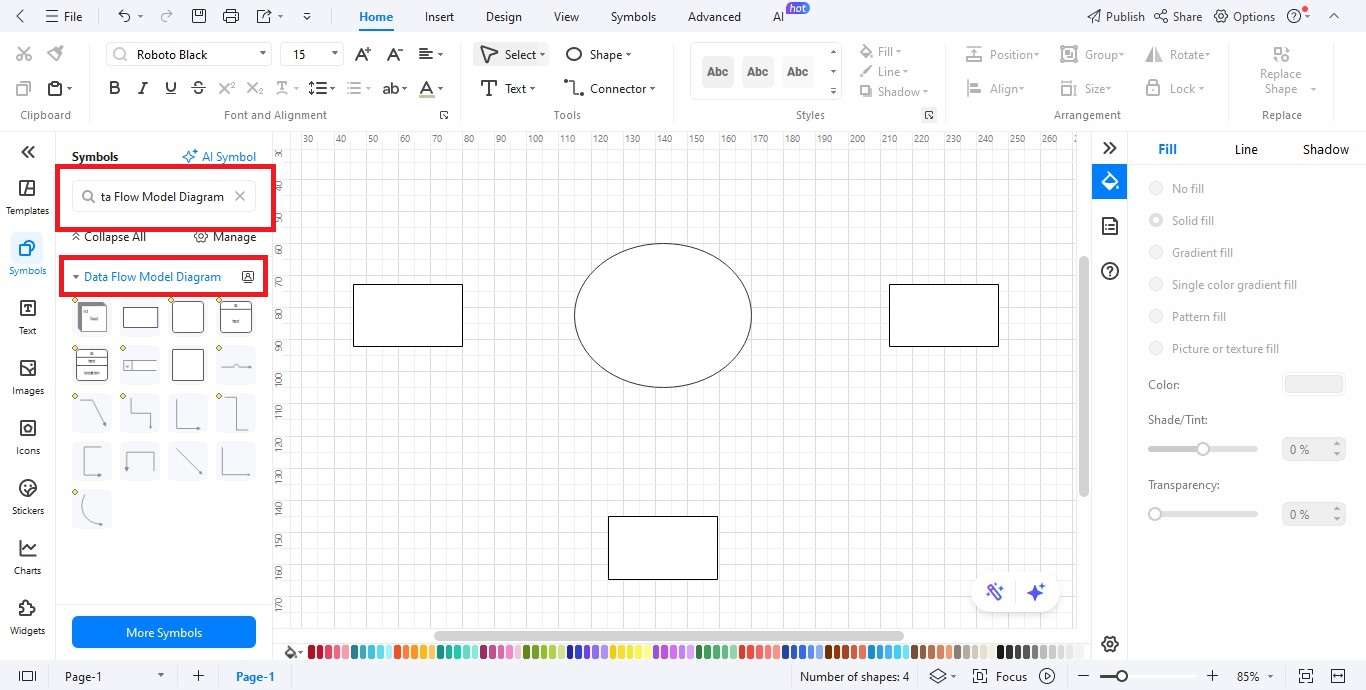
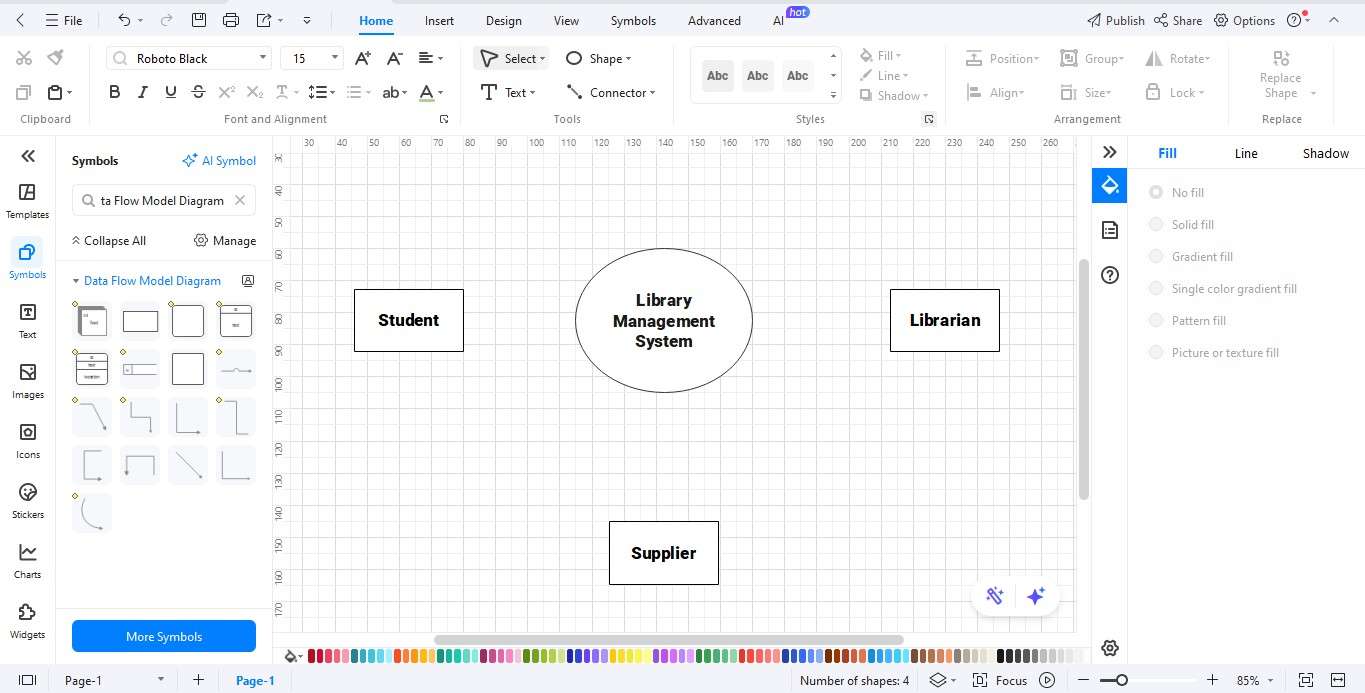
Step 3: Add External Entities
- Add entities that interact with the system: Student, Librarian, and Supplier.
- Position them at the diagram’s edges for clear visibility.
- Label each entity clearly to prevent confusion.
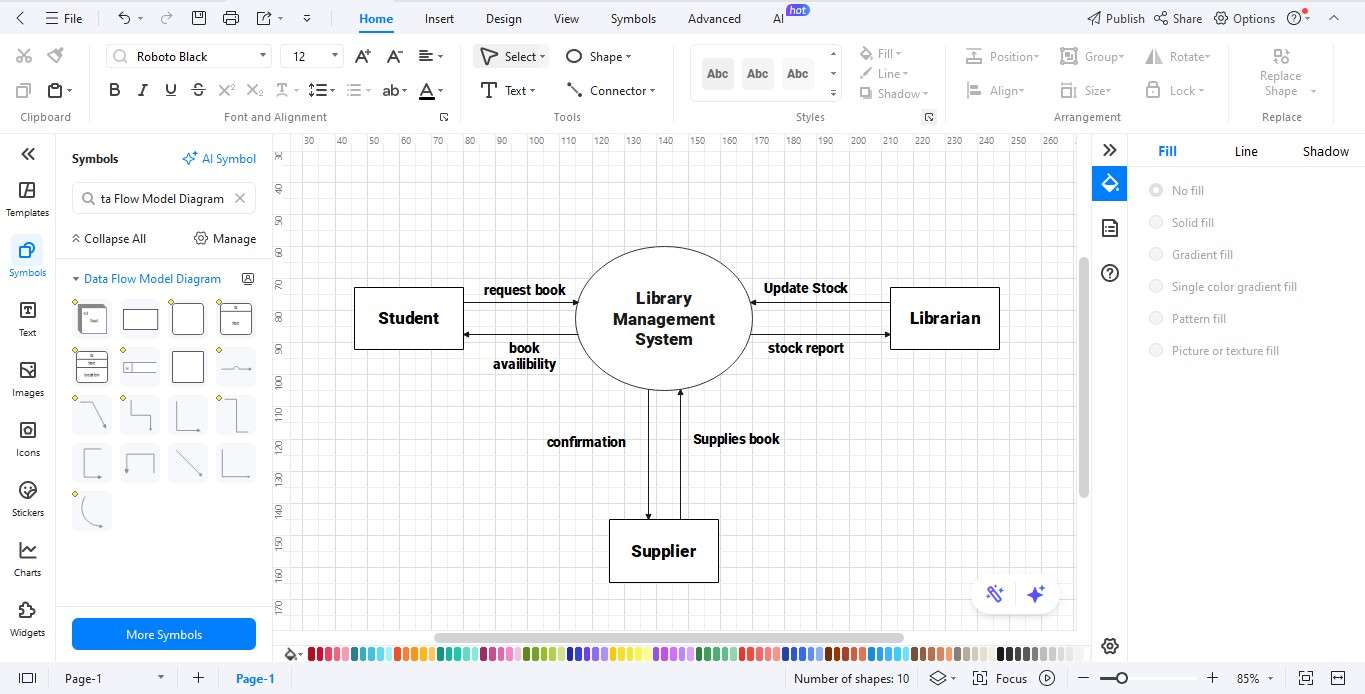
Step 4: Link with Data Flows
- Connect Entities, Processes, and Data Stores with Data Flow arrows.
- Label flows with names like Book Request, Borrow Record, Membership Info, and Return Details.
- Ensure all flows match actual library processes.
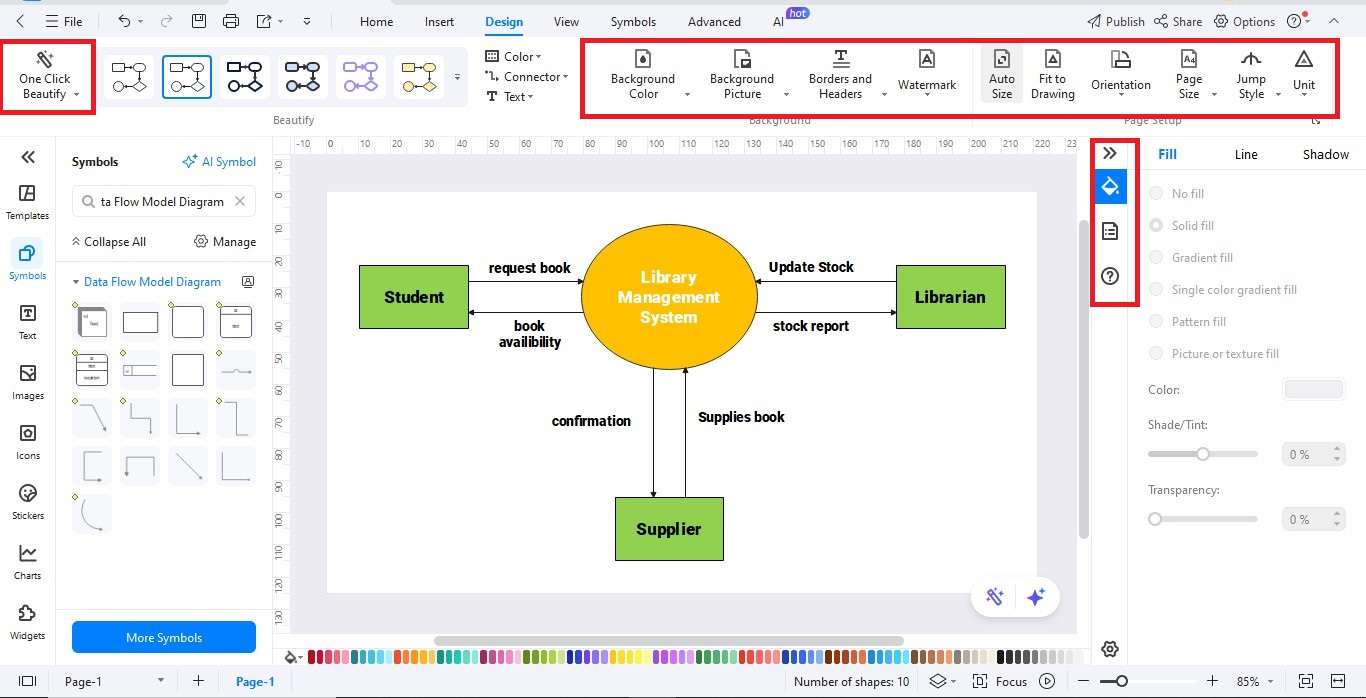
Step 5: Personalize Your Diagram
- Customize colors, fonts, and line styles using the Format toolbar.
- Use alignment and spacing tools to keep the diagram clean and professional.
- Add titles or legends for clarity if needed.
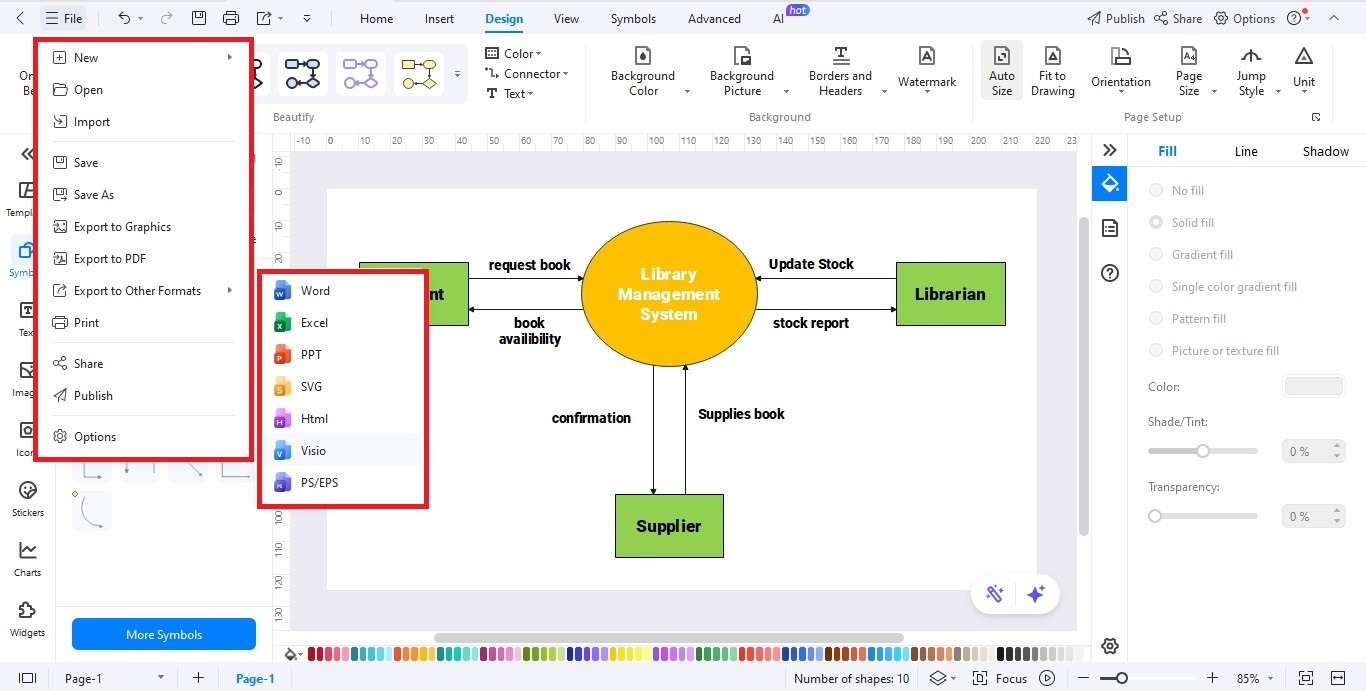
Step 6: Export Your Library DFD
- When done, click the Export button.
- Select from file formats like JPG, PNG, PDF, Word, Visio, or SVG.
- Save and share your diagram as needed.
Best Practices for Creating Effective and Readable DFDs
- Start with a context-level DFD (Level 0); add detail only when needed.
- Use simple names. Prefer “Borrow Book” over technical jargon.
- Keep arrows labeled. Every flow should be clear at a glance.
- Update diagrams whenever workflows change. This keeps design, testing, and training aligned.
Ending Notes
A DFD for library management is one of the most useful tools in designing and running a library system. It explains how books, members, and staff interact with processes and data stores.
By showing different library DFD levels (context, detailed, sub-processes), teams can improve clarity, reduce errors, and design accurate databases. A library management system DFD is especially important in software engineering, as it guides database creation, testing, and integration.
One can easily and collaboratively create and update a data flow diagram library system with tools such as EdrawMax. DFDs are a critical component of constructing effective and efficient library management systems, whether during system design, staff training, or database planning.
FAQ
-
How are Level 0 and Level 1 different?
Level 0 shows the whole system as one process and its external actors. Level 1 breaks that process into major sub-processes and adds key data stores. -
What is the most common mistake?
Unbalanced diagrams. The inputs and outputs at Level 0 must match the inputs and outputs across Level 1. -
Can an external entity write to a data store directly?
No. All reads and writes must go through a process. This keeps control and logic in one place. -
Why use a DFD in software engineering for libraries?
It bridges user needs and system design. It guides database work, testing, and change control in a simple, visual way.
AI Diagram Generator
Enter your prompt. Upload files if needed. Generate diagrams, charts, or slides instantly.


