


Gantt charts are popular tools for tracking project schedules and visualizing task flow. They help teams see progress and spot delays with a clear timeline.
Many industries use them because they make project stages easier to organize. Gantt charts place tasks on a horizontal timeline so teams can follow the work's order.
This simple view supports planning, reporting, and collaboration across many project types.
In this article
- What Is a Gantt Chart
- History of Gantt Charts
- Pros and Cons of Using Gantt Charts
- When (and When Not) To Use Gantt Charts
- Core Components of Gantt Charts
- Gantt Chart vs Timeline
- Who Uses Gantt Charts
- Why Gantt Charts Matter in Project Management
- Examples of Gantt Charts
- More Gantt Chart Templates
- How To Create a Gantt Chart With EdrawMax
- Tips for Designing Effective Gantt Charts
What Is a Gantt Chart
A Gantt chart is a project planning tool that shows tasks on a timeline. Each bar displays a task’s start and end dates, along with its progress.
This view helps teams understand the work order and the time required for each stage. A Gantt diagram supports project tracking in schoolwork, business tasks, and long projects with many activities.
Users often search online for a Gantt chart template or a Gantt chart maker to save setup time and start planning faster.
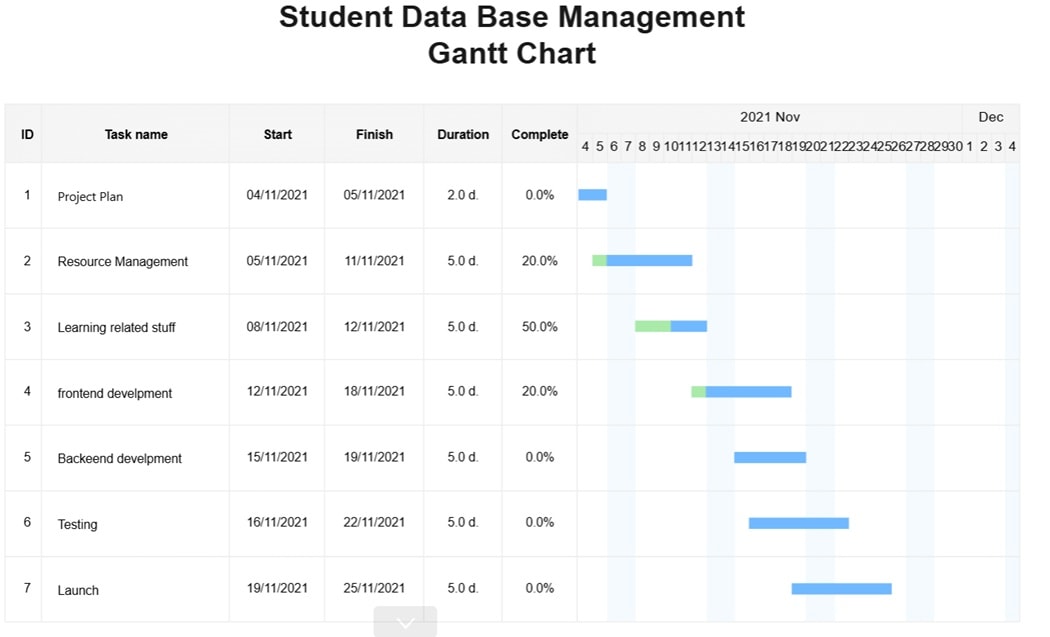
This is made from Wondershare EdrawMax. The tool helps teams turn complex project details into clear timelines for easier tracking and coordination.
This Gantt chart outlines a student database project. It shows tasks for planning, resource setup, learning, frontend and backend development, testing, and launch. The timeline helps track progress and maintain order across stages.
History of Gantt Charts
The first Gantt charts appeared in the early 1900s. Henry Gantt created the method to help factories track schedules for large operations.
These charts were drawn on wide sheets of paper, and staff updated them with pencils or markers. Large projects needed frequent edits, so teams often needed fresh sheets.
When office computers became part of daily work, digital Gantt charts replaced the paper sheets. Software tools offered resizable bars, adjustable durations, and simple drag controls.
Today, teams can export editable files, share online versions, or build full charts with automation tools. Many industries use them because they support both planning and progress tracking.
Pros and Cons of Using Gantt Charts
Gantt charts are popular in project management because they turn tasks and schedules into a clear visual map. Even with these strengths, Gantt charts also have limits. Below are its pros and cons:
When (and When Not) To Use Gantt Charts
Gantt charts are helpful, but they are not always the right choice. Knowing when to use them and when to choose a simpler method helps teams save time and avoid confusion.
Best times to use a Gantt chart
- Project tracking
- Reporting progress
- Long schedules with many stages
- Work shared by several teams
- Client-facing plans
A Gantt chart adds strong structure, but it may be heavier than needed for simple tasks. Some workflows benefit from a lighter tool. Choose a different method when:
- A project has a small set of tasks
- Requirements shift so often that the schedule changes nonstop
- The work explores ideas without fixed steps
Best use cases
Gantt charts work well for project tracking. They help with reporting progress and keeping long schedules organized. Teams that share tasks across departments or handle client-facing projects also benefit from this visual structure.
When to avoid them
For small projects with few tasks, a Gantt chart may add unnecessary complexity. Projects that change constantly or explore creative ideas may need a lighter tool. Using simpler methods saves time and allows teams to adapt without redrawing a chart.
This approach ensures teams use the right tool for the project's type and scale.
Core Components of Gantt Charts
A Gantt chart has several key components that make project planning and tracking easier. Each element provides a clear view of tasks, schedules, and progress, helping teams stay organized and accountable.
- Task list: Shows all project activities in detail, including small steps.
- Timeline: Displays days, weeks, or months across the chart, giving a sense of duration.
- Duration: Represents how long each task will take, usually shown as a horizontal bar.
- Resources: Lists team members, equipment, or tools assigned to each task.
- Dependencies: Connects tasks that rely on other work to finish first.
- Milestones: Marks important goals or deadlines to track progress.
- Today line: Indicates the current date on the chart.
- Progress: Shows completed portions of each task.
- Critical path: Highlights tasks that cannot be delayed without affecting the project.
- Baseline: Provides a reference of the original plan for comparison.
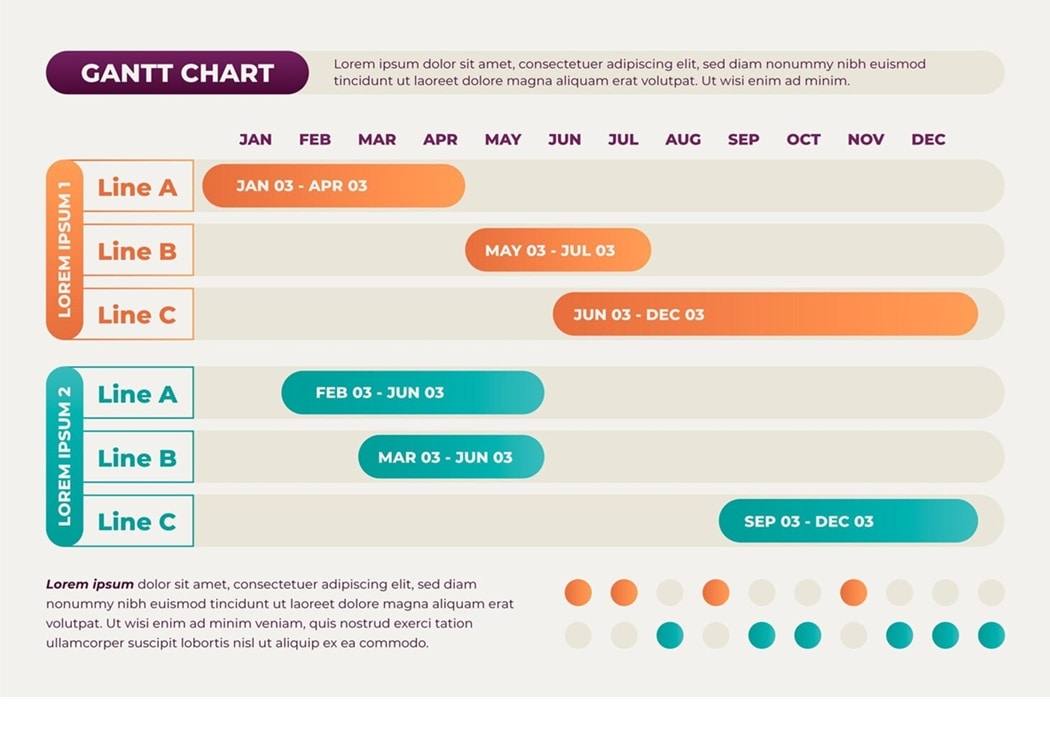
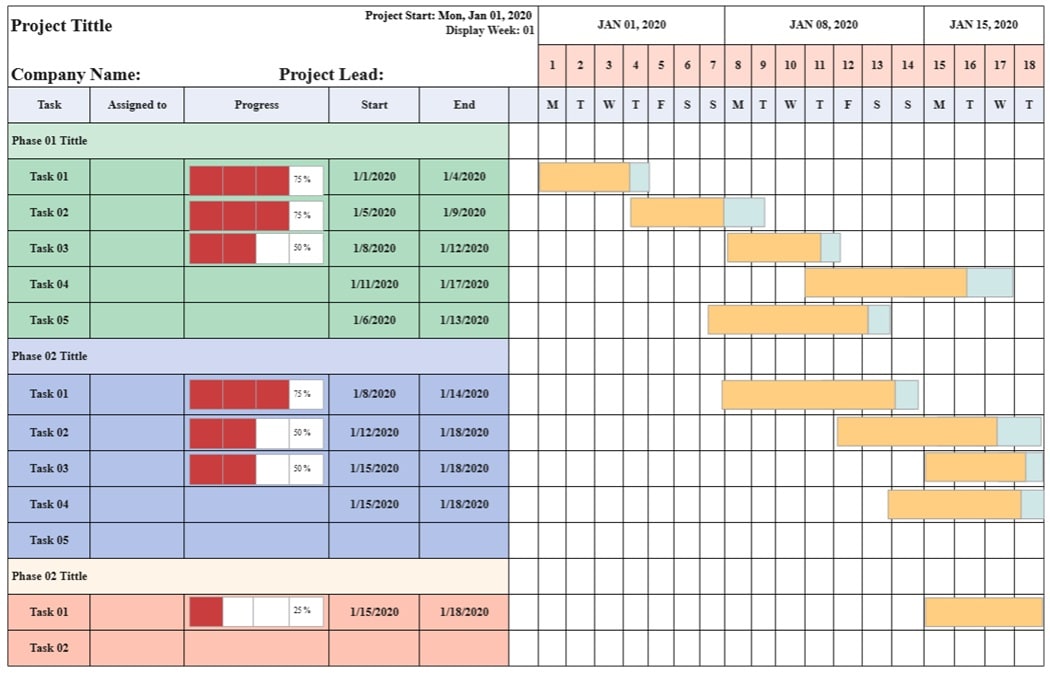
This Gantt chart demonstrates how core components work together. The task list divides the project into main activities. The timeline shows start and end dates for each task.
Duration is represented by horizontal bars, while overlapping bars highlight dependencies. Color-coded bars indicate responsible team members.
Milestones mark key points, and the progress of each task is clearly visible, showing how the critical path and baseline help monitor the schedule.
Gantt Chart vs Timeline
A Gantt chart and a timeline both show project tasks over time, but they serve different purposes. Here’s a quick comparison table:
| Feature | Gantt Chart | Timeline |
| Purpose | Tracks detailed project schedules, dependencies, and progress | Shows a simple sequence of events or milestones |
| Task Duration | Displays start and end dates for each task | Usually does not show the exact duration |
| Dependencies | Shows task dependencies and critical paths | Dependencies are not shown |
| Progress Tracking | Shows the completion status of each task | Rarely tracks progress |
| Resources | Can assign tasks to team members or tools | Typically does not include resources |
| Milestones | Marks important deadlines and goals | Mark's key dates or events |
| Complexity | Suitable for large or complex projects | Better for simple projects or overviews |
| Visuals | Horizontal bars with color coding for clarity | Simple lines or markers along a timeline |
| Editing | Editable in project management tools like EdrawMax | Usually static or basic visual |
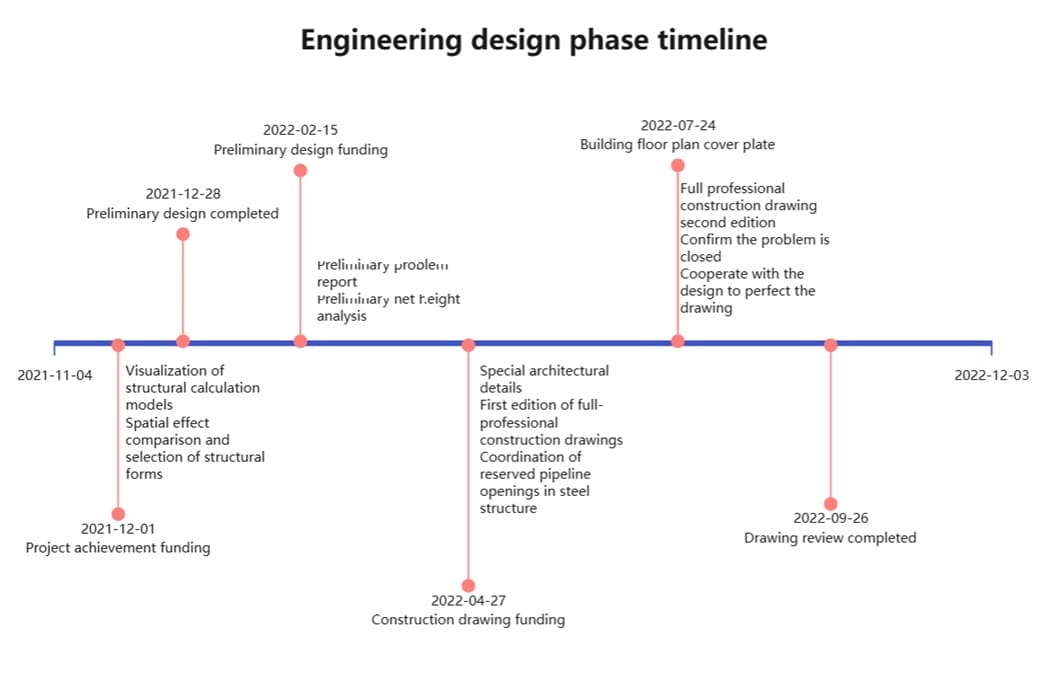
Here’s a sample timeline for reference.
It tracks an engineering design phase from November 4, 2021, to December 3, 2022. This overview shows how a simple timeline presents events without the detailed task dependencies of a Gantt chart.
Who Uses Gantt Charts
Gantt charts help teams organize projects and understand how tasks relate to schedules. Many industries use them to track work and assign responsibilities.
- Construction: Plans building activities and monitors progress.
- Architecture: Tracks design timelines and revisions.
- Marketing: Schedules campaigns and coordinates content.
- Digital agencies: Organize client projects and deadlines.
- Software development: Follows development tasks and testing.
- Event planning: Arranges activities, vendors, and timelines.
- Manufacturing: Monitors production stages and resources.
- Engineering: Visualizes project sequences and task connections.
Gantt charts allow teams to see which tasks are active and who is responsible. Teams can track work, update schedules, and prevent delays. The charts provide a visual guide that improves communication and helps keep projects on track.
Why Gantt Charts Matter in Project Management
Gantt charts help teams plan, track, and communicate project details. They provide a clear view of tasks, schedules, and progress. Here’s why they’re important for project management:
- Plan schedules: Teams can see the start and end dates for each task.
- Monitor progress: Completed and pending tasks are visible, making delays easy to spot.
- Communicate details: Tasks, deadlines, and dependencies are clear to everyone.
- Manage resources: Assign team members and tools to each task and track workload.
- Coordinate complex projects: Interconnected tasks can be managed without confusion.
Gantt charts are especially useful for projects with multiple teams or overlapping tasks. They offer more insight than a simple to-do list or Kanban board. Teams can adjust schedules, prevent conflicts, and keep work moving efficiently.
Examples of Gantt Charts
Gantt charts can be customized for different projects and industries. Using ready-made templates saves time and helps teams start planning immediately. Here are some examples taken from EdrawMax’s templates:
Example 1: Product Launch
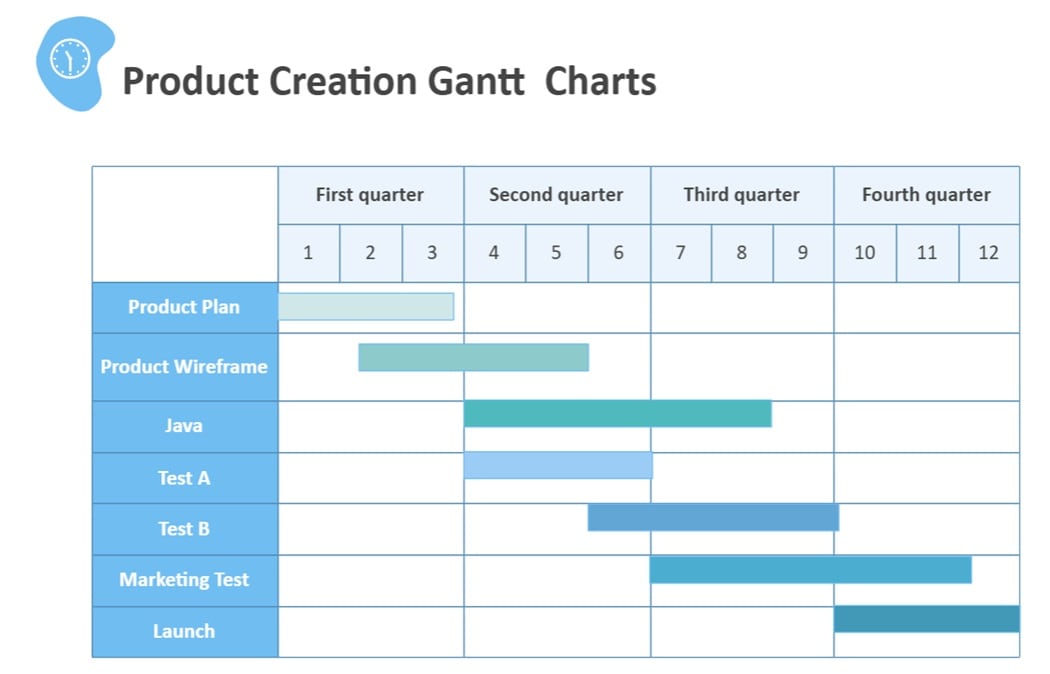
This Gantt chart tracks tasks for a new product launch. It includes market research, design, production, and marketing activities.
Each task has start and end dates, dependencies, and assigned team members. Milestones mark key deadlines. The chart helps teams coordinate work and ensure on-time delivery.
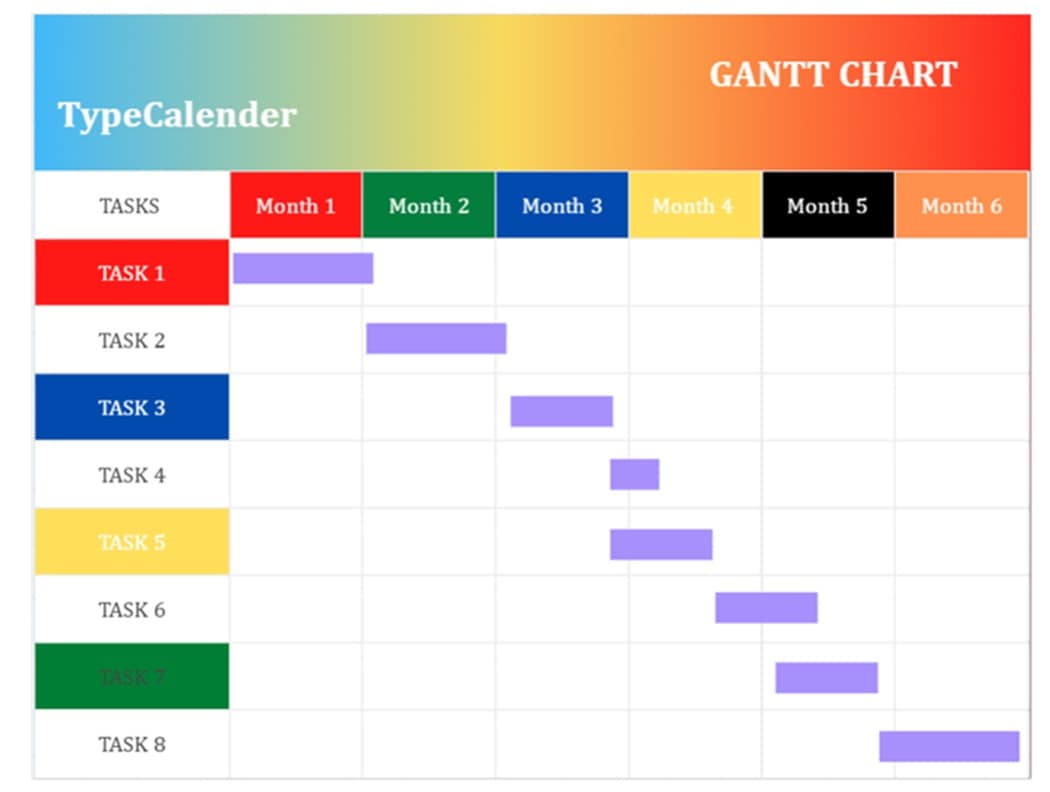
Example 2: Software Development

The chart shows development stages, including frontend, backend, testing, and deployment.
Task durations and dependencies are visualized with bars, and progress is tracked to spot delays early. Milestones highlight critical deadlines for releases.
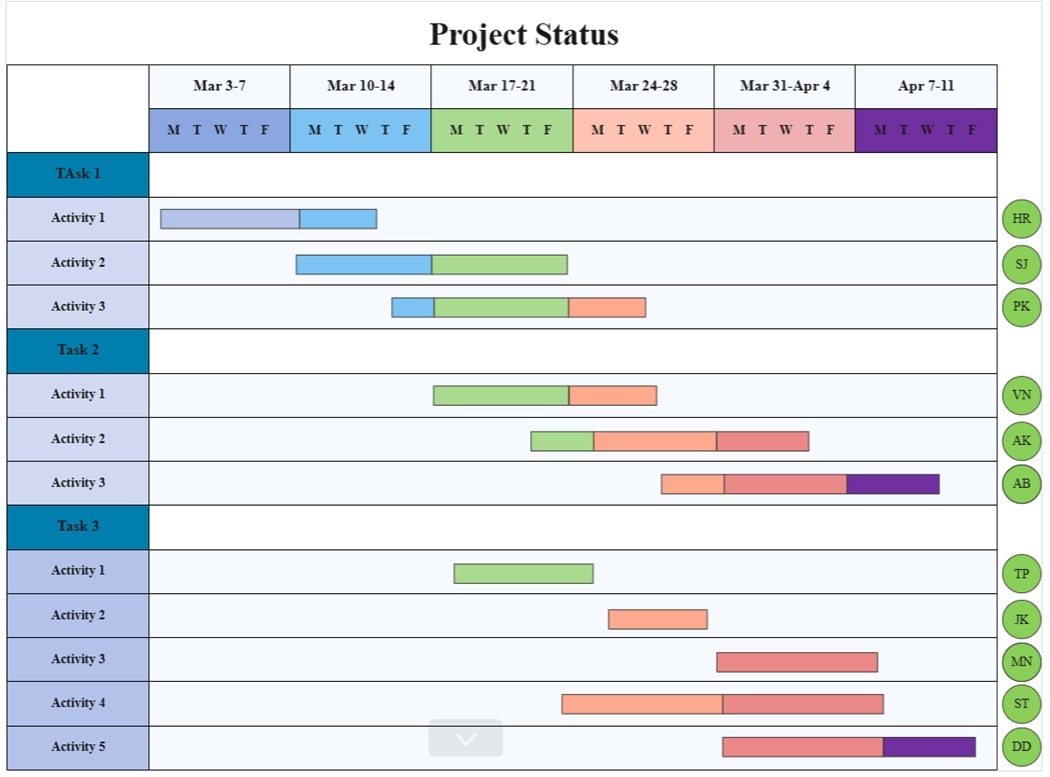
Example 3: Event Planning
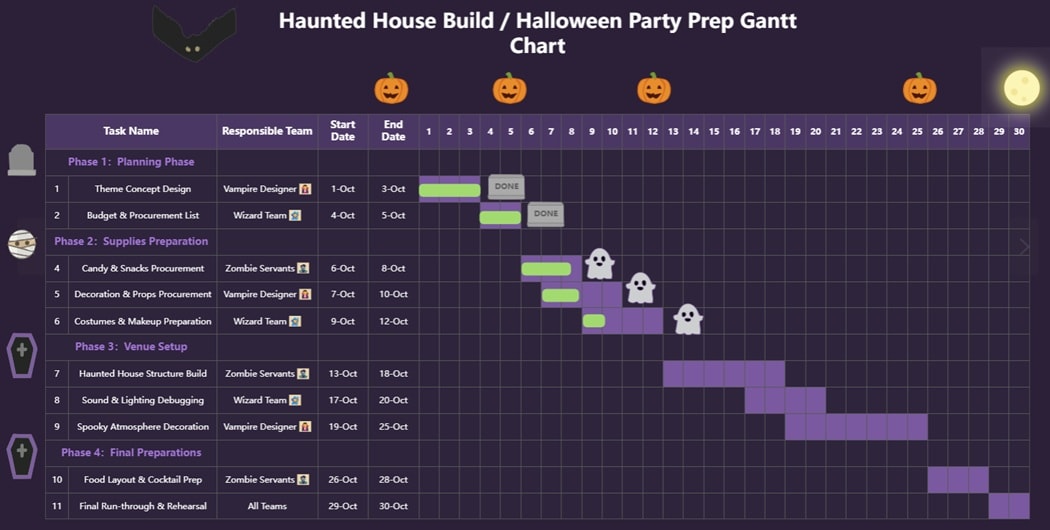
This Gantt chart organizes a Haunted House build and Halloween party preparation.
It breaks the project into phases, showing Planning, Supplies Preparation, Venue Setup, and Final Preparations. Tasks are scheduled with clear start and end dates, with dependencies highlighted.
Phase 1 includes theme design and budget planning. Phase 2 covers candy, props, and costumes. Phase 3 handles structure building, sound, and decoration. Phase 4 completes the food layout and final rehearsals.
Color-coded bars show overlapping activities, and milestones mark key deadlines.
More Gantt Chart Templates
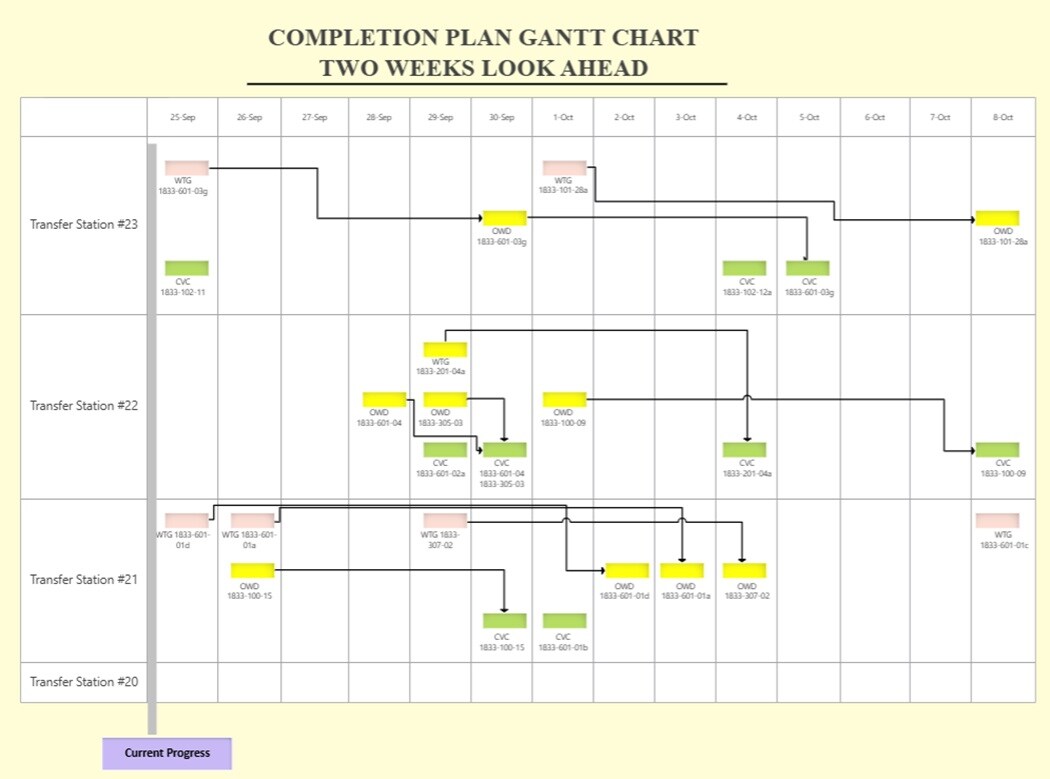
Here are more Gantt chart templates to help teams plan different projects. These examples can be customized with editable files, allowing tasks, timelines, and milestones to be adjusted for specific needs and schedules.
Beginner Gantt Chart Template

Simple Company Gantt Chart
Completion Plan Gantt Chart
How To Create a Gantt Chart With EdrawMax
EdrawMax lets you create professional Gantt charts quickly with templates and editable tools. This Gantt chart maker allows you to track tasks, timelines, milestones, and resources in one place. Follow the steps below:
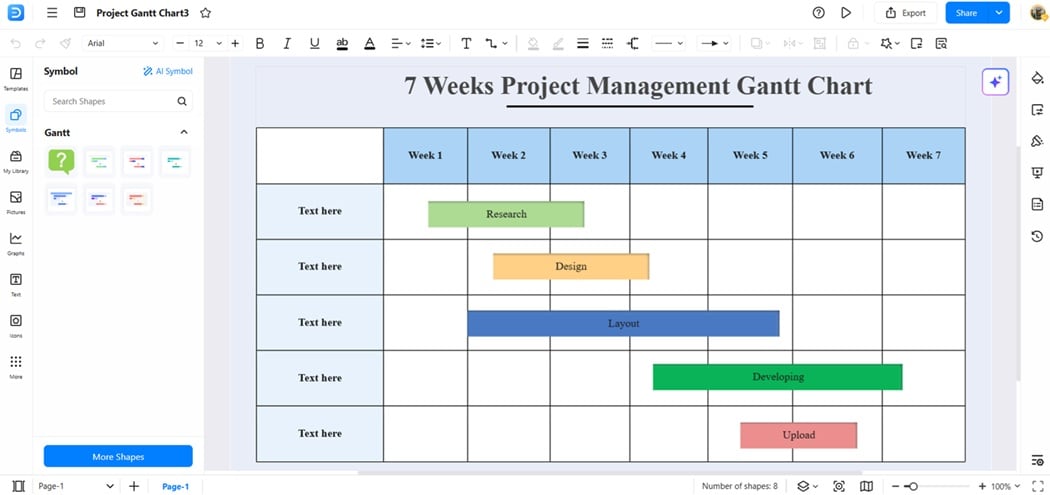
Step1 Open EdrawMax and Search for Gantt Chart Templates
- Open EdrawMax on your computer or go to EdrawMax online.
- Go to the template library and search for “Gantt chart.”

Step2 Select a Gantt Chart Template
- Choose a Gantt diagram that fits your project type: project tracking, event planning, software development, or marketing campaigns.
- When you find one that you like, duplicate it.
Step3 Customize Tasks and Dates
- Enter your project tasks in the task list.
- Set start and end dates for each task.
- Assign resources like team members, tools, or equipment.
- Drag task bars to adjust durations and visualize overlaps.

Step4 Add Dependencies, Milestones, and Progress
- Link tasks that depend on others to show the critical path.
- Add milestones to mark important deadlines.
- Update progress for each task to track completion.
- Use the today line to monitor ongoing activities.
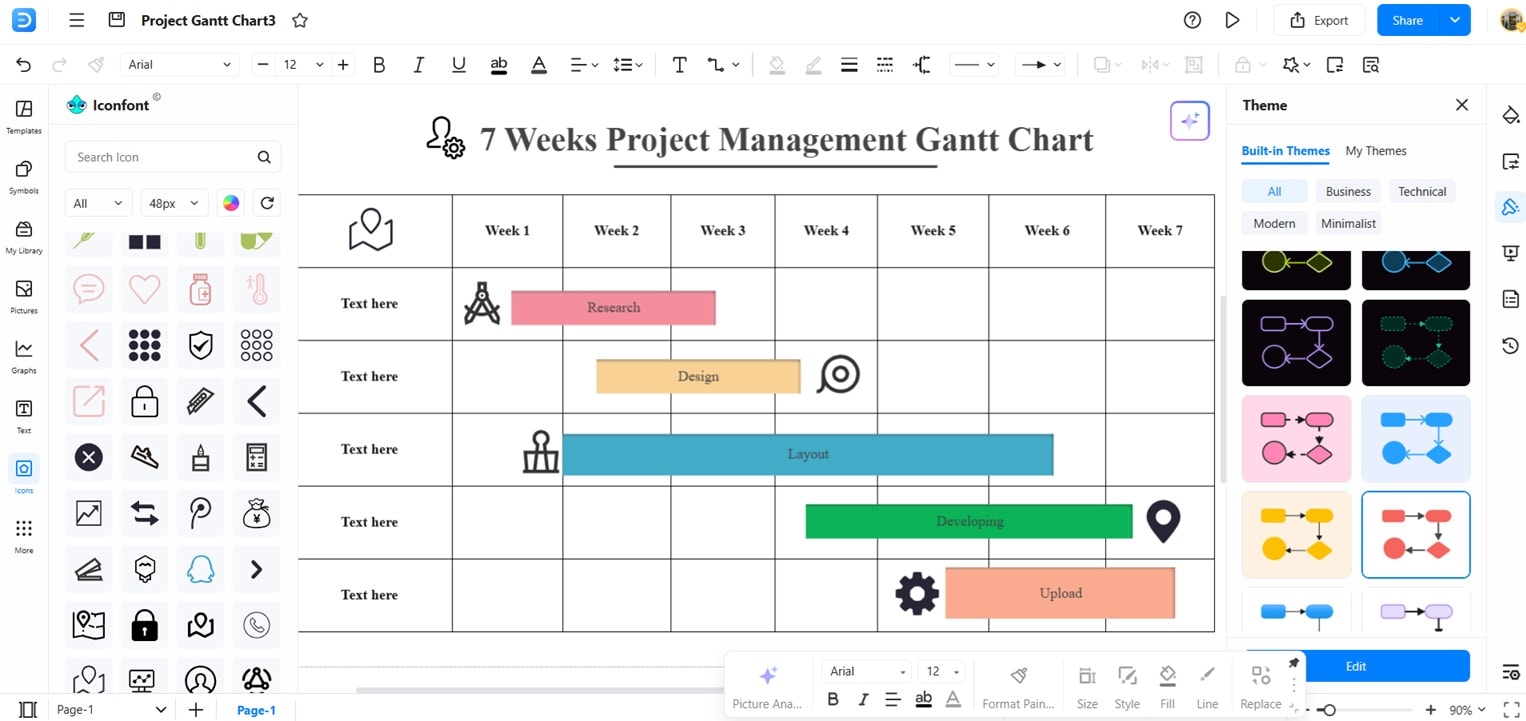
Step5 Style and Export Your Gantt Chart
- Change colors, styles, and layouts to match your project.
- Export your chart in PDF, PNG, JPG, or SVG formats.
- Editable files let you update tasks, timelines, and resources as the project evolves.
This workflow helps you create, track, and manage projects efficiently using EdrawMax.

Tips for Designing Effective Gantt Charts
A strong Gantt chart is easy to read and simple to update. These tips help you build a layout that supports smooth planning.
- Use clear task names so viewers can quickly understand each activity.
- Group related tasks into phases to keep the timeline organized.
- Add dependencies to show how tasks connect across the schedule.
- Use color coding to highlight responsibilities or task types.
- Mark milestones to emphasize important project checkpoints.
-
Is a Gantt chart helpful for beginners?
A Gantt chart is beginner-friendly because it presents project steps in a simple visual bar layout. New users can understand timelines faster. You learn how tasks connect, making early project planning easier to follow. -
Can a Gantt chart help prevent delays?
A Gantt chart helps spot delays early by showing progress against planned dates. Teams can see slow areas, shift workload, and update schedules. This reduces confusion and helps maintain steady movement toward project completion. -
What software can create a Gantt chart easily?
EdrawMax is a strong choice for many. It offers templates, drag-and-drop editing, and smooth customization. You can build professional Gantt charts online or offline with flexible file-sharing options. -
Can a Gantt chart show multiple teams in one plan?
A Gantt chart can display several teams through color labels, grouped tasks, or organized sections. This helps everyone see responsibilities and understand overlaps. Gantt charts can track how each part contributes to the project structure.
AI Diagram Generator
Enter your prompt. Upload files if needed. Generate diagrams, charts, or slides instantly.


