


Too much detail is often hidden in high-level diagrams. By only viewing the big picture, development teams and stakeholders may overlook important portions. Close-ups make all of us know how a container functions internally.
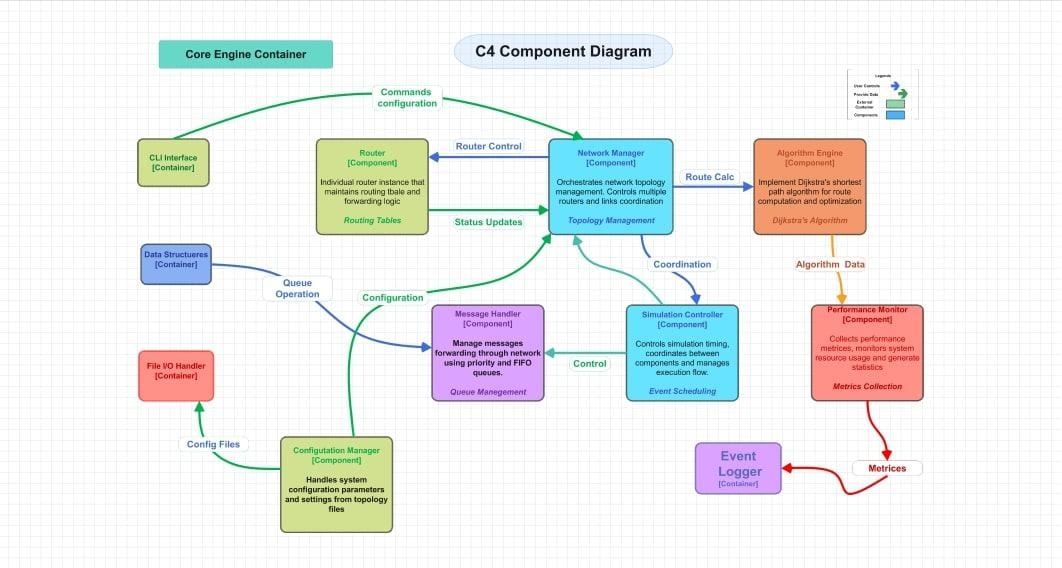
The third level of the C4 model is the C4 component diagram. The C4 model is context to container to component to code diagram. It visualizes the inside of one container, including its modules, services, or APIs.
In this article, you will get to know what a component diagram is, its fundamental ideas, the use of clear symbols, its applications, and the exact steps to create one in EdrawMax.
In this article
What is a C4 Component Diagram?
A C4 component diagram shows the inside of one container. It breaks the container into parts like modules, services, and APIs. It helps teams see how internal pieces interact without showing every line of code.
In the C4 model, it sits at level 3:
- Context (level 1)
- Container (level 2)
- Component (level 3)
- Code (level 4)
That means it gives a middle view — more detail than containers, but less than code. This view is very useful in real projects for planning, designing, and maintaining architecture.
A component diagram breaks down a container to explain the components contained within it, their duties, and implementation details. It also shows how those components depend on one another, what external systems they connect to, and which interfaces or APIs they expose.
Core Concepts of C4 Component Diagrams
A C4 component diagram represents details within a single container. It accentuates the manner in which pieces (components) interact within that container. It also demonstrates which external systems or individuals those components communicate with. This perspective lies at the intersection of container- and code-level perspectives in the C4 hierarchy.
Let's look into the main parts of a C4 component diagram:
- Components
These are working units within a container (modules, services, APIs). They perform certain tasks such as processing orders, authentication, and so on. - Interfaces / APIs
Interfaces where components are exposed to or invoke functionality. They enable components to interact or to be connected to foreign systems. - External Dependencies
Databases, third-party libraries, or services consumed by components. These are not contained in the container but are important in the functionality of the container. - User / Actor Elements
Sometimes components are directly involved with users or actors, e.g., a component providing user input or output. These are shown when needed.
Symbols and Notations
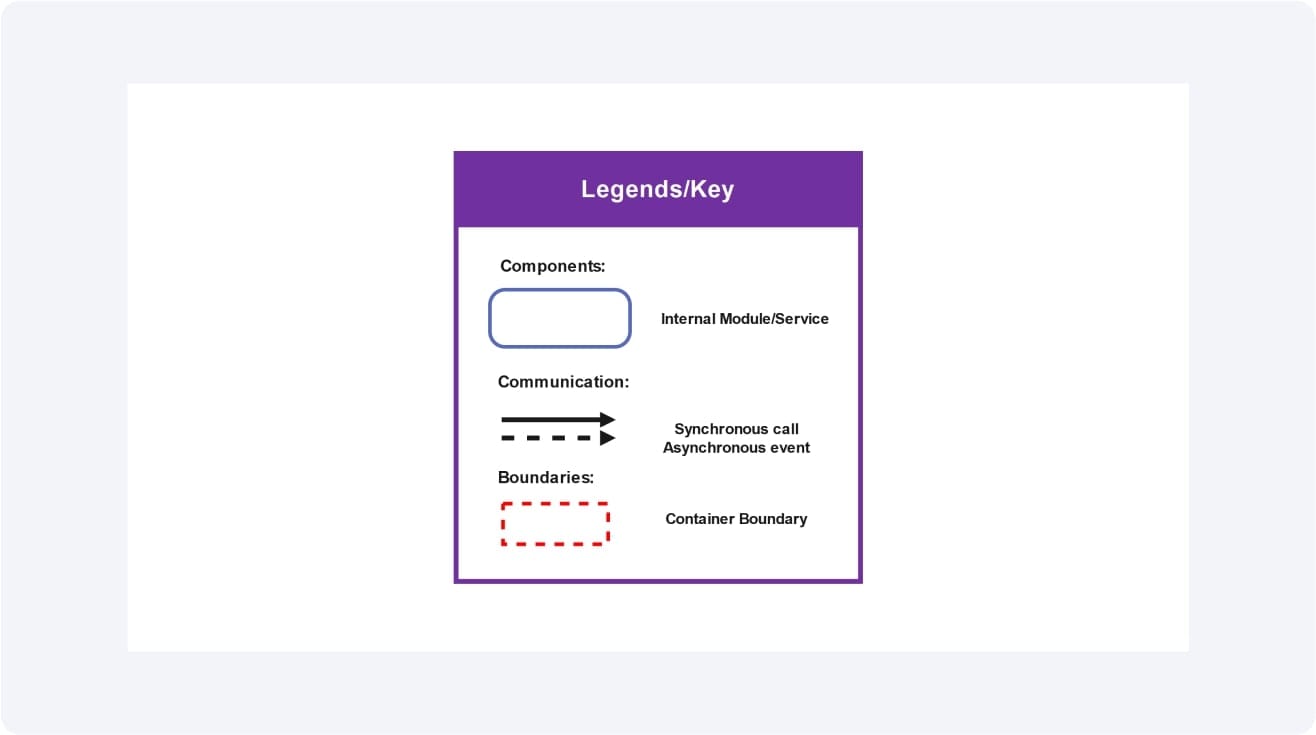
The use of symbols and notations transforms a C4 component diagram into a common language. The C4 model does not impose a rigid shape; however, it suggests clear and consistent visuals (boxes, arrows, boundaries) in such a way that even an overview of a diagram can be easily interpreted without the need to read the long explanation attached to the diagram. An effective notation consists of legends, labels, and identifiable components.
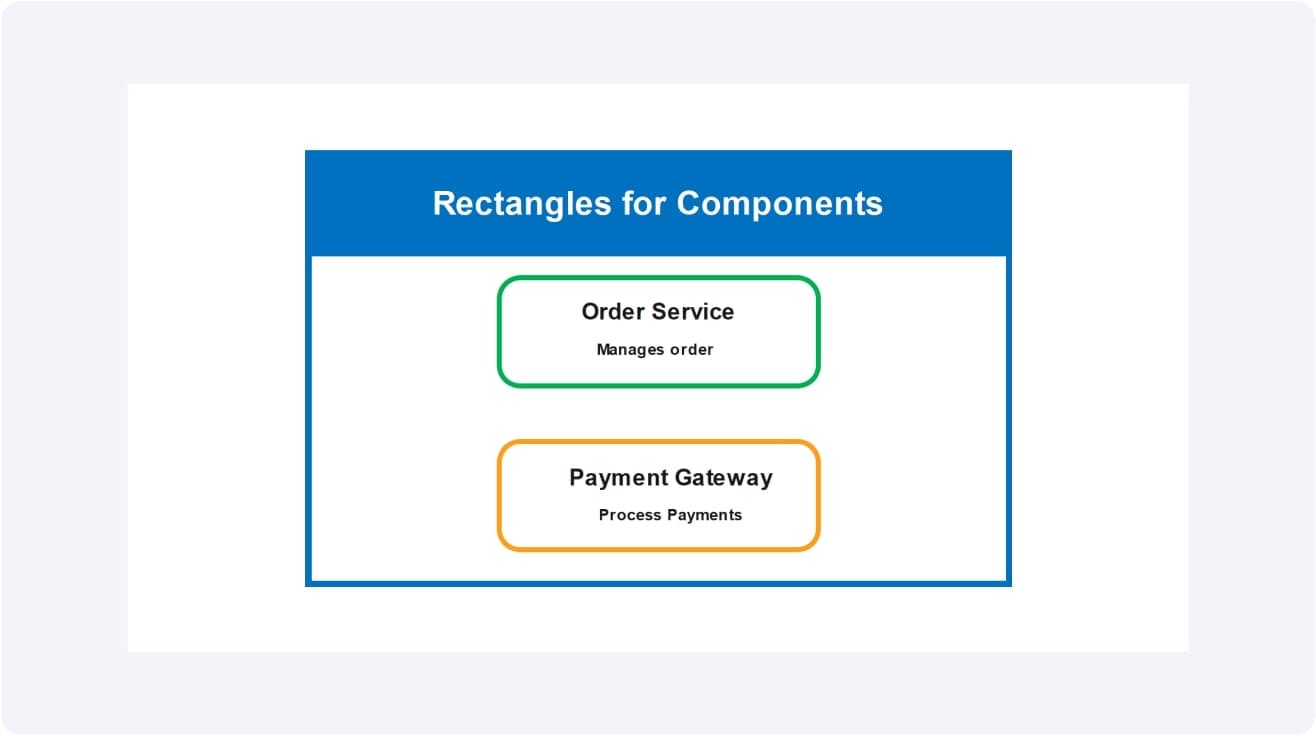
1. Rectangles for Components
Components stored in a container should be used in simple boxes. Assign them titles such as name + short responsibility. E.g., Order Service, Auth Module.
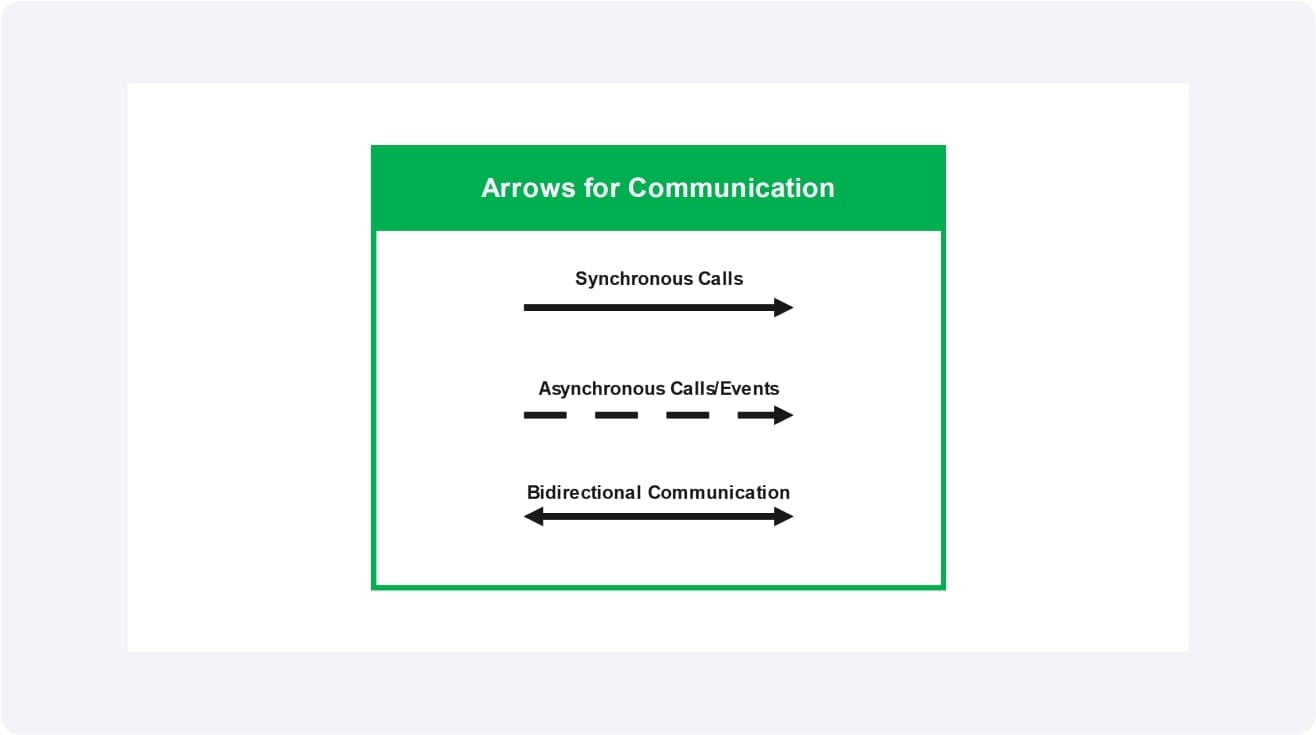
2. Arrows for Communication or Dependencies
Draw arrows to represent component dialogue. Label arrows clearly. Synchronous calls are done under solid lines, asynchronous or events are done under dashed lines.
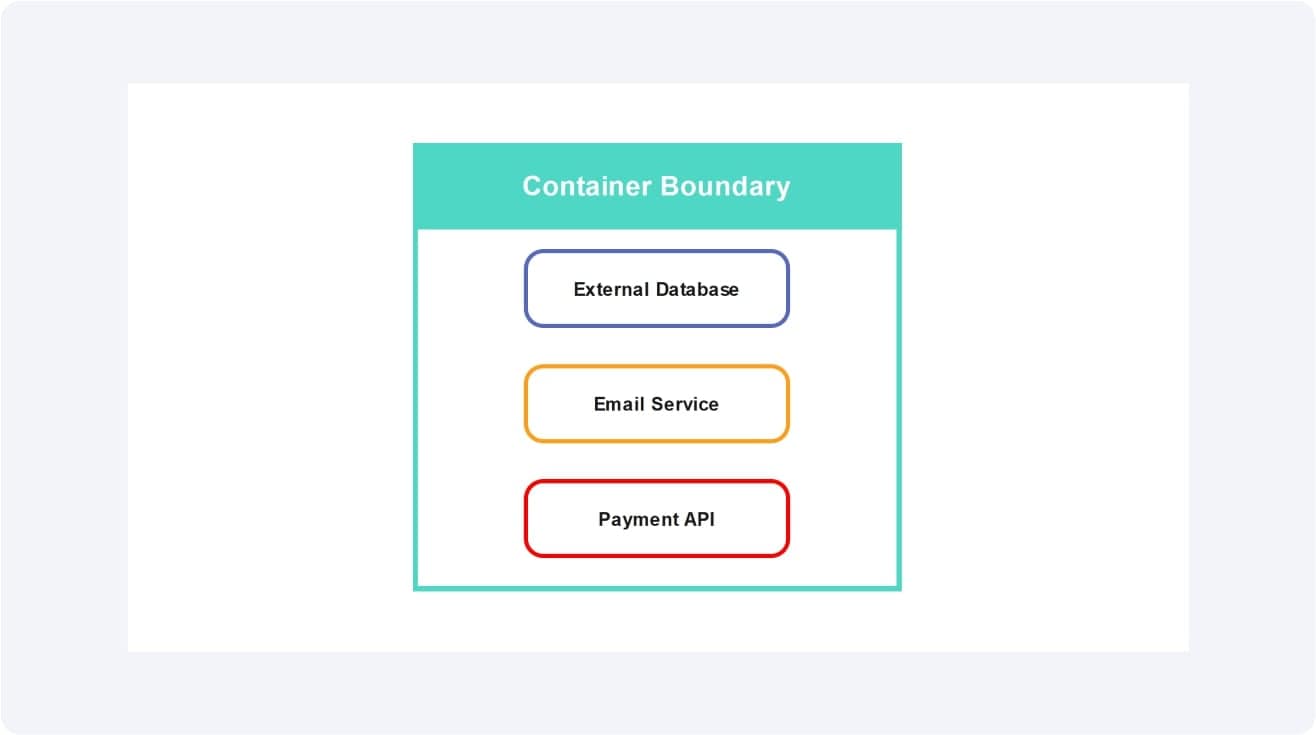
3. Container Boundary
A border is drawn around a set of components in a container. This displays what is inside vs. outside.
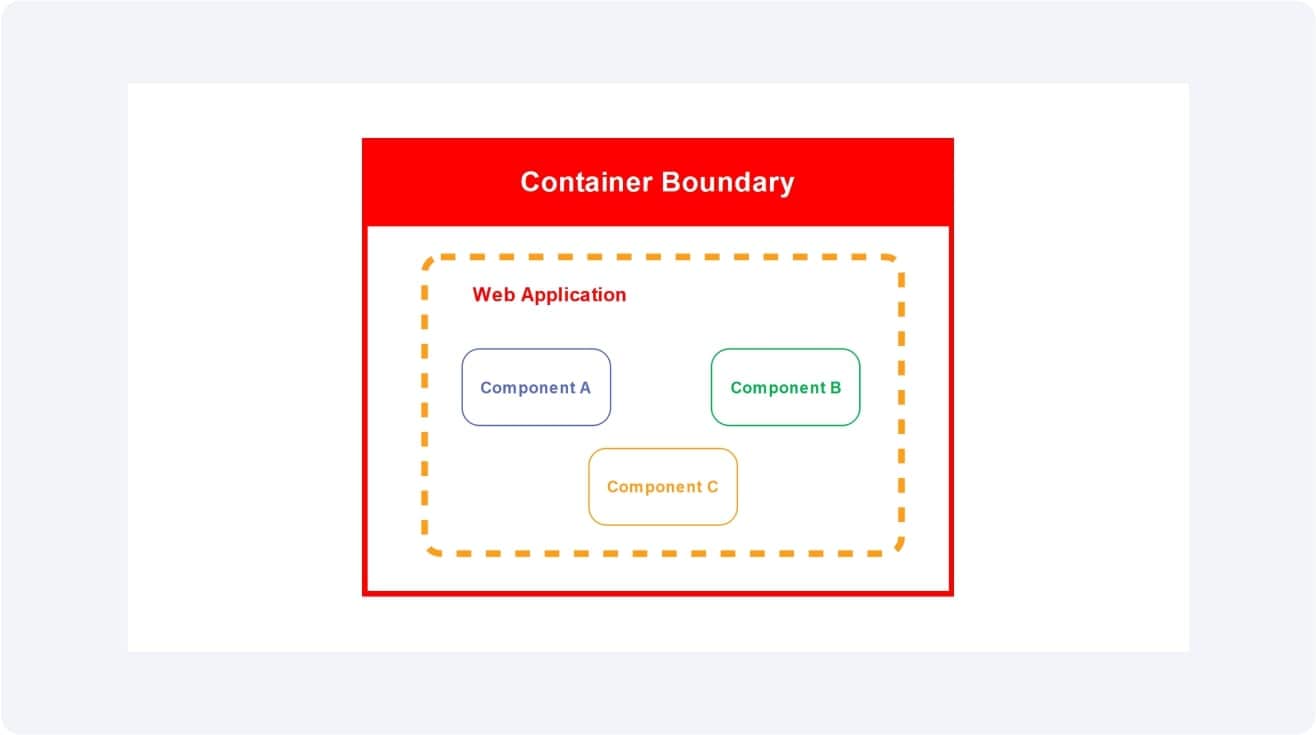
4. External Elements Outside Boundaries
Other systems, services, or databases must be located outside the container boundary. Connect them with arrows.
5. Legend / Key
Place a key beside shapes, styles of line, and types of arrows. Aids any person perusing the diagram.
Depending on these notations, your C4 component diagrams will be transparent, uniform, and shareable with teams.
Applications of C4 Component Diagrams
C4 component diagrams assist teams in visualizing the inner processes of the software. They can be applied in design, communication, and maintenance. These C4 component diagrams may be used to assist in:
- In agile documentation:
They are live diagrams. The diagram is updated as code changes. This maintains the records as up to date. - Bringing on new developers:
New developers can get on board more quickly when they observe how components within a container interact and or rely on one another. - Microservices design:
Assists in mapping every service, interface, and API. Finds the boundaries and dependencies. - Design reviews and planning:
Teams can identify weaknesses, such as tightly coupled components, by looking at these diagrams prior to writing code. - Compliance, security, and audits:
External connections and dependencies are displayed in diagrams. That assists in making sure that external libraries or services are secure and responsible.
C4 component diagrams simplify complex systems. They mediate high-level and code. It is easy to create and share these diagrams with EdrawMax.
How to Create a C4 Component Diagram in EdrawMax
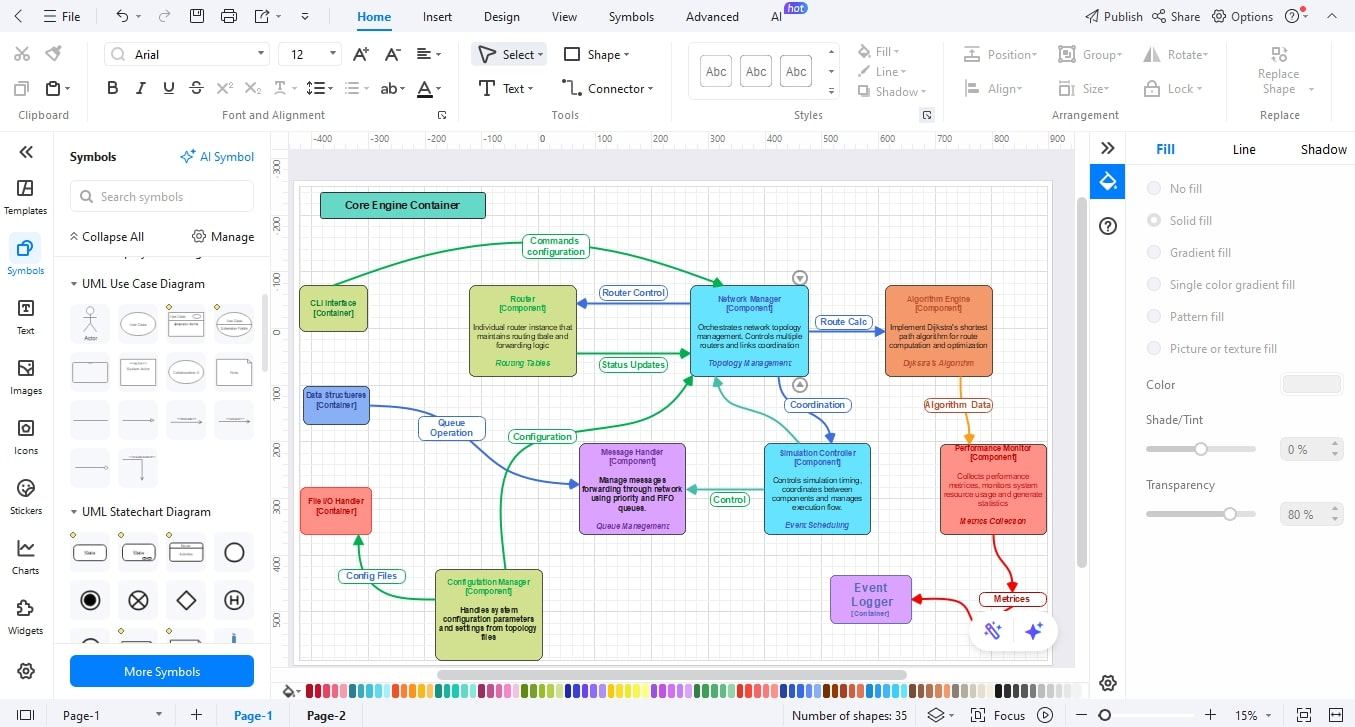
When creating software, it is essential to understand how the components within a system operate. A C4 component diagram allows you to zoom in on a container. You can see the modules or services within, how they relate to each other, and what is dependent on what. This perspective fills the gap between the big picture and the code-level.
With EdrawMax, it is simple to draw component diagrams. You will work with built-in libraries of shapes, label things, draw arrows, and establish limits. All of this is useful to help you map features, interfaces, and dependencies in such a manner that the architecture is physically practiced by all developers and all stakeholders.
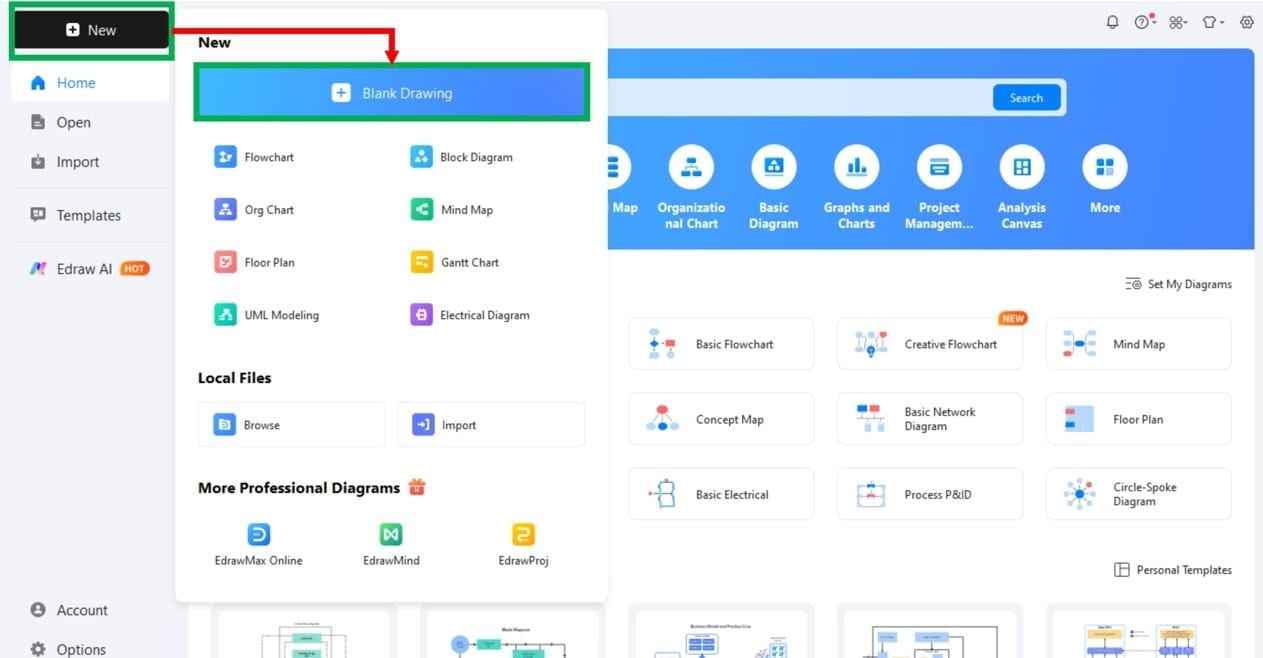
Step1 Select EdrawMax and Start a New Diagram.
- Launch EdrawMax.
- Click New to begin drawing your diagram.
- To open a blank canvas, choose a UML Modelling or Blank Drawing.
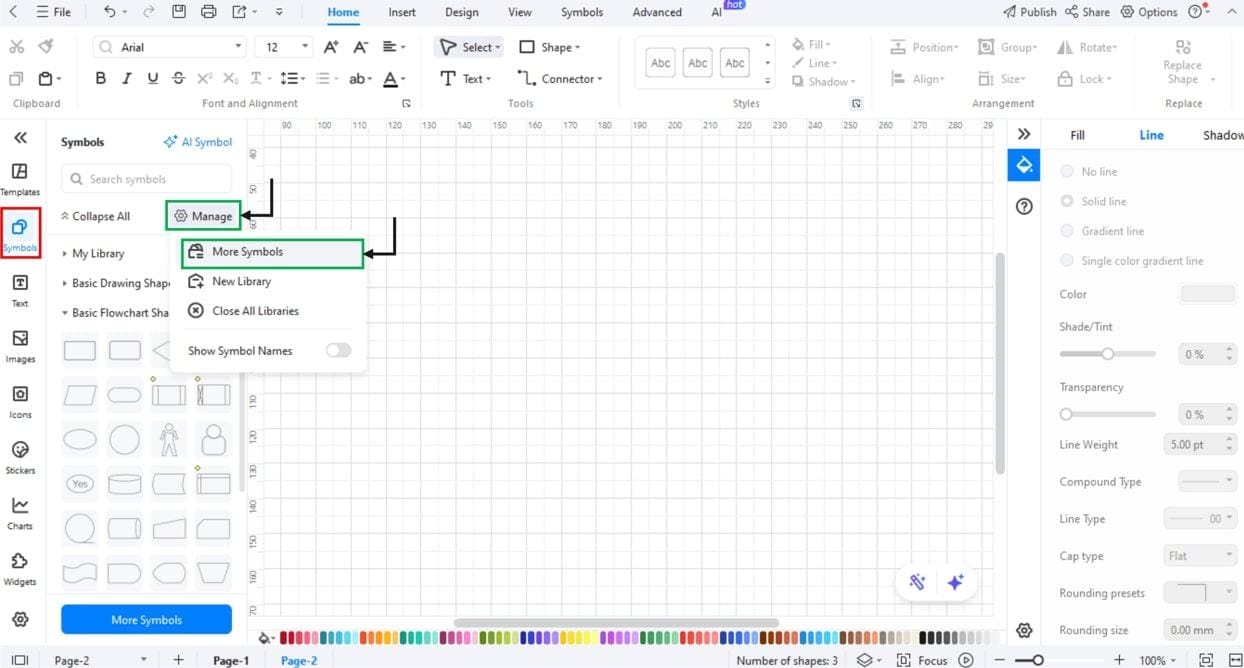
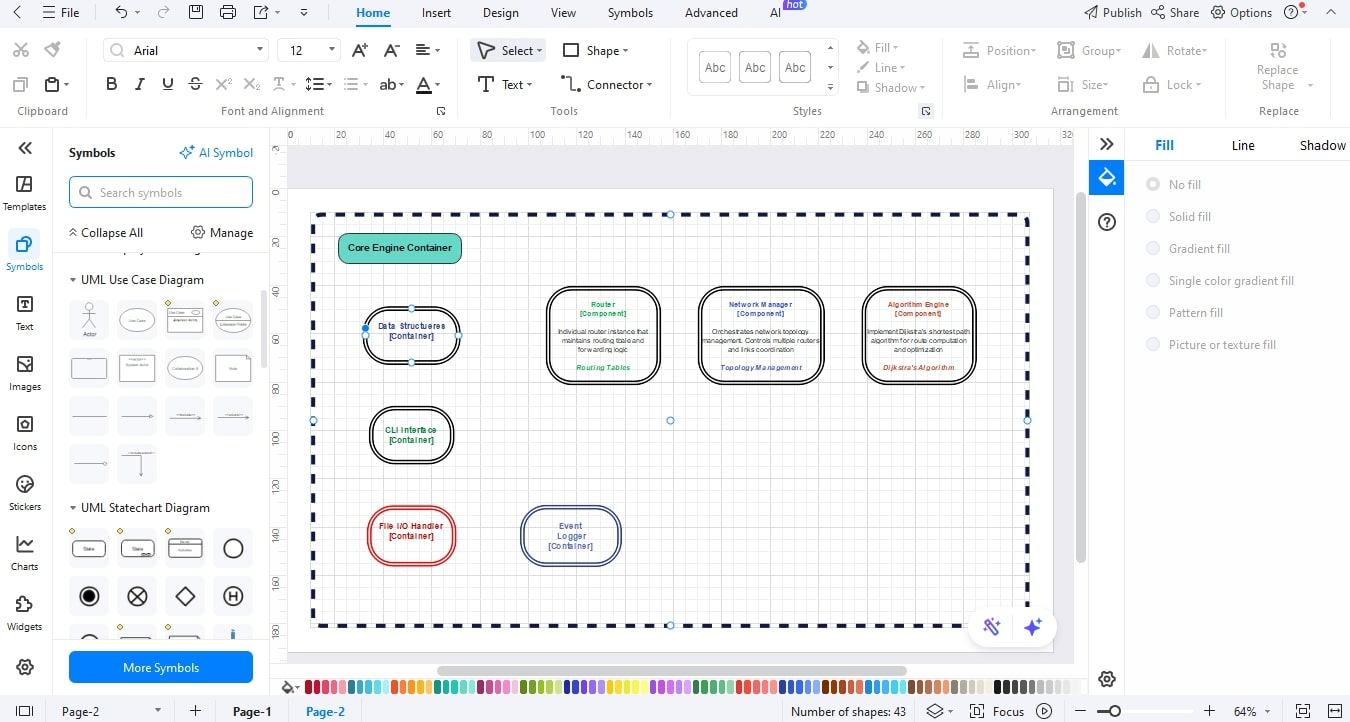
Step2 Setting up the Symbol Library.
- On the left of the canvas, click Symbols / Manage Symbols.
- Turn on the UML Component library.
- Load icons for components, interfaces, and boundaries.
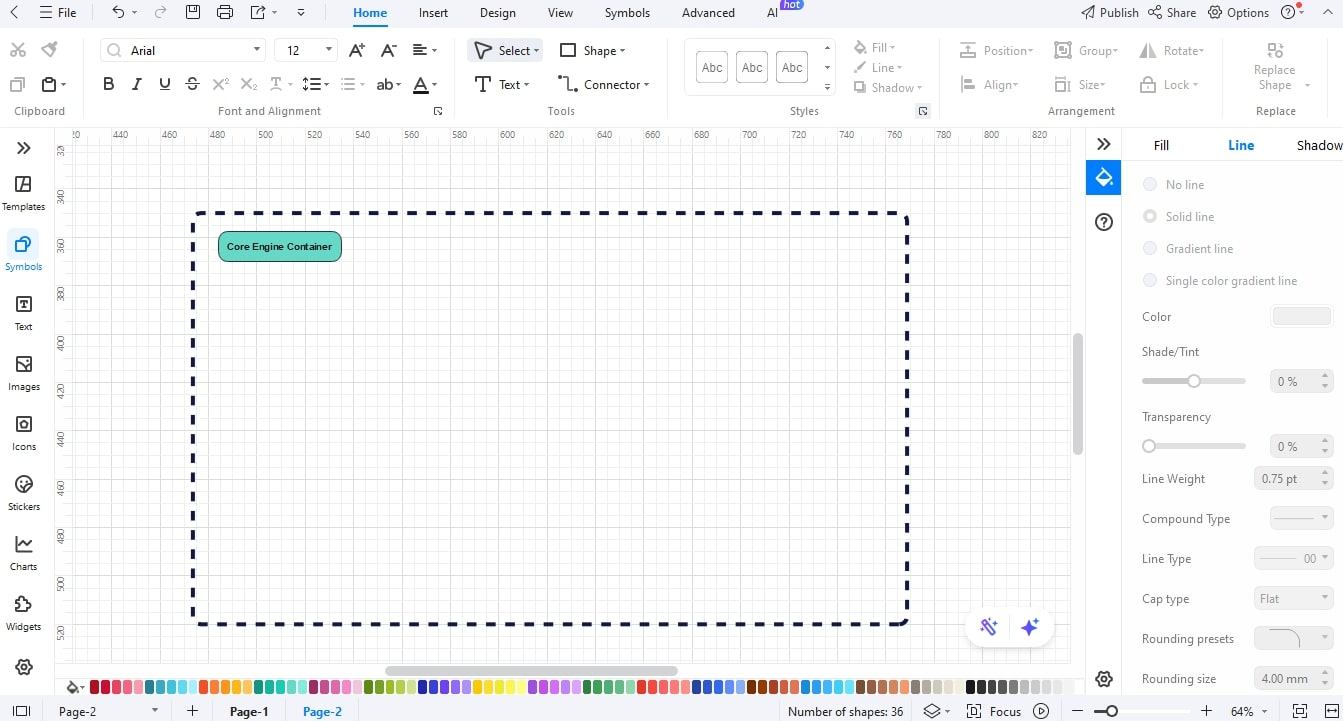
Step3 Create the Container Boundary.
- Use a big box when depicting the container.
- Name it (e.g., “Web Application Container).
- Include a little description for the container.
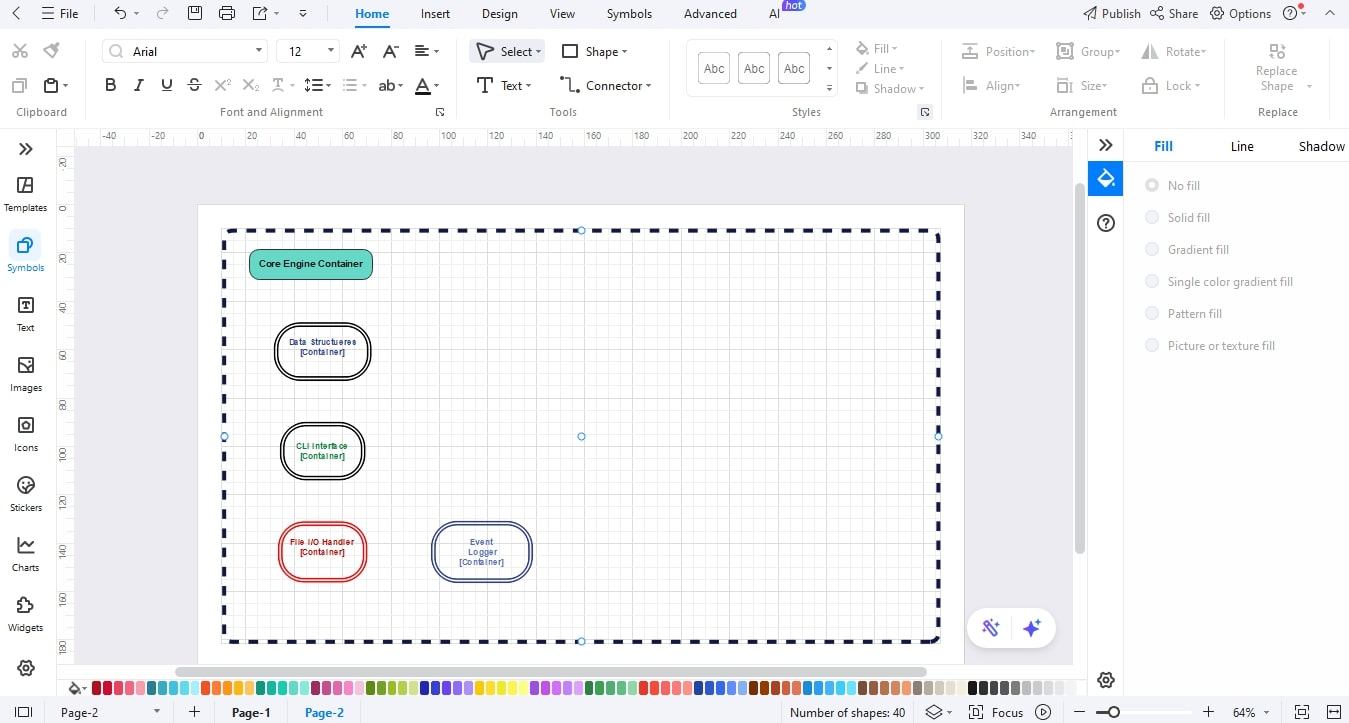
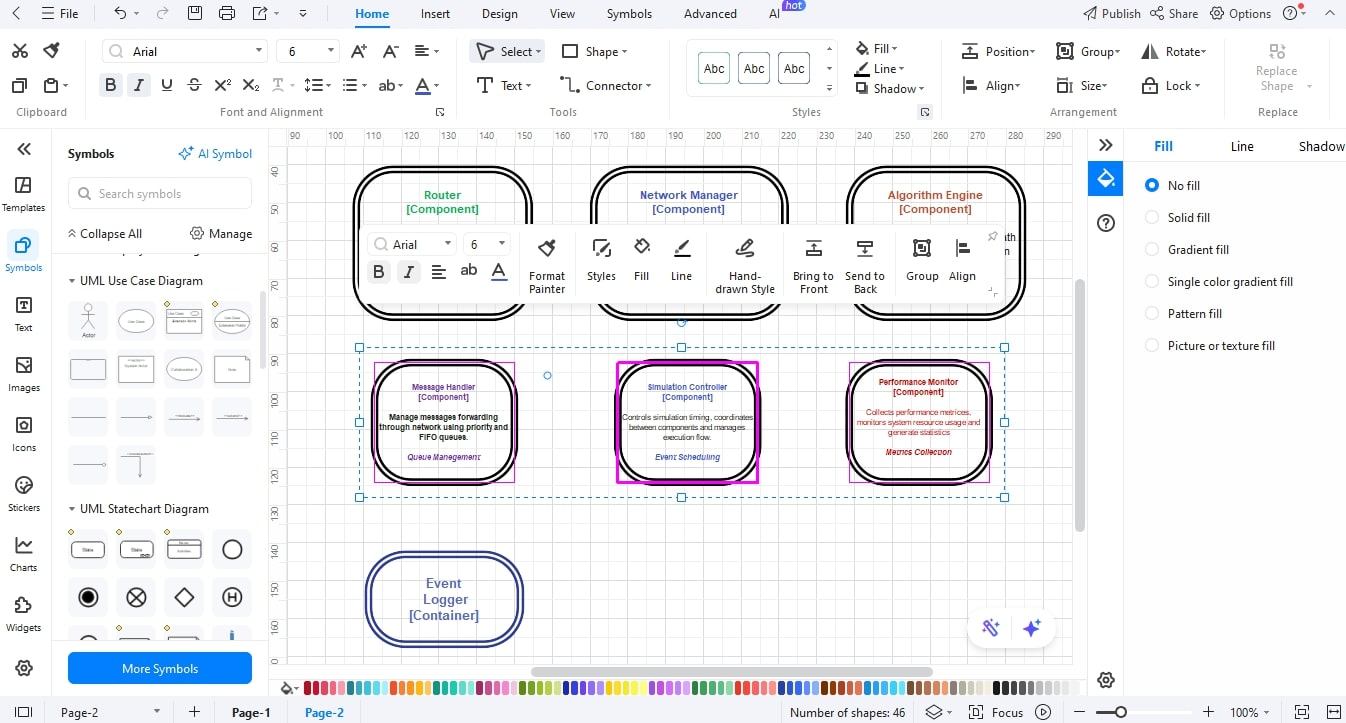
Step4 Insert the Components into the Container.
- Drag component rectangles in the container box.
- Name each of its components (e.g., Auth Service, Order API, Payment Module).
- Write brief descriptions of what each element does.
Step5 Add the Interfaces / API points.
- To accessible components, add interface symbols or connector minipushes.
- Clearly label interface (e.g., GraphQL, REST API).
- Locate them near the parent component.
Step6 Add External Dependencies.
- Place external systems (e.g., Database, Third-Party Service) outside of the container boundary.
- Express dependence using arrows from components that depend on them.
Step7 Link Relationships / Flows with Components.
- The arrow relates to internal components.
- For indirect or synchronous calls, use solid lines.
- Make it a dashed line in the case of asynchronous occurrence or communication.
- Name all arrows (i.e., Auth check, Submit Order).
Step8 Revise and Export Diagram
- Stick to similar colors, fonts, and line styles.
- Add a legend/key when there are variably used symbols or arrow types.
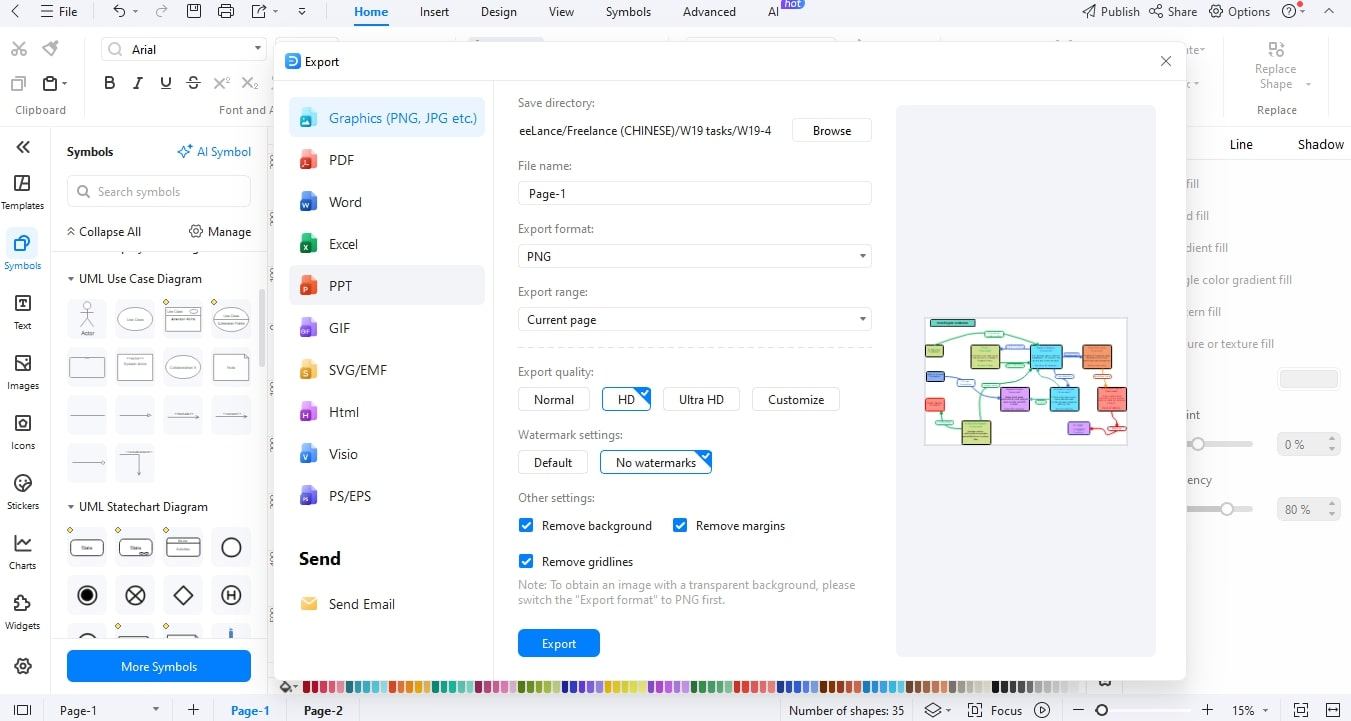
By the end, you will have a pretty component-level view of your system. EdrawMax simplifies it: name, organize, connect, and share your diagram does not require much effort. Give it a go and watch your architecture come to life.
Conclusion
A C4 component diagram provides the teams with a clear middle view of system architecture. There is a gap between high-level design and code detail. It helps you to know the roles of components, dependencies, and the interaction between pieces within a container. This clarity enhances the planning process, minimizes miscommunication, and prevents huge surprises in the future of development.
EdrawMax eases the process of drawing them using drag and drop elements, templates, and export options. You will use more time to think over the design than to fight the tools. Today, try to create your own C4 component diagram using EdrawMax. It is a clever way to make architecture visible and shared.
AI Diagram Generator
Enter your prompt. Upload files if needed. Generate diagrams, charts, or slides instantly.


