


Top-level software diagrams tend to give only the big picture. They chart systems, external users, and general dependencies. Good decisions, however, require more detail in teams. This is why the C4 container diagram is important. It simply magnifies within a system to reveal the principal containers and their interactions.
The second level is the container level in the C4 model (Context → Container → Component → Code ). It shows apps, databases, and services used and technologies. A container diagram helps the architects, developers, and stakeholders to have a clear picture of the structure. You will find out what a container diagram is, what its symbols are, its applications, and how to draw a container diagram using EdrawMax in a proper way.
In this article
What is a C4 Container Diagram?
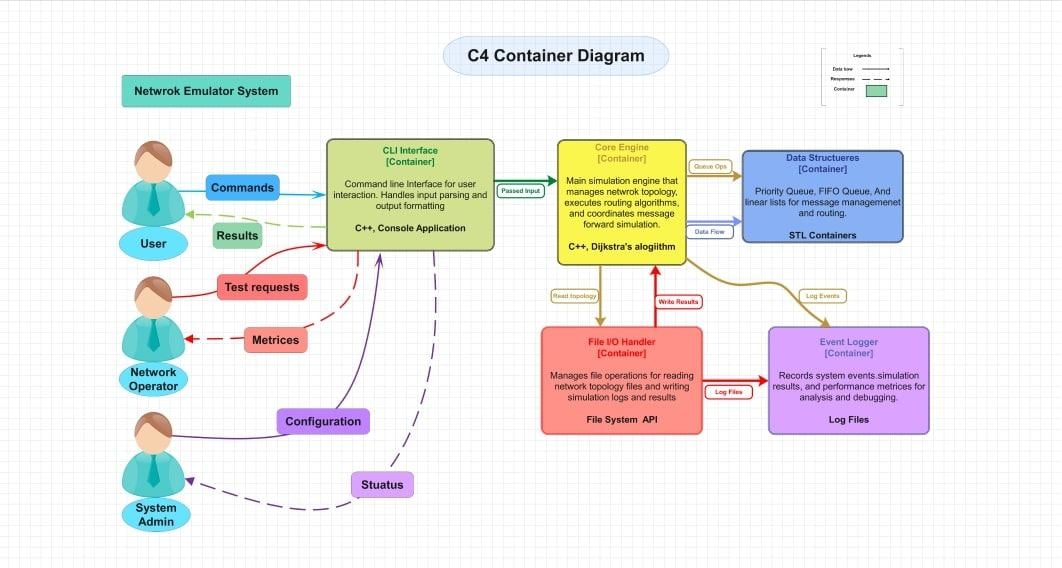
A C4 container diagram displays the high-level architecture of a software system. It sits at level 2 in the C4 model. This diagram zooms into the system and displays containers, apps, databases, and services, and how they interact with each other. It does not get into internal elements such as code or classes.
Every container is a boundary or runtime. They may be a web application, a mobile application, a backend API, or a database. The container diagram presents what each container is and its responsibilities. And how containers interact with each other through APIs, messaging, or direct calls. It assists teams in understanding the flow of data between containers and their exterior systems.
Technology selections are also evident at the container level: what language, framework, type of database, or service is in each container. It is particularly useful in the case of operations, architecture planning, and compatibility across environments.
It is best used when there is a coordination of efforts among developers, the operations team, and non-technical individuals, because it is not so detailed that it burdens them.
Basic Concepts of C4 Container Diagrams
A C4 container diagram displays the form of a software system on the container level. It is a zoom in on the context view. It emphasizes what containers (apps, databases, services) are available and what external systems the system communicates with. It also explains what each container is doing and what technologies are utilized within each container.
These are its key building blocks:
Containers
These are logical or physical execution environments. They are web applications, API services, databases, mobile applications, or microservices. A system has each container with certain responsibilities.
External Systems
Systems that are not within your scope that interact with your containers. Examples: third-party APIs, external databases, and payment gateways. They are of assistance, not under your control.
Responsibilities
What each container is supposed to do. A container may deal with the user interface, another deal with data storage, another deal with business logic. Boundaries and roles are determined by responsibilities.
Technologies
The structures, languages, or persistence tools that each container is based on. Examples: React, Node.js, SQL/NoSQL databases, message brokers. Technological awareness assists in deployment and operations planning.
The Symbols of C4 Container Diagrams
All C4 container diagrams have simple symbols, making people understand containers and their relationships without excessive text. You will have containers, flow arrows, and system boundaries. Some labels inform about what each container does and on what tech. A legend or key is used to make all the elements understandable at a glance.
These are the conventional notations and shapes:
- Container Boxes
Box format consisting of title (container name), responsibility, and technology. - Icons or Symbols of External Systems
These are on the outside of the system, and lines indicate interaction. - Lines/Arrows
Unidirectional flow/dependency arrows. Name them (e.g., REST API, Reads, Writes). - System Boundary
A boundary or big box that contains containers and indicates what is within the system. - Legend/Key
A legend/key should also be provided on every diagram indicating the type of arrow, shape, and abbreviations. - Titles
A title that indicates what system or what scope the diagram depicts (e.g., “Container Diagram for Order System”).
Software architecture diagrams create consistency and trust using symbols. Transparent container boxes, labeled flows, and clear boundaries do not allow misinterpretation. They assist non-technical and technical users in logic without trial and error.
Proper notations will make your C4 container diagram understandable to your team. Maintain labels, legends, arrow types, and limits. That causes diagrams not only to be pretty, but also useful.
How to Draw a C4 Container Diagram
It is easy to create a C4 container diagram when you work with EdrawMax. The tool itself gives you flexible editing and ready-made shapes, such that you can portray containers, relationships, and technologies without fuss. Through a systematic procedure, you will be depicting the structure of your system as a visual conception that is simple to subscribe to, evenly spread, and uphold.
Step1 Start a New Diagram
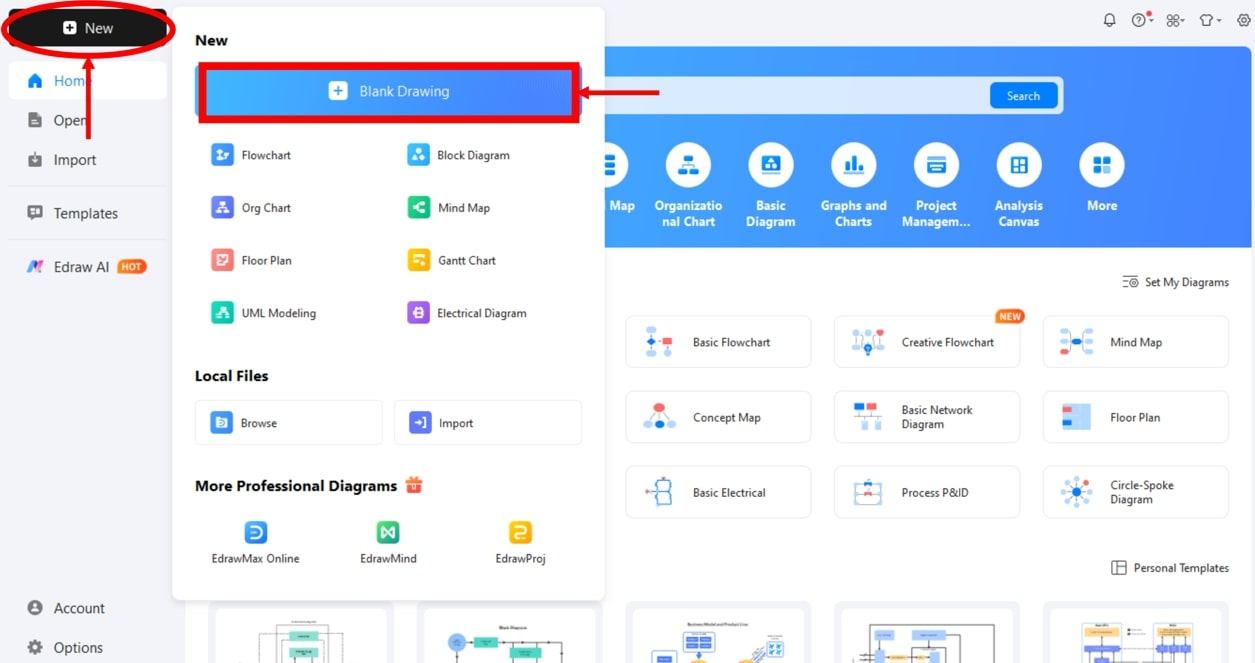
- Launch EdrawMax.
- Click New to begin drawing your diagram.
- To open a blank canvas, choose a UML Modelling or Blank Drawing.
Step2 Enable the C4 Shape Library
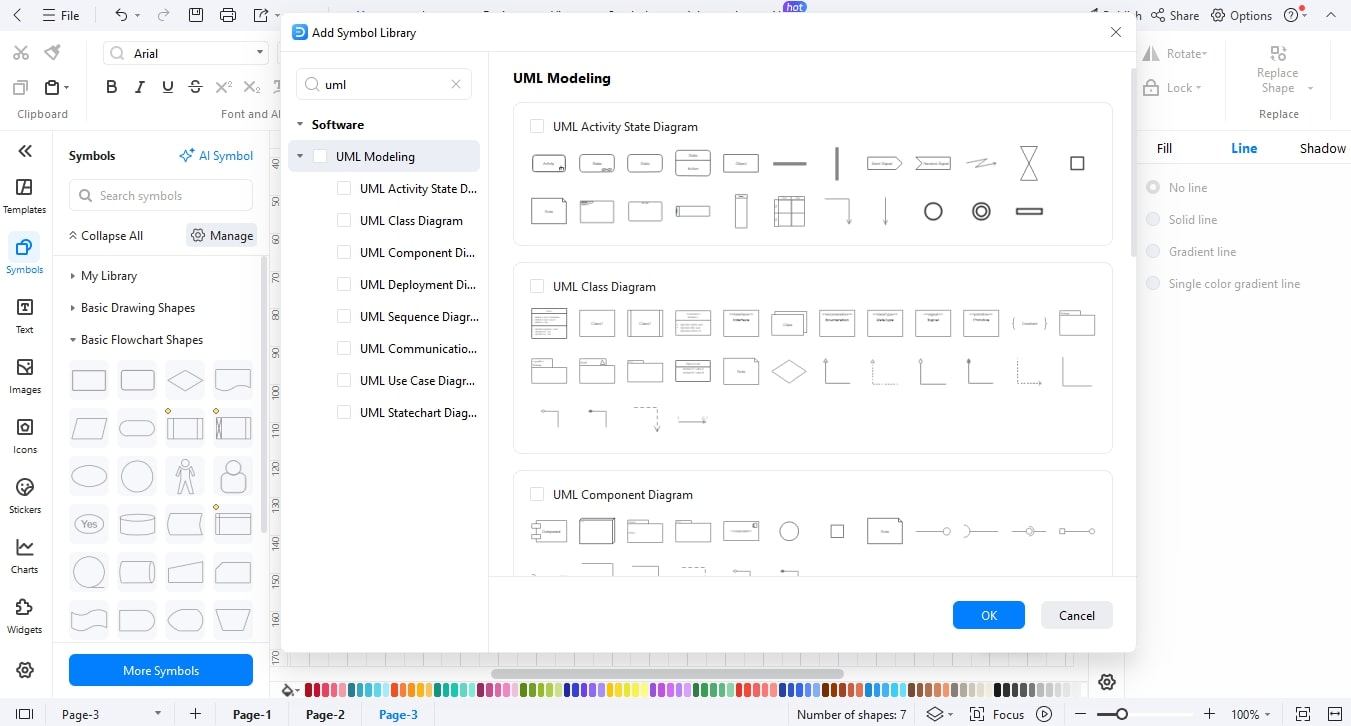
- Navigate to the left-hand pane, then click Libraries
- Click More Symbols, then turn on the UML Component library.
- Press OK to select the library.
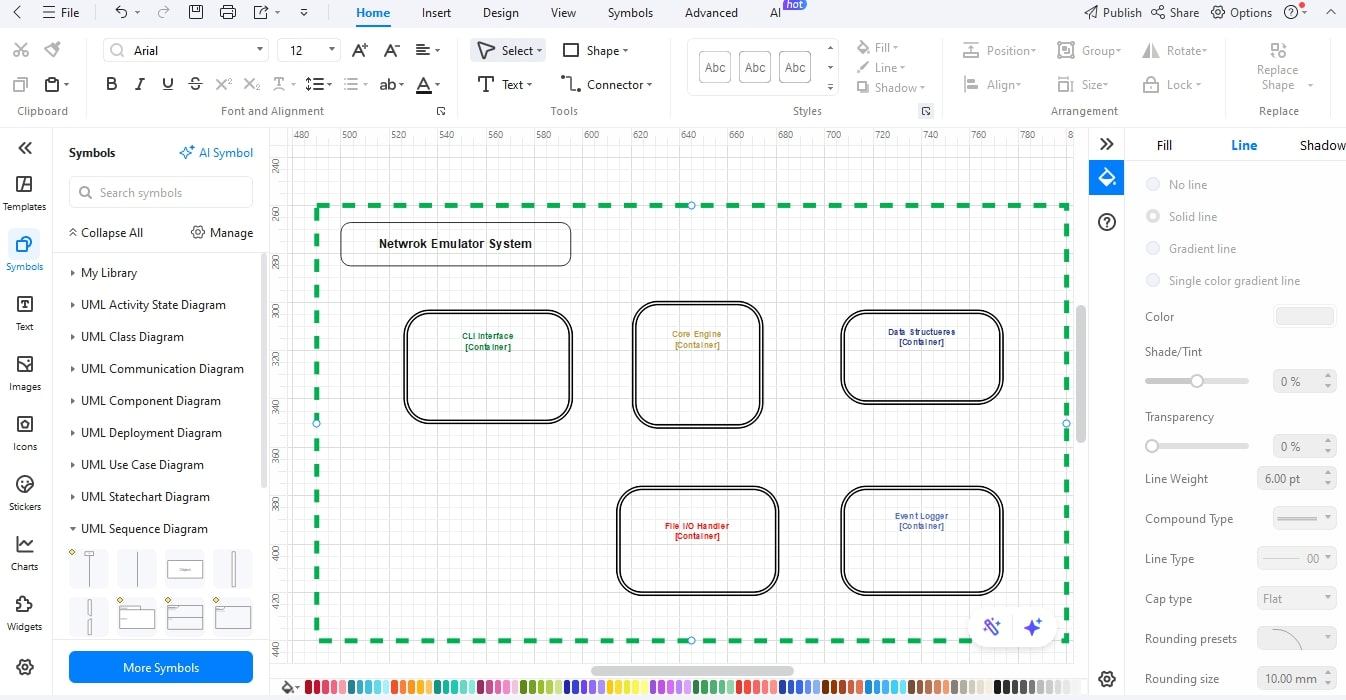
Step3 Define System Boundaries
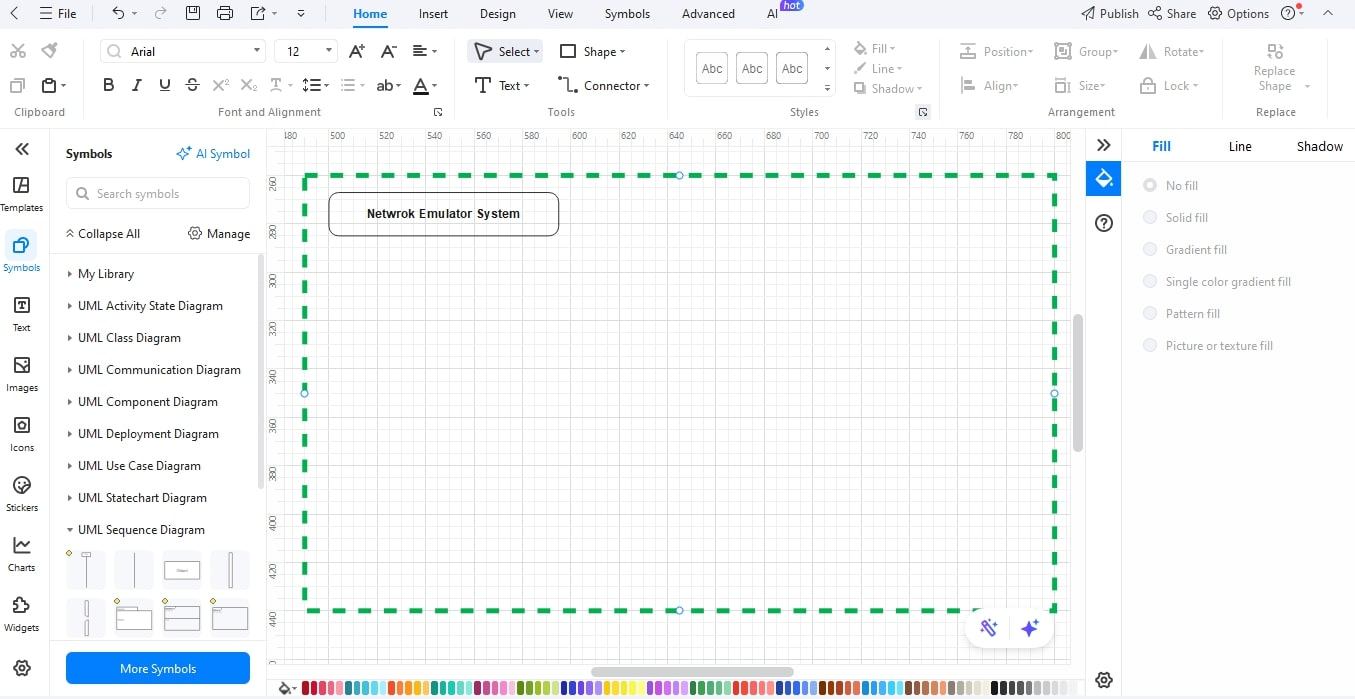
- Make a big rectangle as a representation of the system boundary.
- Label it with the name of the system (e.g., E-Commerce Platform).
Step4 Place and Label Containers
- Move the container shapes within the boundary
- Assign each a brief name, such as “Web Appliances or Order Database.
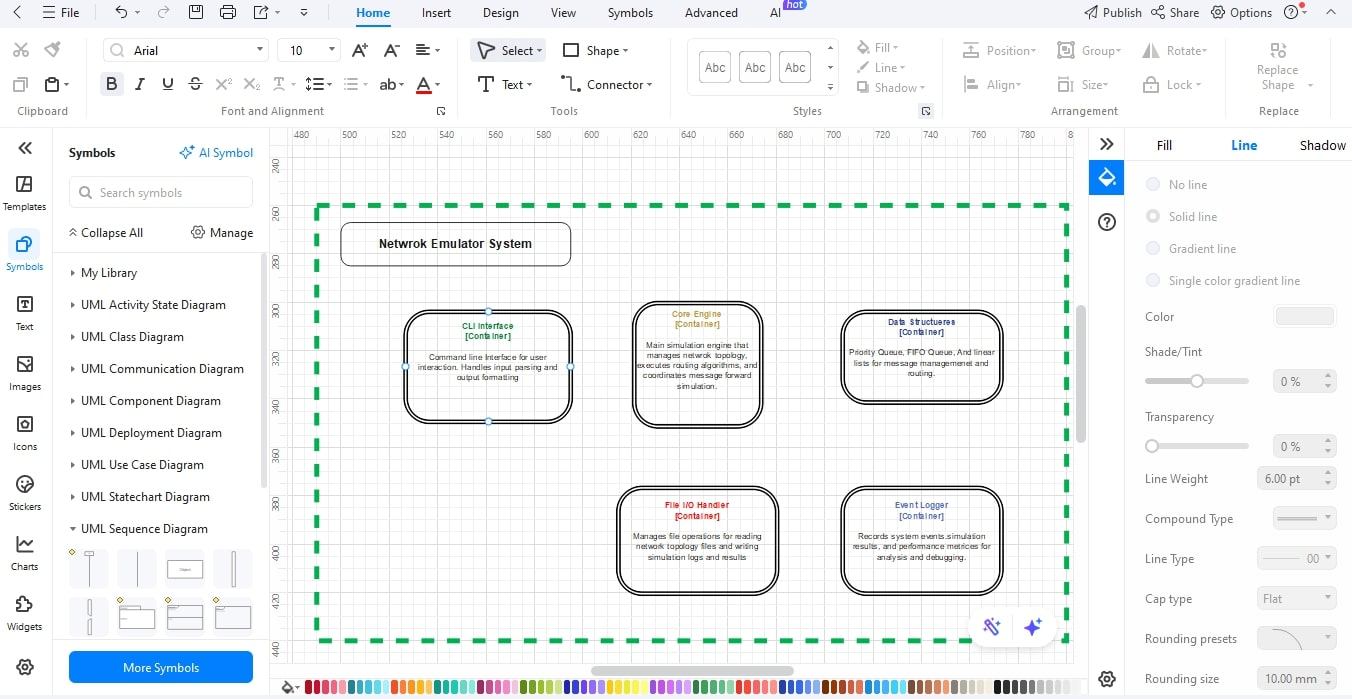
Step5 Detail Responsibilities
- Each container should have a text box with a description of its principal purpose (e.g., “Handles customer requests).
- Make notes short so as to be read.
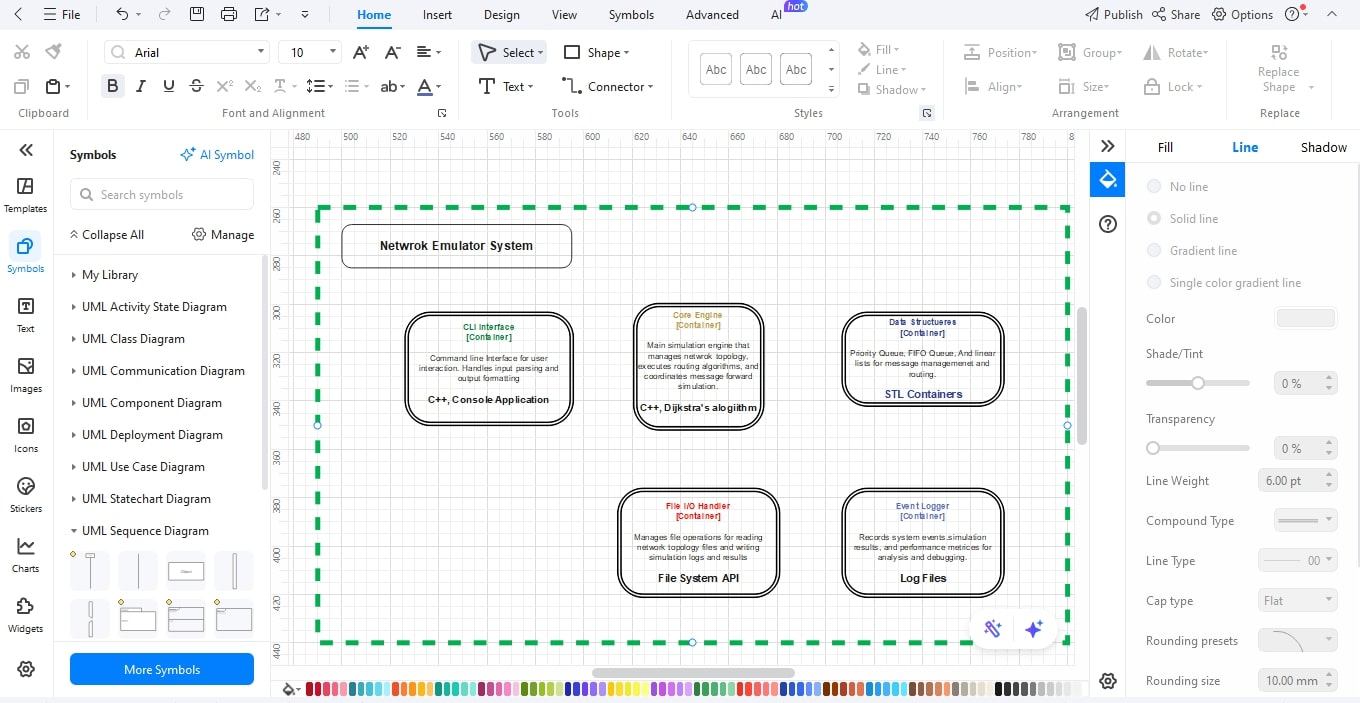
Step6 Add Technology Info
- Move beneath the responsibilities
- List the technology involved--frameworks, languages, and the type of database.
Step7 Connect with Relationships
- Indicate communications between containers in the form of arrows.
- Assign to each arrow the protocol or data flow (HTTP, API calls, etc.).
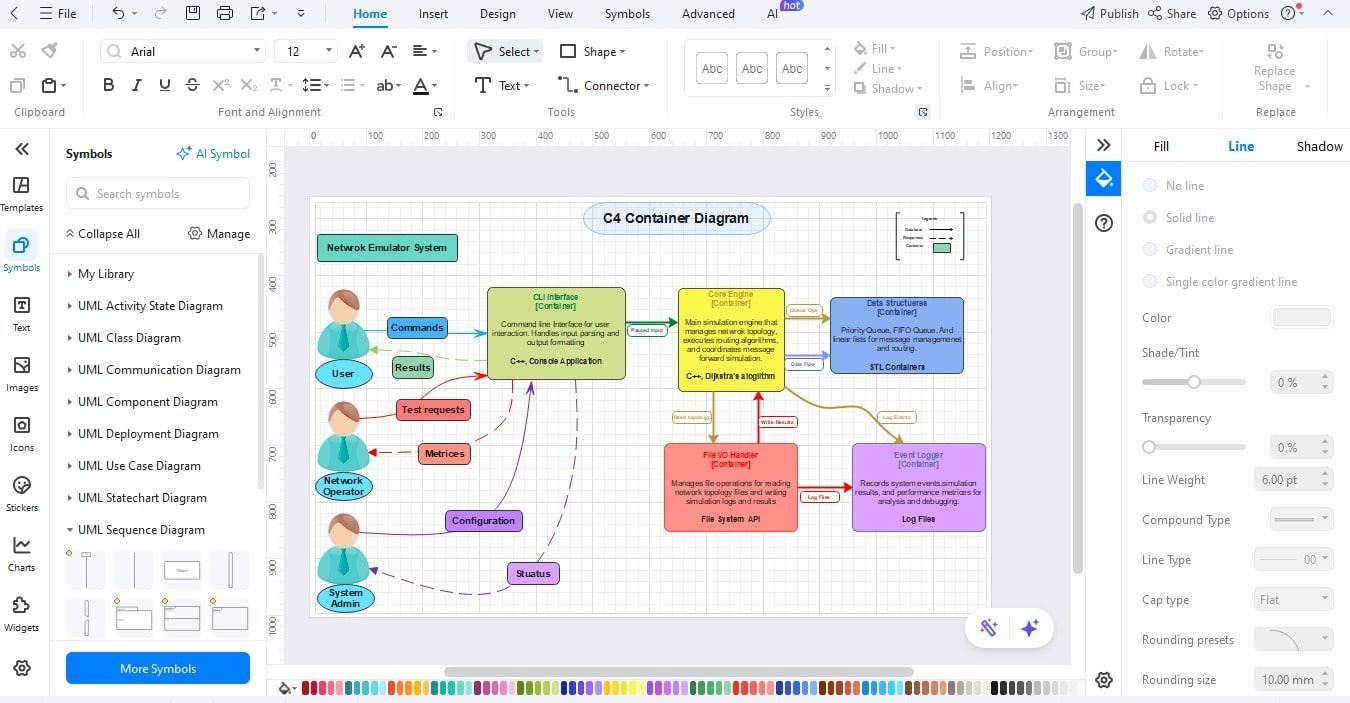
Once these steps are finished, a difference in your C4 container diagram will provide a clear and precise picture of all containers, their duties, and the technology stack.
The export options of EdrawMax simplify the collaboration process to a great extent, allowing users to share diagrams with other members of the developers, architects, or stakeholders in any format. This orderly process will keep your software architecture diagrams accurate and simple to maintain as the system continues to expand.
Conclusion
C4 container diagrams are a good bridge between the overall picture and the actual design of a system. They allow teams to observe how applications, databases, and services integrate, to plan, review, and communicate about complex software structures more understandably. This is a detailed but high-level view at the same level that keeps all of the people on track, including the developers and other stakeholders.
The development of C4 container diagrams is quicker and more professional with EdrawMax. The drag-and-drop shapes, its in-built libraries, and export options save time and enhance accuracy. Begin creating your own software architecture drawings today to capture systems in a nice way, exchange ideas at haste, and uphold each project against the actual requirements of the real world.
AI Diagram Generator
Enter your prompt. Upload files if needed. Generate diagrams, charts, or slides instantly.


